
 ?Mathematical formulae have been encoded as MathML and are displayed in this HTML version using MathJax in order to improve their display. Uncheck the box to turn MathJax off. This feature requires Javascript. Click on a formula to zoom.
Abstract
The objective of economic success is not only to achieve positive developments in economic indicators, but to ensure a high living standard and quality of life for the population. It is therefore necessary to measure economic success in terms of social and socio-economic indicators, which indicate the quality of life of the population. A relevant indicator of economic development and economic performance is the gross domestic product (GDP) per capita. Although this indicator is the most widely used, it has recently been subject to a wave of criticism. Therefore it is necessary to evaluate the economic success, taking into account other variables, which in themselves imply social indicators: net economic welfare, Human Development Index (HDI), Index of Competitiveness, Index of Economic Freedom (IEF), Prosperity Index, Corruption Perception Index and others. The subject of this article is to evaluate the economic performance of the Visegrad Group countries using GDP per capita and selected socio-economic indicators. We use the method of time series analysis to examine the development of selected indicators. To compare their development we use the method of comparison, and to formulate the findings we use the method of synthesis. In order to evaluate the performance of the Visegrad countries we use scoring method.
1. Introduction
Gross domestic product (GDP) is considered as an essential economic indicator because it best represents the performance of an economy based on the outcome of production factors located in the national territory. This indicator best characterises the processes occurring in the economy, as well as its overall performance (i.e., what was produced and purchased in the economy), and thus it affects all other macroeconomic variables. On the other hand, against GDP as a dominant indicator for several decades, there has been developing research aimed at criticism of GDP, as well as construction of alternative (additional) indicators that would better reflect the aggregate performance of economic and social system. Therefore, it is adequate to understand the term ‘performance’ from a wider aspect, i.e., the GDP to be used to assess the performance of state in combination with other alternative indicators, which reflect the socio-economic aspects of society development and quality of life of population in society. We agree with the authors Vojtovič and Krajňáková (Citation2014) that the GDP intended for final production assessment cannot be expected to measure and assess all other aspects of life. For a more accurate and detailed assessment of society’s performance and well-being it is appropriate to use a combination of several indicators taking into account other aspects of society functions. In professional literature there are alternative indicators regarding how to measure economic performance such as: net economic welfare, real economic development, Human Development Index (HDI), Index of Human Suffering, Index of Economic Freedom (IEF), Well-being Index and the Global Competitiveness Index (GCI), among others.
There are advantages and disadvantages while using the GDP to measure the performance of economy. The availability of statistical data necessary for its assessing national territories is a positive aspect of its use. Kordoš (Citation2012) argues that based on the state and development of a country’s GDP, the overall economic activity on the State’s territory as well as the economic success of states in international comparisons can be best evaluated, since most countries of the world use GDP to assess their performance. Due to the objective performance comparisons of different sized economies, the GDP per capita in USD, EUR or PPP is used for international comparisons.
On the other hand, not forgetting the fact that many economists do not consider GDP to be a perfect indicator, it does not reflect the well-being and living standards of state citizens. It only includes production and services registered by the official economy, although the results of domestic work and grey and black economy often significantly affect increases, respectively reducing the welfare of the population. GDP also includes outputs which are not subject to purchase and sale (services of education, health, defence). Since these services are not executed on the market they do not have their market prices, however the costs of their provision are included in GDP. Another negative example is the fact that the cost of environmental damage and natural disasters removal are included in the prices of products and services which increases the GDP, however the environmental pollution reduces the welfare of people. The paradox is that the serious damage removal caused by natural disasters or wars can be a source of economic growth. Another drawback of this indicator is that the price increases as a result of using unnecessarily expensive materials or packages, based purely on aesthetics. This causes GDP growth, although the utility value of those products may not be growing. On the contrary, in the case of some products (e.g., electronics) their quality substantially increased but, despite this, their prices were falling, so the increasing quality of those products does not contribute to the GDP growth. Van der Bergh (Citation2009) argue that GDP suffers from many serious shortcomings, but despite all theoretical- and empirically-motivated criticisms of GDP as a social welfare and progress indicator, its role in economics, public policy, politics and society remains influential.
We cannot ignore that GDP is also affected by many other factors. Some authors in their research have been assessing the impact of these factors on GDP. Lučić, Radišić, and Dobromirov (Citation2016) explored the causality between corruption and the level of GDP. Trošt and Bojnec (Citation2015) showed the causality between public wage bill, exports and economic growth in Slovenia. Yu and Wang (Citation2013) examined political risk and economic development (GDP per capita). Nurazira, Dauda, Halim Ahmad, and Azman-Saini (Citation2013) was analysing the contribution of external debt to economic growth in Malaysia. Simionescu, Popescu and Firescu (Citation2017) recognised the relationship between GDP and monetary variables in Romania. Ivanović and Stanišić (Citation2017) studied the monetary freedom and economic growth in New European Union Member States. Novak and Pahor (Citation2017) explored the influence of economic development on the subjective well-being of individuals.
Internationally established commission, whose results are included in so-called Stiglitz report (Stiglitz, Sen, & Fitoussi, Citation2010) dealt with this professionally discussed topic. It includes following objections to GDP:
| • | Items counting into GDP – GDP includes mainly market production only a small part of nonmarket output, because it is an indicator of overall economic performance. | ||||
| • | Problem of depreciation – GDP estimation does not take into account the extent of capital goods recovery. | ||||
| • | Education and health care – estimated value of public goods, health care and education does not exist, GDP does not reflect value of such services. In international comparisons a service can be provided as a public good as well as a private good. | ||||
| • | Problem of qualitative changes capturing – inflation distinction from qualitative changes in goods and services is considered to be a complex statistical problem. | ||||
| • | GDP does not reflect the state of environment – to identify environmental impacts on economic growth in society can be done by the System of Environmental and Economic Accounting (SEEA), which is a satellite system of SNA (System of National Accounts). Environmentally adjusted GDP takes into account costs associated with natural resources exploitation, pollution and environmental degradation. | ||||
2. Theoretical background and literature overview
GDP is still a key indicator to express the economic growth of the state, while by its measuring and expressing it is necessary to take into account a broader understanding of context regarding the society development what can be also presented by the economic development indicator.
Economic growth has a strong theoretical grounding and is easily quantified as an increase in aggregate output. In theorising economic growth, Solow (Citation1994) and many others conceptualise an economy as a machine that produces economic output as a function of inputs such as labour, land, and equipment (Kuznets, Citation1973). Output can increase either when we add more inputs or use technology or innovation in order to enhance the efficiency with which we transform inputs into outputs. In part because of this straightforwardness, economic growth, with its emphasis on increases in population, employment or total output dominates the debate, despite the fact that increases in any or all of these could be associated with both improvements and/or declines in prosperity and quality of life. The consensus is that development is a fuzzier and more far-reaching idea, Lucas (Citation1988) notes, ‘we think of (economic) growth and (economic) development as distinct fields, with growth theory defined as those aspects of economic growth we have some understanding of, and development defined as those we don’t.’ Our preoccupation with growth is an often-discussed problem.
If economic development is not the same as economic growth, then what exactly is it?
Defining development in this way and contrasting it with growth gives sense to the outcomes of economic development. Equally important are the specific capacities germane to the process of economic development. Economic development, according to Schumpeter (Citation1934), involves transferring capital from established methods of production to new, innovative, productivity-enhancing methods. Schumpeter’s conceptualisation was focused on understanding the origins of the business cycle and the conditions that gave rise to new opportunities that propelled the economy forward to a higher economic growth trajectory. Schumpeter discusses the emergence of systems of complementary capabilities that develop around key radical innovations to create economic growth. For example, economic development that occurred with the industrial revolution as the means of production changed in the textiles industry. This generated a variety of social and economic effects that then extended to other complementary sectors, and diffused throughout the economy.
Now let us take a look at economic development. A country’s economic development is usually indicated by an increase in citizens “quality of life”. “Quality of life” is often measured using the HDI, which is an economic model that considers intrinsic personal factors not considered in economic growth, such as literacy rates, life expectancy and poverty rates. As stated by Filippidis and Katrakilidis (Citation2015), human development represents a broader concept than the GDP per capita variable that has been a common practice in the literature as a standard measure of development, since it measures the average achievements in three basic dimensions of a country’s development: health, knowledge and development. As stated by Yakunina and Bychkov (Citation2015), human development is the process of expanding the range of choices. The most important elements of choice are to live a long and healthy life, education and a decent standard of living. Additional selections include political freedom, guaranteed human rights and self-esteem.
While economic growth often leads to economic development, it is important to note that a country’s GDP does not include intrinsic development factors, such as leisure time, environmental quality or freedom from oppression. Using the HDI, factors like literacy rates and life expectancy generally imply a higher per capita income and therefore indicate economic development.
These dimensions are derived from the notion of human capabilities as proposed by Amartya Sen and are regarded to be the essential requirements for enhancing human capabilities. As such ‘the process of economic (human) development can be seen as a process of expanding the capabilities of people’ (Sen, Citation1988, p. 497). While it may be argued that there are other dimensions which could equally be regarded as essential, such as law and order, peace, security and freedom, it has been suggested that the components of the HDI together seem to provide an almost acceptable package of indicators of the level of living at an aggregate level (Dasgupta and Weale, Citation1992). The HDI has been criticised on the grounds of harshly curtailing income above a selected threshold and thereby not considering the income differentials, for those countries with relatively high incomes, adequately. It has also been suggested that there is no reason why the principles of diminishing returns would not be applicable to different components of the index (Kelly, Citation1991; Sen, Citation1998).
Streeten (Citation1994) voices concerns about the addition of political and human rights variables to the HDI on the grounds of differential objectivity with which these dimensions are measured, differential volatility, and the importance of each concept in its own.
A large number of concepts of competitiveness have been proposed in the economic and business literature. In the present survey we contrast first microeconomic with economy-wide (macroeconomic) interpretations. This distinction is the most fundamental one because the simple extension of micro concepts to the macro level poses results.
Although in recent years the public discourse has focused more on the macro concept, it is less well established in economic theory than the micro concept. Interpretation of macroeconomic competitiveness that is more in line with the original meaning of the term is an aggregate of the microeconomic concept. In this view an economy is deemed to be competitive if it harbours a large number of internationally competitive enterprises and industries. In other words, it must perform strongly in exports.
Among the micro-economic indicators measuring more than one dimension, the perhaps best known one is the concept of Porter (Citation1990), but Buckley, Pass, and Prescott (Citation1992) are also interesting attempts to capture more than one dimension of the concept. According to Porter there are four main determinants of competitiveness of enterprises: their strategy, structure and rivalry, the demand conditions they face, the factor supply conditions they encounter, and the conditions of related industries. Paraušić, Cvijanović, Mihailović, and Veljković (Citation2014) stated that theories of competitiveness and economic growth and development have changed and evolved over time. In response to the question of which production factors contribute most to economic prosperity of a country and its competitiveness, the researchers firstly considered the natural resources and the importance of production factors availability (capital accumulation enables specialisation and division of labour and contributes to a higher productivity). Afterwards, they have realised the importance of technological progress as an endogenous variable (a variable that depends on the company and government investment in human capital, that is, in education and skills), the importance of innovation and knowledge (accumulated human capital of high expertise and specialisation), their spreading through externalities (which are most visible in clusters), as well as the importance of a proactive, dynamic and challenging business environment.
Many empirical studies have found a positive relation between economic freedom and economic growth (Barro, Citation1999; Scully and Slottje, Citation1991; Torstensson, Citation1994). Hanke and Walters (Citation1997) study the relationship between economic freedom and GDP per capita and find it to be significant and positive. Leschke (Citation2000) shows that, in particular, the framework within which the market economy functions and the degree of interventionism in the political process are of great importance for the wealth of nations. Goldsmith (Citation1995) uses the IEF and shows that developing countries that better protect economic rights tend to grow faster, have a higher average national income, and have a higher degree of human well-being.
Human Development Index The average purchasing power takes into account the level of education and health care in the country. Initially the index was created on the basis of three criteria:
| ־ | Life expectancy – life expectancy at birth, | ||||
| ־ | Level of education – education index measured by combining the literacy rate of adult population (2/3 weight) and being combined the rate of enrolment for primary, secondary schools and universities (1/3 weight), | ||||
| ־ | The living standard of the population – GDP index measured as real GDP per capita in USD calculated by purchasing power parity. | ||||
| ־ | The UN Office for Human Development Report in 2010 introduced a new HDI classification by several key indicators modification. Indicators have been changed as follows: | ||||
| ־ | Life expectancy at birth | ||||
| ־ | Educational level – assessed based on two criteria: the average number of years of adults schooling (25 years) and expected length of children schooling (starting the schooling), while the average of these criteria is being calculated. | ||||
| ־ | The standard of living of the population – assessed by gross national income per capita, representing the total revenue from the economy being generated in the state’s possession and calculated per capita. | ||||
As the name of another indicator suggests, the GCI is focused on the economy’s ability of to succeed in international competition. Since 2004 it has been presented by the World Economic Forum (WEF). In the past the GCI and the Current Competitiveness Index (CCI) have been reported. In 2007 the methodology for calculating the index of global competitiveness was changed and for the purpose to evaluate the inter-annual changes the 2006 year’s results were calculated by a new method. The GCI index assesses the competitive environment in the reporting countries of the world on the basis of their ability to assure sustainable economic growth and a high level of prosperity for their citizens, the microeconomic and macroeconomic factors of competitiveness are part of it.
GCI consists of 12 pillars of competitiveness, which are classified into three sub-indices according to whether their growth is based on the factors of production, efficiency and innovation (Figure ). Each of these pillars consists of between seven and 20 sub-indicators. Some sub-indicators are evaluated on the basis of available statistical data; others are the result of the Global Executive Opinion Survey. The GCI assesses national competitiveness, while in pillars and sub-indices there are indicators of macro-economic character, which primarily do not reflect the competitiveness at the micro level, however legal competitive businesses creates national competitiveness. In literature we find the views of experts who do not consider this index as a relevant indicator for evaluating the competitiveness of national economies. For example, Krugman (Citation1994), underlines that labour productivity is to be the basic criterion of economic competition among states. A failure of the company in terms of competitiveness is its leaving the market, but unsuccessful national economies do not leave the market. Under very adverse circumstances states may be facing bankruptcy due to the accumulation of external debt in foreign currency. Habánik and Hostak (Citation2014) argue that this critical view has never been dominant, and the competitiveness category is generally used to assess and promote the economic policies of states such as the Lisbon Strategy, Europe 2020.
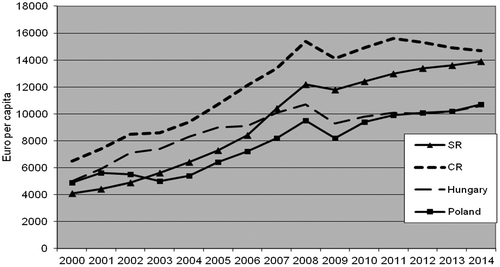
Figure 1. GDP per capita in V4 countries (current prices, euro per capita). Source: Authors’ elaboration, based on the Eurostat data (Citation2015), ESA 2010, in Poland: estimated SR – Slovak Republic, CR – Czech Republic.
Economic freedom is closely related to economic growth. Ismail and Hook (Citation2012) argued that there are interactions between economic freedom, income inequality and economic growth. The empirical results reveal that economic freedom and income inequality are statistically significant determinants of economic growth. Improvements in both economic freedom and income equality lead to economic growth.
The Index of Economic Freedom The IEF is an indicator published annually by the US-based Heritage Foundation in cooperation with the editorial staff of the Wall Street Journal newspaper. This indicator has been published since 1995; it assesses the level of economic freedom in 177 countries. The Heritage Foundation (Citation2015) defines economic freedom as the fundamental right of every human to control his or her own labor and property. The IEF is compiled on the basis of 10 categories: property rights, level of corruption, tax burden, government expenditure, business environment, labour market, monetary stability, international trade, investment conditions, and financial sector.
Also, other authors and companies bring a new perspective to assess the performance of countries, and they create other indicators regarding how to measure the performance, for example the Net Economic Welfare, Prosperity Index, Better Life Index, Genuine Progress Indicator, among others. Rašić Bakarić, Tkalec and Vizek (Citation2016) have constructed a monthly coincident indicator of real economic activity in Croatia, which covers 15 important sectors of economy classified as prices of industrial products, consumer prices, industrial production, construction, trade, tourism, unemployment, employment, gross wages, net wages, capital market, monetary statistics, fiscal indicators, international series/statistics and foreign trade.
3. Goal and methodology of the article
The goal of this article is to examine and compare the performance of Visegrad Group countries (Slovak Republic [SR], Czech Republic [CR], Hungary and Poland) by means of selected indicators such as GDP, HDI, Competitiveness Index and the IEF.
In examining the issues, we use a time series macroeconomic analysis to examine and evaluate the indicators development in V4 countries, to compare them the method of comparison will be used. To formulate the findings, methods of synthesis will be used. A scoring method will be used to evaluate the performance of V4 countries on the basis of selected indicators.
In scientific literature and papers different forms of scoring methods are used for different purposes. Scoring methods as one of the multi-criteria evaluation methods of alternatives and companies’ performance has been stated by Neumann (Citation2007), Synek, Kopkáně, and Kubálková (Citation2009), Zalai, Dávid, Šnircová, Moravčíková, and Hurtošová (Citation2010), Rejnuš (Citation2014) and others. The scoring method as a method about how to assess the regional level based on a number of indicators followed by a regional discrepancies assessment, is stated by authors such as Kutscherauer et al. (Citation2010), Tuleja (Citation2010), Svatošová and Novotná (Citation2012), Michálek (Citation2012), Hamada (Citation2014).
In our article we used the scoring method as follows:
For each parameter we assign the country, which reached the best value, 100 points, and other countries are assigned indicator points as follows:
if the maximum value is the best value:
(1)
(1)
if the minimum value is the best value:
(2)
(2)
where: xij=the value of j-th variable in the i-th country
xjmax = highest value of the j-th variable
xjmin = lowest value of the j-th variable
bij=the scores of the i-th country for the j-th variable.
Then we calculate the integral variable di,, as the arithmetic average of the points for the indicators established for each country as follows:(3)
(3)
where:
pi = the number of evaluated variables.
The best results of observed variable is given to the country in which the integral indicator di reaches the maximum value.
The scoring method shows by means of average number of points being obtained the relative differences among particular countries in assessed parameters, when all territorial units are being compared with the best regional unit in particular indicator. The advantage is the ability to summarise the indicators being measured by different measurement units into a single synthetic characteristic, which is a dimensionless number. By means of this obtained integral indicator we can estimate either the ranking of particular countries, or the differences between particular countries, how one country may be falling behind other countries.
Data are taken from the international organisations databases assessing the development of selected indicators (International Monetary Fund, Eurostat, UNDP, WEF, Legatum Institute, Heritage Foundation, and others). To assess the issues of economic performance and its associated selected economic indicators we have chosen the Visegrad Group, that have similar economic and social characteristics and close cooperation. Their cooperation is developing in the fields of economy, infrastructure, energy, cross-border cooperation, culture, coordination of foreign policy positions and promoting common economic and political interests in the EU as well as in relations with third countries and regions.
As the official Visegrad Group (Citation2017) website reported, the group wishes to contribute towards building the European security architecture based on effective, functionally complementary and mutually reinforcing cooperation and coordination within existing European and transatlantic institutions. In order to preserve and promote cultural cohesion, cooperation within the Visegrad Group will enhance the imparting of values in the field of culture, education, science and exchange of information. All the activities of the group are aimed at strengthening stability in the Central European region. The participating countries perceive their cooperation as a challenge and its success as the best proof of their ability to integrate also into such structures, such as the European Union.
Schmidt (Citation2016) stated that V4 members have managed to preserve their importance and position in the European context and this special type of regional integration has survived a great deal and may now serve as a model for other partnerships. Chistruga and Crudu (Citation2016) claim the European Integration of Baltic, Central and South Eastern European countries provided new opportunities for economic development. The business environment and economic infrastructure improvement has led to the increased international competitiveness of the countries. One of the most important instruments of European integration is the redistribution of financial resources or EU funding, which is intended to assure economic and social cohesion between the West and East EU countries.
4. Results and discussions
4.1. Evaluation and comparison of the Visegrad Group countries’ performances
The purpose of this article is to evaluate the overall economies’ performance of the Visegrad Group countries on the basis of selected indicators. The first indicator is GDP per capita. GDP per capita reached within the V4 is shown in Figure .
The graphic GDP evolution per capita in V4 states shows its annual growth when, except in 2009, the economic crisis was reflected by a GDP per capita drop in V4 countries. In the Czech Republic, GDP per capita decreased slightly after 2011. Throughout the reporting period the Czech Republic reached its highest GDP per capita in 2000 – it was €6500, in 2014 t was €14,700 – an increase over 126%.
In the years 2000–2006 the second highest GDP per capita was in Hungary, but in 2007 Slovakia overtook Hungary, and Poland in 2012. In Hungary GDP per capita increased from €5000 in 2000 to €10,600 in 2014, i.e., and increase of 112%. While in 2000 the Hungarian GDP per capita was 76.92% of the GDP per capita in the Czech Republic, in 2014 this figure was only 72.11%. In the reporting period the Slovak Republic had the biggest increase in GDP per capita, from €4100 to €13,900 in 2014, i.e., an increase of 239%. The share of GDP per capita in Slovakia at the level of GDP per capita of the Czech Republic increased from 63.08% in 2000 to 94.56% in 2014. In Poland we can see a positive GDP per capita development, especially after 2003. GDP per capita increased from €4900 in 2000 to €10,700 in 2014, representing an increase of 118%. The share of Poland’s GDP per capita level versus that of the Czech Republic’s GDP per capita decreased from 75.38% in 2000 to 72.80% in 2014. Real GDP, i.e., GDP expressed by constant prices in the base period is the basis for the GDP growth rate assessment as an indicator of economic development. Figure shows the evolution of economic growth rate in the V4 countries.
Figure 2. Development of GDP growth in the V4 countries (%). Source: Authors’ elaboration, based on the Eurostat data, SR – Slovak Republic, CR – Czech Republic.
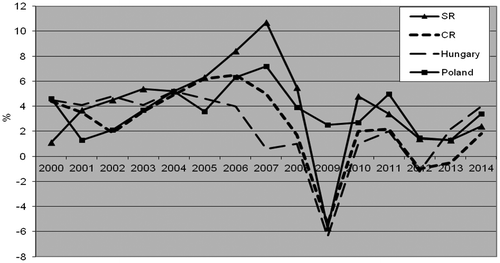
GDP growth in the Visegrad Group countries had fluctuating development in years 2000–2014. In early years in SR there can be observed slow GDP growth, later on the GDP growth rate increased gradually up to 10.7% in 2007, which is also the highest achieved GDP growth rate during the entire period in all the V4 countries. However, in 2009 in Slovakia, the economic crisis was reflected by a significant decline in GDP, when it fell from the previous year by 5.7%. Although in following years the GDP growth rate was positive, compared to the pre-crisis year, it has been significantly lower.
GDP development growth in the Czech Republic was similar to that of Slovakia, with the difference of not achieving such high levels of economic growth the highest growth was recorded in Czech Republic in 2006: – 6.5%. Also, the Czech economy was hit by the crisis quite significantly, and its GDP in 2009 decreased by 5.4%. In the following two years, a positive GDP growth has been achieved, but in 2012 and 2013 the GDP decreased slightly again, so the GDP growth rate became negative. The GDP growth development in Hungary has been different. Since 2005 there was a slowdown in economic growth, and the economic crisis has caused a GDP slowdown by 6.4% in 2009. Since then, Hungary has generated a moderate GDP growth (except in 2012); in 2014 real GDP grew by 4%. In Poland we can see the annual real GDP growth (the best in 2007: 7.2%), and the economic crisis has just caused its small slowdown.
The HDI assesses human development based on the life expectancy at birth, educational level and living standards. The HDI values development in the V4 countries in years 2000–2014 is seen in Figure 3.
As highlighted in Figure , by far the highest HDI value in the whole observed period have been achieved by CR , the index has increased from 0.821 in 2000 to 0.870 in 2014. Among the other V4 countries there are not such big differences in the index. Hungary had the worst results in HDI value. Table shows detailed results of partial HDI indicators in V4 countries in 2014.
Figure 3. HDI development in V4 countries. Source: Authors’ elaboration, based on the UNDP data (Citation2015).
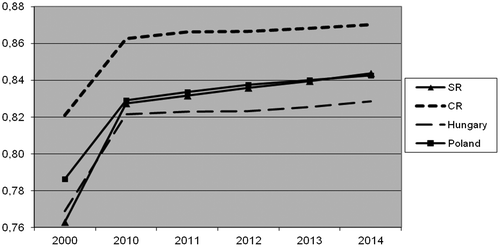
Table 1. HDI key indicators in V4 countries in 2014.
Regarding all the indicators, the Czech Republic has the best position among the V4 countries. Life expectancy is higher there by 3.4 years when compared to Hungary. The lowest average number of years of adults’ schooling is seen in Hungary, but the lowest expected length of children’s schooling is in Slovakia. There are quite big differences among the V4 countries in terms of GDP income per capita, because Hungary as the worst is reaching almost 86% of this indicator’s level scored in the Czech Republic.
The results of individual countries in the GCI can be examined on basis of achieved score (index value) or ranking within the evaluated countries. In the latter case, however, we must take into account the fact that the number of rated countries is changing. The latest results of the GCI were published in 2015, when the WEF rated competitiveness in 140 countries. The GCI development values in V4 countries are presented in Figure .
Figure 4. Development of GCI values in the V4 countries. Source: Authors’ elaboration, based on the WEF (Citation2014).
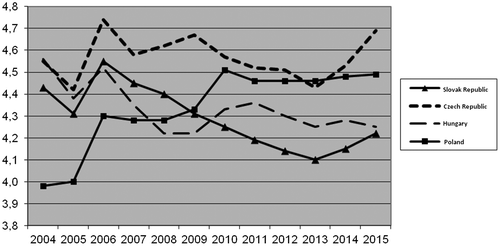
From Figure it can be seen that the V4 countries competitiveness values in the years 2004–2015 are in the range of 3.99 to 4.74. During the reporting period the Czech Republic reached the highest GCI index value (with the exception of 2004 and 2013) in 2006, up to 4.74. Since then, however, the Czech Republic’s competitiveness level has been decreasing, to 4.43 in 2013, but in 2014 and 2015 it increased (2015: 4.69). In 2013 Poland achieved the highest GCI index value of the V4 countries and scored a significant shift in the competitiveness level recorded in 2006 and 2010.
The competitiveness of Hungary was the highest among the V4 countries in 2004. In the assessing period the values fluctuated and in recent years they have been declining. The worst results in the competitiveness level were from Slovakia. Apart from the growth in 2006, the GCI value of Slovakia decreased further, from 4.55 in 2006, to 4.1 in 2013, but in 2014 and 2015 there was a slight improvement to 4.22 (2015). While in 2006–2008 within the competitiveness level, Slovakia was at second place among the V4 countries. Since 2010, however, Slovakia is the least competitive country of the V4 countries. This fact is proved by a position achieved in competitiveness ranking, which can be seen in Table .
Table 2. Ranking of the V4 countries in the GCI.
The Slovak Republic’s competitiveness position since 2007 has been getting worse annually, and in 2013 it reached the 78th spot. In 2014 Slovakia’s position improved slightly, it moved up to 75th place, and in 2015 moved to 67th place. The most significant decline Slovakia reached was in 2010, when there was a decrease in competitiveness by 13 places. Even the Czech Republic recorded a slight drop in its competitiveness in 2012 when it ranked 39th, and in 2013, 46th. Figure and Table show that Poland had the most favourable competitiveness development among the V4 countries.
Based on the latest GCI results, the Czech Republic and Slovakia have been moved to the third stage. Hungary and Poland are in the interim period between the second and third stages. On closer evaluation of V4 positions, we discover that 78th place for Slovakia in 2013 is historically the worst ranking in competitiveness, which makes Slovakia the third least competitive EU country; only Croatia (77th place) and Greece (81th place) have been ranked worse. Figure shows the percentage of V4 countries within the particular GCI pillars evaluation in the latest available reporting period, i.e., in 2015.
Figure 5. V4 countries success comparison within the particular GCI pillars in 2015. Source: Authors’ elaboration, based on the WEF.
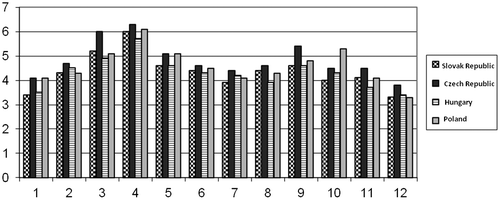
In general, the best results the V4 countries have achieved are in Pillar No. 4: Health and Primary Education. The Czech Republic is very successful in Pillars 3 and 9. Poland is successful in Pillar 10, as it has the largest market among the V4 countries. The worst results the V4 countries have achieved in is the pillars of Institutions and Innovation, in these pillars Slovakia is lagging behind the other V4 countries.
The trend in the V4 countries’ economies development based on the IEF is shown in Figure , expressed in percentages.
Figure 6. IEF development in V4. Source: Authors’ elaboration, based on The Heritage Foundation (Citation2015), SR – Slovak Republic CR – Czech Republic.
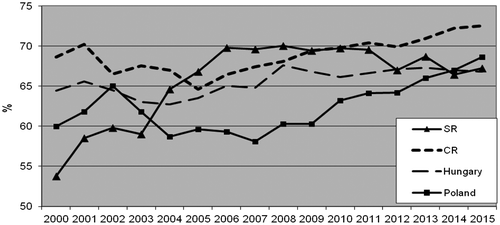
Figure 6 represents a positive IEF development in Slovakia between 2004 and2011. In the years 2005–2008 Slovakia achieved the best results among the V4 countries. In recently reviewed years the Czech Republic has reached the highest Economic Freedom index value in 2015, up to 72.5%. In the years 2004–2013 Poland achieved the worst results, but we can see a gradual index value increase from 58.1% (2007) to 68.6% (2015), which puts Poland in second place behind the Czech Republic among the V4 countries. Hungary has achieved the highest index value in 2008–67.6%. While in 2000 the differences between the IEF results among V4 nations were quite large, up to 14.8 percentage points, in 2015 there was a decreasing to 5.7 percentage points. Table shows the position of V4 countries in the IEF.
Table 3. The order of V4 countries within the IEF.
Table shows that in 2000 Slovakia had the worst results in the IEF indicator, when it ranked 108th. Slovakia scored its best ranking in 2007; in the case of Hungary, it was 2008. The Czech Republic and Poland scored the best ranking in 2015. A long-term economic freedom survey of 177 countries shows that countries with higher economic freedom have higher economic performance, faster GDP growth and higher GDP per capita than countries with a low degree of economic freedom. The more economically free countries, the richer the citizens – they have higher incomes, the country’s economic growth is faster and the standard of living of the poorest people is incomparably higher than in an economically less free country. Economic freedom does not affect only income, but also quality of life. Along with the increasing level of economic freedom the quality of life and prosperity are increasing.
4.2. Visegrad Group countries performance evaluation
The performance of Visegrad Group countries is assessed and compared in years 2009–2012, while taking into account the particular states results in the indicators mentioned above. To assess the economic performance of Visegrad Group countries we use a scoring method.
4.2.1. The Visegrad Group countries performance evaluation in 2010
2010 is the first year when all data for the examined indicators regarding the V4 economies performance are available. The gained score for individual indicators and overall results of Visegrad Group countries are shown in Figure .
Figure 7. Performance of V4 countries in 2010. Source: Authors’ elaboration and calculation.
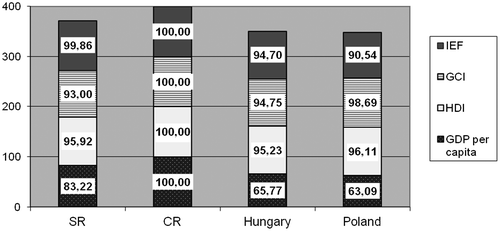
In 2010 the Czech Republic had the best results, i.e., the best performance among the V4 countries, scoring the best values in all tested variables. Slovakia earned second place with the integral indicator value of 372 points. Hungary scored third place with 350 p. Poland received only two points, less than Hungary. The largest differences in the states’ overall scores can be seen in the GDP per capita indicator.
4.2.2. The Visegrad Group countries performance evaluation in 2014
2014 is the most recent year where data for all monitored indicators are available. The V4 performance detected by a scoring method is presented in Figure .
Figure 8. Performance of V4 in 2014. Source: Authors’ elaboration and calculation.
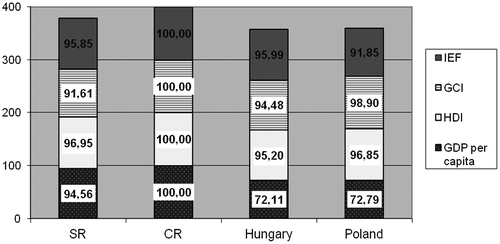
In 2014 the Czech Republic scored the maximum integral indicator value (400 points), because the Czech Republic had the best results in all indicators. Slovakia is again in second place with 379 points. Slovakia slightly improved the value of its integral indicator, mainly due to the GDP per capita improvement. Poland managed better results than in 2010 (360 points), which earned Poland third place. Hungary scored last place, nonetheless the integral indicator value has risen slightly up to 358 points.
4.3. The Visegrad Group countries performance comparison in 2010–2014
The results of particular V4 countries in recent years have been quantified by means of scoring method and the final comparison can be seen in Figure .
Figure 9. The V4 countries performance comparison in 2010–2014 (number of points). Source: Authors’ elaboration and calculation.
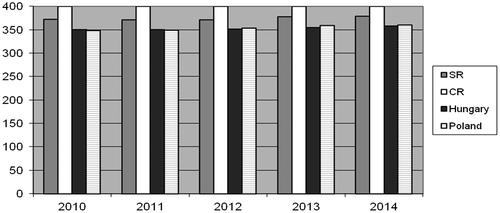
From the figures it can be seen that the Czech Republic has scored the best results in all indicators among the V4 states in 2010–2014. Slovakia’s performance was increasing annually, and was getting closer to the Czech Republic. Hungary and Poland had very even development, while Poland’s performance score has increased slightly, and in 2012 it went ahead of Hungary. Generally, we can say that the differences in the performances of V4 countries are shrinking, i.e., in the observed period the gap between the Czech Republic and the other V4 countries was reduced.
5. Conclusion
National leaders are trying to carry out an economic policy that would lead to higher the performance of a country and the living standard of citizens. Economic performance and standard of living it is relatively difficult to measure because there is no indicator for their unambiguous quantification. GDP appears to be the most used indicator to measure the economic performance in theory and practice. However, for a long time in professional circles a criticism has been growing about the GDP indicator, this resulted in Stiglitz report. However, despite this criticism, it still remains the decisive indicator regarding how to assess the economic performance of countries. The Stiglitz report recommends more focus on assessing the level of social welfare and environmental aspects, as high GDP does not automatically mean a successfully-working economy and a satisfied society. In connection with the GDP indicator criticism, many parameters (indexes) have been created worldwide trying to replace the GDP or for it to be supplemented with other aspects of well-being. Because individual indicators evaluate various aspects of performance and social life, even results within countries are different. The goal of our research was to comprehensively assess the performance of the Visegrad Group countries by means of using the results of these countries in indicators such as: GDP per capita, HDI, GCI and IEF.
Within the V4 countries regarding the macroeconomic indicators assessment, the Czech Republic is the most successful, it scored the highest values during the whole observed period in the GDP per capita indicator (current price, euro per capita), in the HDI and also the GCI, except in 2013. Regarding the assessment of GDP growth, the Slovak Republic had relatively positive development, especially in 2005–2008 when it reached the highest values within the V4 countries; Hungary also achieved this in 2013 and 2014. In the crisis year (2009) all countries showed a significant decline in economic growth, except Poland, which has maintained positive figures. The Czech Republic also reached the best values in the indicator of global competitiveness, except in 2013, when Poland scored the best values. The worst development in this indicator can be seen in Slovakia; in 2013 there was a big drop in the Slovak Republic. Within the IEF from 2005 till 2014, the best assessment was scored by Slovakia and the Czech Republic, in 2015 it was Poland. The complex assessment of the V4 countries economic performance has been implemented by means of a scoring method. The scoring method was considered as an appropriate method because it can be applied to assessment of both quantitative and qualitative criteria, being expressed by the number of points from the selected scoring track.
Based on the scoring method results, we note that within the V4 countries Czech Republic is the most successful country in terms of indicators being assessed when in 2010–2014 the Czech Republic reached the highest values in all tested indicators, i.e., the value of integral indicator has reached 400 points. The second notch belongs to the Slovak Republic; its performance has been approaching year by year the level of the Czech Republic. The assessment values of Hungary and Poland are relatively balanced. Since 2012 Poland has achieved a higher rating than Hungary. Globally we can say that the differences in the V4 countries’ economic performances are being narrowed; the gap between the other V4 countries and the Czech Republic in observed period has become smaller. We realise that the scoring method as a multicriteria method guarantees a certain degree of objectivism, but also it has some pitfalls arising from the subjectivism, which relates to the selection of evaluated indicators, that do not have to reflect the full economic performance and social progress of a country. In further research in this area we want to focus on the countries’ performance assessment being based on a broader range of indicators and on the assessment of dependency between the GDP indicator and the alternative indicators to GDP (HDI, GCI, Index of Prosperity, IEF, but also employment and population income.)
Disclosure statement
No potential conflict of interest was reported by the authors.
Related Research Data
References
- Barro, R. J. (1999). Inequality, growth and investments. NBER Working Paper No.7038, NBER.
- Buckley, P. J., Pass, C. L., & Prescott, K. (1992). “The meaning of competitiveness”, Ch. 2 of Servicing International Markets: Competitive Strategy of Firms, Oxford: Blackwell.
- Chistruga, B., & Crudu, R. (2016). European integration and competitiveness of EU new member states. European Journal of Economics and Business Studies, 6(1), 175–185.10.26417/ejes.v6i1
- Dasgupta, P., & Weale, M. (1992). On measuring the quality of life. World Development, 20(1), 119–131.10.1016/0305-750X(92)90141-H
- Eurostat. (2015). Database. Retrieved from http://ec.europa.eu/eurostat/data/database
- Filippidis, I., & Katrakilidis, C. (2015). Finance, institutions and human development: Evidence from developing countries. Economic Research-Ekonomska Istraživanja, 28(1), 1018–1033.
- Goldsmith, A. (1995). Economic rights and government in developing countries: Cross national evidence on growth and development. Studies in Comparative International Development, 32(2), 29–44.
- Habánik, J., & Hostak, P. (2014). The competitiveness of regional economy and regional development. Economic and social development: 8th international scientific conference on economic and social development and 4th eastern European ESD conference: Building resilient economy. Varazdin: Varazdin development and entrepreneurship agency with University North, Koprivnica, 34–41.
- Hamada, R. (2014). Vybrané spôsoby a metódy merania a hodnotenia regionálnych disparít. Regionální rozvoj mezi teorií a praxí, 3(1), 21–34.
- Hanke, S. H., & Walters, S. J. K. (1997). Economic freedom, prosperity, and equality: A survey. Cato Journal, 17(2), 117–146.
- Ismail, N., & Hook, L. S. (2012). Economic freedom, inequality and growth. Proceedings of USM-AUT International Conference (UAIC) 2012, Bayview Beach Resort, Penang, Malaysia, 683–690.
- Ivanović, V., & Stanišić, N. (2017). Monetary freedom and economic growth in New European Union Member States. Economic Research-Ekonomska Istraživanja, 30(1), 453–463.
- Kelley, A. (1991). The human development index: “Handle with care”. Population and Development Review, 17(2), 315–324.10.2307/1973733
- Kordos, M. (2012). US-EU bilateral trade relations – Transatlantic economic issues. ICEI 2012: Proceedings of the 1st International Conference on European Integration (pp. 131–139). VSB: Ostrava.
- Krugman, P. (1994). Competitiveness: A dangerous obsession. Foreign Affairs, 73(2), 28–44.10.2307/20045917
- Kutscherauer, A., Fachinelli, H., Hučka, M., Skokan, K., Sucháček, J., Tománek, P., & Tuleja, P. (2010). Regionální disparity. Disparity v regionálním rozvoji země – pojetí, teorie, identifikace a hodnocení. Ostrava: VŠB-TU Ostrava.
- Kuznets, S. (1973). Modern economic Growth: Findings and reflections. The American Economic Review, 63(3), 247–258.
- Leschke, M. (2000). Constitutional choice and prosperity: A factor analysis. Constitutional Political Economy, 11(3), 265–279.10.1023/A:1009009007451
- Lucas, R. (1988). On the mechanics of economic development. Journal of Monetary Economics, 22, 3–42.10.1016/0304-3932(88)90168-7
- Lučić, D., Radišić, M., & Dobromirov, D. (2016). Causality between corruption and the level of GDP. Economic Research-Ekonomska Istraživanja, 29(1), 360–379.
- Michálek, A. (2012). Vybrané metódy merania regionálnych disparít. Geografický časopis, 64(3), 219–235.
- Neumannová, A. (2007). Podniková diagnostika. Bratislava: EKONÓM.
- Novak, M., & Pahor, M. (2017). Using a multilevel modelling approach to explain the influence of economic development on the subjective well-being of individuals. Economic Research-Ekonomska Istraživanja, 30(1), 705–720.
- Nurazira S., Dauda, M., Halim Ahmad, A., & Azman-Saini, W. N. W. (2013). Does external debt contribute to Malaysia economic growth? Economic Research-Ekonomska Istraživanja, 26(2), 51–68.
- Paraušić, V., Cvijanović, D., Mihailović, B., & Veljković, K. (2014). Correlation between the state of cluster development and national competitiveness in the Global Competitiveness Report of the World Economic Forum 2012–2013. Economic Research-Ekonomska Istraživanja, 27(1), 662–672.
- Porter, M. (1990). The competitive advantage of nations. London: MacMillan Press.10.1007/978-1-349-11336-1
- Rašić Bakarić, I., Tkalec, M., & Vizek, M. (2016). Constructing a composite coincident indicator for a post-transition country. Economic Research-Ekonomska Istraživanja, 29(1), 434–445.
- Rejnuš, O. (2014). Finanční trhy. Praha: Grada Publishing.
- Schmidt, A. (2016). Friends forever? The role of the Visegrad Group and European integration. Politics in Central Europe, 12(3), 113–140.
- Schumpeter, J. A. (1934). The theory of economic development: An inquiry into profits, capital, credit, interest, and the business cycle ( R. Opie, Trans.). Cambridge, MA: Harvard University. Retrieved from http://www.worldcat.org/title/theory-of-economic-development-an-inquiry-into-profits-capital-credit-interest-and-the-business-cycle/oclc/772145
- Scully, G. W., & Slottje, D. J. (1991). Ranking economic liberty across countries. Public Choice, 69, 121–152.10.1007/BF00123844
- Sen, A. (1988). The concept of development. In H. Chenery & T. N. Srinivasan (Eds.), Hand book of development economics (vol. III, pp. 9–26). Amsterdam: Elseiver Science Publishers.
- Sen, A. K. (1998). Mortality as an indicator of economic success and failure. Economic Journal, 108(446), 1–25.10.1111/ecoj.1998.108.issue-446
- Simionescu, M., Popescu, J., & Firescu, V. (2017). The relationship between gross domestic product and monetary variables in Romania. A Bayesian approach. Economic Research-Ekonomska Istraživanja, 30(1), 464–476.
- Solow, R. M. (1994). Perspectives on growth theory. Journal of Economic Perspectives, 8(1), 45–54. doi:10.1257/jep.8.1.45
- Stiglitz, J., Sen, A., & Fitoussi, P. (2010). Report of the commission on the measurement of economic performance and social progress. Paris. Retrieved from http://www.stiglitz-sen-fitoussi.fr/en/index.htm
- Streeten, P. (1994). Human development: Means and ends. American Economic Review, 84(2), 232–237.
- Svatošová, L., & Novotná, Z. (2012). Regionální disparity a jejich vývoj v ČR v letech 1996–2010. Acta Universitatis Bohemiae Meridionales, The Scientific Journal for Economics, Management and Trade, 15(1), 103–110.
- Synek, M., Kopkáně, H., & Kubálková, M. (2009). Manažerské výpočty a ekonomická analýza. Praha: C.H. Beck.
- The Heritage Foundation. (2015). Index of economic freedom. Retrieved from http://www.heritage.org/index/
- Torstensson, J. (1994). Property rights and economic growth: An empirical study. Kyklos, 47, 231–247.10.1111/kykl.1994.47.issue-2
- Trošt, M., & Bojnec, Š. (2015). Causality between public wage bill, exports and economic growth in Slovenia. Economic Research-Ekonomska Istraživanja, 28(1), 119–131.
- Tuleja, P. (2010). Praktická aplikace metod hodnocení regionálních disparit. Acta Academica Karviniensis, 1(1), 496–509.
- United Nations Development Programme. (2015). Human development report 2014. New York, NY: Author. Retrieved from http://hdr.undp.org/sites/default/files/hdr14-report-en-1.pdf
- Van der Bergh, J. (2009). The GDP paradox. Journal of Economic Psychology, 30(2), 117–135.
- Visegrad Group. (2017). About the Visegrad Group. Retrieved from http://www.visegradgroup.eu/about
- Vojtovic, S., & Krajnakova, E. (2014). Enterprise management in the conditions of economic recession. International Conference: Political Sciences Law, Finance Economics &Tourism (pp. 177–184). Sofia: SGEM.
- World Economic Forum. (2014). The global competitiveness report 2014–2015. Geneva: Retrieved from www.weforum.org/gcrhttp://www3.weforum.org/docs/WEF_GlobalCompetitivenessReport_2014pdf
- Yakunina, R. P., & Bychkov G. A. (2015). Correlation analysis of the components of the human development index across countries. Procedia Economics and Finance, 24, 766–771.10.1016/S2212-5671(15)00692-9
- Yu, J., & Wang, C. (2013). Political risk and economic development: A case study of China. Economic Research-Ekonomska Istraživanja, 26(2), 35–50.
- Zalai, K., Dávid, A., Šnircová, J., Moravčíková, E., & Hurtošová, J. (2010). Finančno-ekonomická analýza podniku. Bratislava: Sprint dva.