
 ?Mathematical formulae have been encoded as MathML and are displayed in this HTML version using MathJax in order to improve their display. Uncheck the box to turn MathJax off. This feature requires Javascript. Click on a formula to zoom.
Abstract
Production processes are becoming increasingly fragmented and dispersed for producers in different geographical areas as a result of international integration and trade liberalisation. The aim of this paper is to estimate direct and indirect import content of Croatian industries and final demand and to compare the results with previous studies for European economies. Direct and indirect import content of final demand is estimated by an input-output model. The updated 2013 input-output table based on the bi-proportional adjustment of the rows and columns of the base technology matrix A (RAS method) is applied in order to account for changes in technical coefficients for domestic output and imports after European Union (EU) accession. The highest import content is estimated for sectors applying production technology that requires raw materials which are not available in sufficient quantities domestically, and sectors that produce high-tech or medium high-tech goods. The import content of public and personal services is low. The highest import content of domestic final demand is recorded for exports and gross fixed capital formation. In comparison to other new member-states, the Croatian economy is less internationally integrated and import dependence is more similar to results found for larger self-sufficient economies. Empirical results on the import content of different economic sectors could enhance the effectiveness of macroeconomic policies.
1. Introduction
The liberalisation of international trade, reduced barriers to capital mobility, lower transportation costs and the development of information and communication technologies are only some of the factors behind a higher internationalisation of production processes over the last few decades. Production processes are becoming increasingly fragmented and dispersed for producers in different geographical areas. Development of global value chains (GVCs) provides numerous economic advantages for both producers and consumers. Some of the positive outcomes of this are specialisation by producers based on competitive advantages, higher productivity and increased consumer surplus stemming from lower prices of final products achieved due to decreases in production costs. An exhaustive survey on internationalisation and development of GVCs as well as the economic implications for producers and consumers is given in IBRD (Citation2017) and by Taglioni and Winkler (Citation2016).
National economies are becoming increasingly integrated and dependent on global economic trends due to the internationalisation of production. International integration enables domestic producers to source intermediate products and capital equipment from the most competitive global suppliers, as well improve efficiency and profitability (Foster, Stehrer, & Timmer, Citation2013).
Besides the many positive effects, increased internationalisation requires designing more complex sets of policy measures to ensure economic growth and external stability (Rifflart & Schweisguth, Citation2013). Traditional monetary and fiscal policy measures in final demand management may be less effective if the international competitiveness of domestic producers lags behind the more successful trading partners and competitors.
Macroeconomic trends in Croatia in the period prior to the economic crisis (2000–2008) confirm that expansionary macroeconomic policy reduces import growth, leads to a deterioration of balance-of-payments deficit and increases external vulnerability if such policies are not coupled with measures oriented towards improving international competitiveness (Orsini, Citation2017). In the pre-crisis period when Croatia’s gross domestic product (GDP) reflected stable economic growth at approximately 4% annually (2000–2008), the share of imports in Croatia’s GDP increased from 32 to 48 percentage points ().
Figure 1. Share of exports and imports in Croatian GDP.
Source: Croatian Bureau of Statistics (www.dzs.hr)
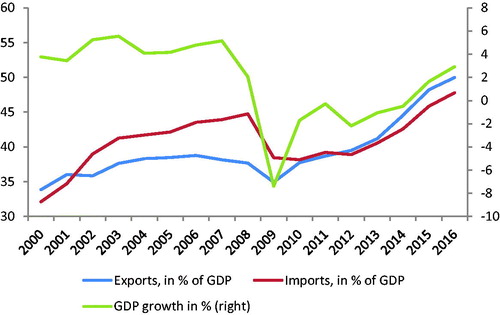
During the economic crisis (2009–2014), Croatia’s sizable trade deficit was corrected as a result of a contraction in domestic final demand. Economic activity reduced cumulatively by 12 percentage points in the period 2009–2014, while the share of imports decreased to 38% of GDP (CBS, Citation2017). Since 2014, economic recovery has been limited, but a revival in domestic demand has led to a growing share of imports. Questions concerning long-term sustainability of the current recovery are debatable, especially considering that during the expansionary phase in the previous period, Croatia’s economic growth model may be viewed as non-productive in the absence of a strong competitive export base (Orsini, Citation2017). The central topic of this paper is to identify the industries and final demand components exhibiting the highest import content and trends that explain the changing pattern of the overall import share in GDP.
The goal of this paper is to quantify the Croatian economy’s dependence on imports for particular economic sectors and components of final demand, as well as categorise total imports into direct and indirect import content. As a small, open economy, Croatia in the period after joining the EU has faced an increasing import content, which leads to the question of the sustainability of the country’s future economic growth. The growth pattern has changed in favour of exports and gross fixed capital formation, while the contribution to economic growth from government consumption is expected to be less pronounced due to on-going reforms necessary for ensuring the sustainability of public-sector finances. Direct and indirect import content of each component of final demand and activity according to the statistical classification of economic activities in the European Community (derived from the French Nomenclature statistique des activités économiques dans la Communauté européenne - NACE) is estimated by applying the input-output (I-O) technique.
The empirical findings of this study were compared with results available for the other European economies. Existing literature on economic internationalisation usually focuses on EU27 economies or the group of new member-states (Amador, Cappariello, & Stehrer, Citation2015; Grodzicki & Geodecki, Citation2016; Ederer & Reschenhofer, Citation2016; Breda, Cappariello, & Zizza, Citation2008), while the Croatian economyFootnote1 is rarely included in the sample (Kersan-Škabić, Citation2017). The results of this study provide additional evidence for the level of international integration of Croatia’s economy and discuss the position of Croatia within the sample of selected NMS (new member-states) economies.
Our hypothesis in this paper is that the Croatian economy is less integrated into international production chains in comparison to similar NMS, primarily due to postponed EU integration. Nonetheless, the Croatian economy exhibits a high import dependence based on certain components crucial for a new growth model, i.e., exports and gross fixed capital formation, which requires further improvements in the general international competitiveness of the domestic economy in order to avoid possible increases in external vulnerability. In terms of policy implications, the results provide an empirical background for a more in-depth analysis of the impact of economic policy measures on domestic economic activity and external trade. According to the experience of other NMS that had joined the EU almost a decade before Croatia, more intensive integration into the European and global market and increased trade openness is expected in the future.
The paper is structured as follows. After an introductory note, the second section provides a short literature review on the features and implications of the internationalisation process as well as the concept of global value chains and analytical methods for assessing the degree an economy is internationally integrated. The third section describes the I-O methodology used in the empirical part of the paper. An economic analysis of the Croatian economy’s import dependence with respect to economic industries and components of final demand is analysed in section four. The last section brings together the main findings of the paper.
2. Literature review
The concept of global value chains (or global supply chains as referred to in some studies) in the economic literature is provided in the studies of Porter (Citation1990) and Krugman (Citation1979). Vertical specialisation of producers and economies included in overall production processes are the result of the innovative development of new products and technological processes that increase speed, scope and the broadness of global interactions (Crespo & Jansen, Citation2014). The main factors underlying greater international cooperation in production processes are changes in demand patterns, development of transport and communication infrastructure, liberalisation of trade and capital flows, foreign direct investments (FDI) and development of offshoring-outsourcing strategies by international companies (WTO & IDE-Jetro, Citation2011). Baldwin and Venables (Citation2013) use the term ‘sliced and diced’ to describe fragmentation of global production. The internationalisation of production is a challenging task for policy-makers given that the process affects domestic prices and exchange-rate policies, affects macroeconomic stability, and transfers global economic shocks more quickly onto domestic economic activity and employment (Rifflart & Schweisguth, Citation2013). Traditional economic policies stemming from demand management may very well be ineffective if import dependence is not accounted for properly (Orsini, Citation2017).
In economic literature, the import content of domestic demand is usually estimated using two different approaches, specifically, estimation of trade in value added based on international I-O tables from the Organisation for Economic Co-operation and Development/World Trade Organization (OECD/WTO) and the traditional approach based on national I-O tables. The OECD/WTO approach is elaborated in detail in the original OECD-WTO (Citation2012). It is based on the I-O approach but involves an additional level of complexity and includes trade in intermediates between economies. Tracing inter-economy trade requires constructing an international input-output table. Both imports and exports are reallocated to the international relation of each economy with respect to trade in intermediate inputs and final products. The advantage of the trade in value added (TiVA) concept developed by the OECD/WTO is its ability to quantify the domestic and foreign value added in exports and the final domestic demand of each economy and to account for the effects of international trade between all economies. However, construction of the international input-output table involves resolving numerous practical issues such as treating confidential trade data, the number of homogenous production sectors, treatment of re-export, trade in used second-hand goods, separation of intermediate and final use and so on (OECD-WTO, Citation2012). The properties of national data sources and statistical methods used to convert national tables to the OECD/WTO concept may affect the reliability of estimates for an economyFootnote2, although generally, the model produces reliable and comparable indicators. The main methodological difference is the exclusion of re-exports from total exports included in the national I-O tables.
The second approach in estimating import content of final demand and industries is the traditional I-O methodology (as described in Miller and Blair, Citation2009 or Leontief, Citation1986) based on national I-O data. The advantage of estimates based on national input-output tables is its direct relation to original official statistical sources, whereas international tables are the compiles using specific techniques in order to harmonise data on different economies in line with a common framework and periods (WTO & IDE-Jetro, Citation2011). The main disadvantage of relying only on national I-O tables is the inability to account for economic trends in trade partners, which can influence domestic activity.Footnote3 The disadvantage of both approaches relates to the availability of national I-O tables, which are generally available only in five-year intervals. The import dependence of exports and the overall national economy is a dynamic category (European Central Bank, Citation2005), particularly in medium and higher-technology sectors, thus performing input-output analysis at times is too static in comprehending such trends in an economy.
Most studies conclude that a high share of import content is not generally perceived as a weakness, but rather as an indicator of the level at which domestic producers have achieved international integration in global value-added chains (Amador, Cappariello, & Stehrer, Citation2015; Grodzicki & Geodecki, Citation2016). However, improving the international competitiveness of domestic producers is the key prerequisite to ensuring an external stability in an environment of trade liberalisation and growing international integration (Ederer & Reschenhofer, Citation2016; Breda, Cappariello, & Zizza, Citation2008). It is important to separate imports directly (without any transformation of a domestic producer) used by domestic final consumers from imports of intermediate goods incorporated in the final product produced by a domestic unit. While imports of final products usually relates more to weak competitiveness of domestic producers, imports of intermediate goods may indicate a higher level of international integration of domestic producers. Based on OECD/WTO data on domestic and foreign value added, Leitner and Stehrer (Citation2014) concluded that developed EU economies with a higher level of participation in GVCs exhibit better macroeconomic performance. Export growth and the degree of vertical specialisation have a positive relation. Grodzicki and Geodecki (Citation2016) explained the core-periphery model in Europe and concluded that participation in GVCs speeds up the process of deindustrialisation. Croatia is not included in the sample of research which covers the period prior to the country’s accession to the EU.
Bussiere, Callegari, Ghironi, Sestieri, and Yamano (Citation2013) found that small countries, in general, have a higher share of imported intermediates in domestic gross output. Higher demand for imported intermediate inputs should not be considered a clear signal of the inefficiency of a national industry, but rather a sign of deeper integration into international trade patterns (Altomonte, Barattieri, & Rungi, Citation2008). Breda, Cappariello and Zizza (Citation2008) found that the import content of exports for several EU countries grew between 1995 and 2000 as a result of the internationalisation of production processes. They identified the transport sector as the most internationalised sector. Feenstra and Hanson (Citation1996) identified long-term growth in the import content of exports over the last 30 years and estimated that the share of imported inputs in total intermediate inputs in the USA grew from 5.5% in 1972 to 11.6% in 1990. Hummels, Ishii, and Yi (Citation2001) and Chen, Kondratowicz, and Yi (Citation2005) also noticed an upward trend in a set of OECD countries.
Egger and Egger (Citation2003) considered import content of domestic production to be a clear indicator of international outsourcing, given that it is one of the ways that enterprises internationalise their own production processes. Import dependence is usually analysed to identify two kinds of economic linkages between productive sectors, i.e., backward and forward linkages. Changes in these linkages identify possible structural changes in the economy (Guo & Planting, Citation2000; Amaral, Lopes, & Dias, Citation2011). The pioneers of linkage formulations are Rasmussen (Citation1957) and Hirschman (Citation1958). For an economic sector, backward linkages are directed towards domestic and foreign suppliers of intermediate inputs. On the other hand, forward linkages describe the importance of a sector in its capacity as a supplier of intermediate inputs for other domestic or foreign producers. Sectors which have most intense backward and forward linkages are generally assumed to be the most ‘important’ for a national economy. The internationalisation process affects backward and forward linkages in that they are more dispersed not only in regards to domestic, but also foreign, companies. The estimation of import elasticity on domestic income and prices is important for numerous policy areas, such as the exchange rate to optimal taxation policy, and has been broadly explored in the literature (Malley & Moutos, Citation2002; Feenstra & Hanson, Citation1996; Broda & Weinstein, Citation2006). These parameters are usually estimated in line with econometric models and recent reviews of methodological aspects and empirical results for a set of economies are presented in Ghodsi, Grübler, and Stehrer (Citation2016). Import elasticity in relation to GDP growth, estimated by the input-output approach, is usually found () to be higher than 1 (Ezzahid & Chatri, Citation2015). Some authors found that service-based economies have biased import dependence coefficients in input-output tables, caused by high tourist demand (Bravo & Alvarez, Citation2012).
3. Methodology
The input-output table is a static presentation of the structural relationship between domestic production sectors in a national economy. I-O analysis, developed by Leontief, is a quantitative model which introduces the assumption of stability of technical coefficients and applies matrix algebra in estimating total direct and indirect requirements for intermediate inputs determined by a given level of output (Ten Raa, Citation2005; Miller & Blair, Citation2009, D'Hernoncourt, Cordier, & Hadley, Citation2011).
In modern globalised economies, as a consequence of trade liberalisation, strong competition and technological improvements, production processes are becoming increasingly complex and internationalised. I-O analysis incorporating exchange of goods and services with foreign economies is used to identify supply chains at domestic and international levels. Basic assumptions, procedures, techniques and application of the input-output analysis are described in more detail in Ten Raa (Citation2005) and Miller and Blair (Citation2009), whereas the use of I-O analysis in estimating the import content of final demand and output of individual activities is described below.
In the input-output table, the entire economy is divided into n sectors producing goods and services and final users. In a descriptive example of the I-O table, rows show revenues (output) of a certain sector while columns show costs (inputs). The crucial identity in the I-O model is that the total output of a certain sector is equal to the sum of the intermediate inputs (including non-deductible taxes on products paid on intermediate inputs) and gross value added. Revenues from output sold to other sectors can be separated into products delivered for intermediate use by other industries and the final demand:
(1)
(1)
where xi– output of sector i; xij – output of sector i delivered to sector j to be used as intermediate input in the production of sector j. The output of sector i is equal to deliveries to other production sectors and final users.
Total final demand is defined as the sum of personal consumption (C), government consumption (G), gross capital formation (I) and exports (E). Subscript i denotes the production sector i that delivers the final product, while the superscript indicates the origin of the product (D means goods delivered by a domestic producer, while M stands for imported product); each component of final demand is the sum of demand for domestic products (e.g., CD=∑ ); direct import of final goods and services (e.g., CM) and taxes on products (e.g., Ctind where subscript tind stands for taxes on goods and services). Total personal consumption could be presented by the following equation: C = CD+CM+ Ctind.
An I-O table can be separated into three segments. The first and the most important part presents the intermediate inputs (xij), the second segment presents the value-added structure, and the third presents the structure of final uses as explained above.
The most important assumption in an I-O analysis is the existence of constant input-output or technical coefficients which describe inter-sectoral connections. Input-output coefficients for domestic (aijD) and import content (ajU) represent the share of intermediate inputs in the total value of outputs for a certain sector:
(2)
(2)
(3)
(3)
This set of equations is derived from the central input-output model based on the assumption on fixed technical coefficients (Soklis, Citation2009). If a matrix AD is defined as a matrix where elements in row i and column j are technical coefficients for domestic inputs (aijD), then AD * x is the direct requirements for domestic intermediates required to produce output at the given level (x). If a vector yD is defined as the exogenous aggregate of final demand for domestic products (which is the sum of personal consumption, government consumption, investments and exports: yD = CD + GD + ID+ ED), then the total output in a national economy is presented as the sum of production delivered to other production sectors and final demand:
(4)
(4)
After a few mathematical operations (as described in Miller & Blair, Citation2009), the expression can be further transformed to:
(5)
(5)
The matrix (I - AD) is usually called the Leontief matrix for domestic products (Miller & Blair, Citation2009). The diagonal of this matrix represents the net output of each sector with positive coefficients (revenues), while the rest of the matrix gives input requirements (inter-sectoral deliveries of inputs) with negative coefficients (costs). The Leontief inverse for domestic production (I - AD)−1 reflects both direct and indirect requirements for domestic intermediates. The sum of the elements in matrix (I - AD)−1 in column j is defined as an output multiplier for sector j, i.e., the total amount of production in the economy required per unit of output produced by sector j. The higher the share of domestic intermediate inputs, the more significant is the indirect effect of final demand on domestic output (higher multiplier), and vice versa.
The use of imported products in a national economy represents an outflow of funds from a domestic economy to foreign countries, which reduces the direct and indirect effects of growth in domestic demand on gross value added and employment.
The direct import dependence of a certain sector j (ajU as defined above) represents the value of imported intermediate goods and services directly used by sector j to produce a unit value of output. The indirect import dependence of a sector j is related to the imported goods and services not directly used in the production process of sector j, but comprises intermediate inputs used by other domestic sectors which deliver intermediate goods and services to sector j.
In matrix form, the direct import content of production sectors is expressed using input-output coefficients (presented by vector u containing elements ajU as defined before). Total import content in the production of a certain sector j is determined by multiplying vector uT with the total domestic output of all sectors required for the delivery of goods and services to final users. Total (direct and indirect) imports per unit value of output is given by:
(6)
(6)
The expression is a vector (with dimension 1 x n), where the jth element presents direct and indirect requirements for import per unit of production of sector j. If the jth element of total import requirements (from the expression
) is divided by direct import content per unit of output of the sector j (ajU), the result is an import multiplier for sector j. The ratio of total and direct import content in production of a sector j is defined as an import multiplier. The import multiplier is interpreted as the total imports of intermediate goods and services in the overall value-added chain of a certain sector j per unit of direct import of sector j. Different sectors have various shares of import content in their production and various structures of direct and indirect import dependence based on applied technologies.
Total import in monetary termsFootnote4, which is required by domestic producers in the production of goods and services demanded by final users (U), is calculated by multiplying import requirements per unit of output with the total demand for domestic products:
(7)
(7)
The input-output methodology is also convenient for calculating import content of individual components of final demand, where yD is substituted with the appropriate sub-component CD, GD, ID or ED as defined above.
Besides the impact on imported intermediate inputs incorporated into domestic products, total imports induced by domestic demand also include the value of imported final imported products directly used in consumption without any transformation (CM, GM, IM and EM which are directly observable from an I-O table). Final demand directly satisfied by imported products (e.g., household expenditures for imported cars or computers) does not affect domestic activity.
The official I-O table for the Croatian economy is available for 2010. In the short run, the assumption on stability of technical coefficients aijD is probably not violated (because technology is not rapidly changing), but in the medium or long run, connections between domestic sectors may change due to technological improvements, trends in relative prices or changes in the institutional environment. The shorter distance between the periods described in the I-O table and reference year for estimates of variables of interest leads to improved reliability of the I-O model. Given that the stagnation of investment activities in the recession period limited the potential for technological changes in Croatia, full EU membership in 2013 led to changes in the institutional environment which may potentially affect input-output coefficients due to changing trends in international trade. The official I-O figures representing production connections between domestic and international producers in the new environment for the Croatian economy, according to the schedule by the Croatian Bureau of Statistics, will be available by the end of 2018 (for reference year 2015). Instead of the official input-output table for 2010, this research was based on the updated table for the reference year 2013. Modification leading towards a method that focuses relatively more on the most recent data might very well improve the reliability of the results, especially in the case of an economy that has undergone a significant institutional change, such as the process of EU accession. The two most frequently used techniques for updating I-O tables are RAS and Minimum Cross Entropy (CE). The RAS method, as a bi-proportional iterative method or reconciliation of supply and demand, was first used by Stone (1961). This method (Eurostat, Citation2008) utilises data describing the connections between industries from the most recently available official table and makes adjustments to ensure that sums of deliveries and costs reflect the structure of total uses and inputs in more recent periods. Golan, Judge, and Robinson (Citation1994) use a cross entropy formulation to estimate the coefficients in the I-O table by identifying a new set of coefficients, thus minimising the entropy distance between the officially available old and the new estimated coefficients by setting and solving the Lagrangian model and adhering to certain constraints. Both approaches poses advantages and weakness, but existing literature is inconclusive as to the superiority of any one approach (McDougall, Citation1999). The bi-proportional RAS method is used in this study in line with the methodology proposed by Miller and Blair (Citation2009).
4. Results
4.1. Import content of Croatian industries
Based on the updated input-output table for 2013, the direct, indirect and total import content of domestic production of 64 Croatian production sectors are presented in tabular form in the Appendix.
Production sectors with the highest level of direct import content in output ( in the Appendix) can be grouped into the following:
Table 1. Direct, indirect and total import content of final demand by components.
Sectors applying production technology that requires raw materials, and which are not available in sufficient quantities domestically (e.g., coke and oil, and other products related to mining and quarrying). These sectors use a significant proportion of the so-called non-competitive imports;
Domestic sectors that produce high-tech or medium high-tech goods. These producers are more integrated into the international value-added chains, and due to product complexity and implementation of the international quality standards for final products and components, a high proportion of parts are imported and incorporated into their output (e.g., motor vehicles, computers, electric and electronic products);
Sectors that use intermediate products which are produced domestically, but the share of imports is high due to better quality or lower prices offered on the global market (competitive imports). Sectors with a high share of competitive imports incorporated in their output are involved in the production of rubber products, textiles, clothes and the chemical industry.
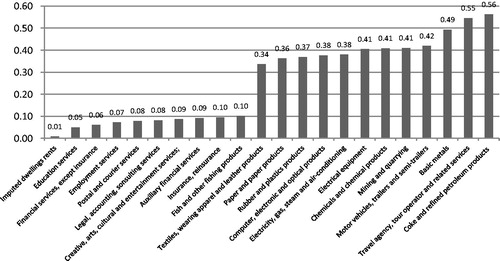
Import content is generally higher for sectors which produce goods (agriculture, mining and the manufacturing industry) and lower for services. The most dependent sectors are: the production of refined petroleum products where direct and indirect imports reach 56.2% of output value ( in Appendix); the production of basic metals (49.3%); and the production of motor vehicles (41.9%). High import content in these sectors may indicate more complex production processes requiring heterogeneous intermediate domestic and imported inputs, or more intense integration in global value chains. Among services, only those activities of travel agencies and organisers recorded a significant share of imported intermediates related to tourist arrangements provided by international hotels and transport companies.
Non-market services for proprietary consumption by households in the form of imputed dwelling rents and activities of private households do not use any imported intermediates directly ( in Appendix). However, even these sectors use imported goods and services indirectly in the form of imports incorporated into intermediate products delivered by other domestic producers. For sectors without direct imports, the import multiplier cannot be calculated and does not have any economic significance.
Besides domestic services and dwelling rents, a low share of direct import in output was recorded in various service industries such as education, financial services, insurance, legal and other business services and in the collection and distribution of water. These sectors are labour intensive and generally record a low share of both domestic and imported intermediates in the output. Forestry and fishing are also included in the group of industries with the lowest share of import content, primarily due to the availability of high-quality and competitive domestic production. The Croatian forestry and wood industry is one of the sectors with the highest level of international competitiveness (Lovrinčević, Buturac, & Mikulić, Citation2015).
Indirect import content relates to the imports of intermediate goods and services in the entire value-added chain of a producing unit. Indirect import content is high for transport and electricity, and is primarily due to their dependence on oil derivatives produced from imported crude oil. Indirect import content is also high in certain manufacturing sectors, such as the food and tobacco industry, the production of paper products, publishing activities and the production of mineral products. Service sectors use relatively simple production processes based on labour and use a limited proportion of import products both directly and indirectly.
Total import content (including direct and indirect imports) of output is the highest for the production of oil derivatives, travel agencies and metal production, where the share of imports is more than 50% of the gross output value. In the case of production of oil derivatives, total import dependence relates primarily to the direct use of non-competitive imports. Travel agencies and metal producers are sectors that have both significant direct and indirect import requirements (see ).
Figure 2. Production sectors in Croatia with the highest and lowest total import dependence in 2013, share in sector output.
Source: Authors’ calculations
The import multiplier for intermediate products is defined as the ratio between total and direct imports per unit value of output for each of the sectors. A high multiplier is not simply the result of high import dependence in a certain sector, but can also be due to a low share of direct imports (a low denominator). The import multiplier is not defined for imputed dwelling rents and activities of private households, given that these sectors do not use imported products directly, i.e., the denominator is equal to zero.
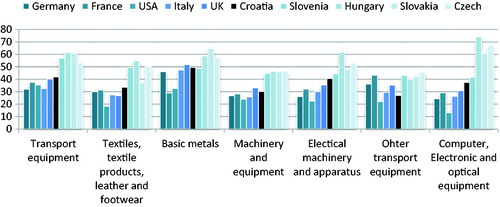
If the results of import content by industry are compared to the results of other economies, the conclusion is that Croatian producers are less integrated internationally, especially in relation to the most important manufacturing sectors. presents the position of the Croatian economy in comparison to the import content of seven selected industries most integrated into the GVC (according to TIVA/OECD). In general, Croatia recorded lower import content in comparison to similar NMS economies (e.g., Slovenia, Hungary, Slovakia and the Czech RepublicFootnote5), whereas the import content is only marginally greater than in highly developed large economies. A lower level of import content to a great extent is the result of postponed EU integration and lack of foreign direct investment (FDI) inflow into export-oriented sectors. Foreign investment in the production of transport equipment, computer and electronic products and other machinery and equipment provided a positive impulse for other NMS for the broad restructuring of the manufacturing industry and improvement of overall export competitiveness (Cieślik, Biegańska, & Środa-Murawska, Citation2016). According to the Croatian National Bank’s database (https://www.hnb.hr/en/statistics/statistical-data/rest-of-the-world/foreign-direct-investments), total FDI attracted in Croatia in the period 1994–2017 amounted to 6.2 billion euros, of which more than 70% was invested in three sectors: trade; financial services and head-office operations; and management-consultancy activities. Foreign investments in sectors with a higher level of international integration were practically absent.
Figure 3. Comparison of the import content of most internationally integrated sectors, import share in sector output.
Source: TiVA Database Online. Available from: http://stats.oecd.org/Index.aspx/DataSetCode=TIVA2015_C1; authors’ calculations for Croatia
From the standpoint of a small economy such as Croatia, lower international integration may pose a significant obstacle for further development due to limited domestic demand and a lower potential of creating domestic value-added. The concept of a U-shaped value-added curve was introduced in economic literature (Linden, Kraemer, & Dedrick, Citation2009; Baldwin & Evenett, Citation2015) to explain differences in the creation of value-added alongside the value-added chain. Most value-added is usually found in upstream activities such as research and development, design or production of key components, or in downstream activities such as marketing or customer services. The final assembly of standardised products leads to low value-added and is often offshored to emerging economies with lower labour costs. Unlike large economies which can perform the final, capital-intensive stages of production or generate high value-added in relation to services delivered to domestic customers, small economies such as Croatia should move downwards in the GVC to a stronger position as a supplier of more advanced products on the international market.
4.2. Import content of final demand components in Croatia
As described in the methodological section of the paper, the value of final demand for each of the components (C, I, G and E) expressed in market prices can be divided into:
Expenditures on goods and services produced by domestic units valued at basic prices,
Expenditures on imported goods and services valued at basic prices, and
Taxes on products minus subsidies on products.
A direct import for final demand is comprised of expenditures of domestic sectors on imported final products which are consumed without any transformation and is directly observable from the I-O table. Given that import content is incorporated in domestic output, changes in final demand affect not only direct imports, but also indirectly imports of intermediate inputs. The share of domestic and imported components included in each category of final demand varies due to the structural difference in expenditures. Import content of final demand, estimated by the equations given in the previous chapter, is presented in as a share of imports in total expenditures and valued at market prices.
The results of the input-output model show that import dependence is highest for gross capital formation and where imported goods and services account for more than 40% of total domestic demand. Import dependence of investment is high both for direct imports (final machinery and equipment bought from abroad), and indirect imports related to inputs incorporated in investment goods produced domestically. Increase in domestic investments contributes to domestic value-added by less than 60% of the total value of investment.
The import content of exports of goods and services is higher in comparison to personal or government consumption. In the future period, a more intense integration of Croatian producers in the global value chains is expected to take place which may result in an even higher import content of exports. Operations by multinational companies, and which are present to a certain degree in the Croatian market, are based on the optimisation of production processes through the vertical and horizontal integration of producers situated at different locations and based on traditional and comparative advantages of integrated companies. Products exchanged on global markets in the recent period include parts and inputs produced in many different countries: the concept of a national product is less dominant compared to the situation only a few decades ago. In the total value of goods and services exported from the Croatian economy, a growing share relates to activities by domestic companies in the ownership of foreign units. These companies in many cases organise production processes in Croatia such that most of the important inputs are delivered to domestic producers from different countries depending on the situation in global markets. Therefore, Croatian producers which are part of multinational companies are involved only in a limited segment of the global value chain; in the economic sense, they are more intensely integrated with other units in a multinational company than with other domestic producers. An example of this type of international value-added chain present in Croatia is the production of leather products, metal products and pharmaceutical products which all recorded a growing share in Croatian exports. The results presented in point to the conclusion that Croatia is lagging behind other NMS regarding the level of international integration. More intense integration is expected in the next period.
Direct import content in the final expenditures of households in Croatia is estimated at approximately 15%, while total import content of personal consumption is 26% of expenditures valued at market prices. The most important factor behind the relatively low level of import content of personal consumption is a high share of expenditures for products from the non-tradable sector, such as personal and communal services. Additionally, trade and distribution margins on imported final products are also treated as domestic value-added in national accounts. Expenditures on imported goods paid by final consumers include the basic value of an imported product, trade and transport margins by domestic distributors and net taxes on products. The basic value of imported final products (direct import content) is only part of the total expenditure for the same product valued at market prices.
The lowest import content is recorded for government consumption. Final expenditures by the government mainly relate to public services, such as police and defence forces, education and healthcare provided by non-market producers (hospitals, schools and so on controlled by the government). Direct import dependence of the government sector relates primarily to imported drugs and other medical supplies paid for by the government and delivered to household sectors as social transfers in kind under the scheme of obligatory health insurance. Indirect import dependence of the government sector relates to imported intermediate inputs acquired by domestic producers included in the value-added chain of government units.
presents a comparison of import content of final demand in Croatia with results for other economies based on the same methodological framework.
Table 2. Import content in final demand of selected economies.
Croatia, as a small open economy, is generally expected to record a higher import content of final demand in comparison to larger economies included in Bravo and Alvarez (Citation2012). However, results point to the conclusion that there is no significant difference between Croatia and larger economies regarding total import content of final demand. Direct import content (foreign final goods and services consumed directly by the final user) is the highest for all components in Croatia, while indirect import is generally lower. Though a higher share of direct import content is a sign of poor competitiveness by domestic producers of final goods, the lower indirect import content indicates a lack of international integration even in comparison to large economies.
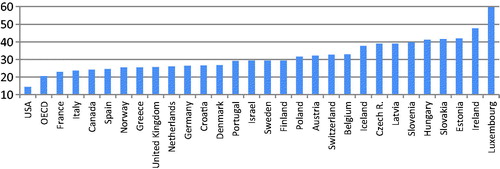
The results for other NMS are available only from the TIVA/OECD database on foreign share of value-added in total final demand (defined as a sum of personal and government consumption and gross fixed investments). Contrary to the general perception of high import dependence of domestic final demand, Croatia is an economy that records the lowest share of import content in final demand among NMS (). Unfortunately, the TIVA/OECD database does not differentiate between the direct and indirect share of total import content, but the expectation is that the position of Croatia is primarily due to lower indirect import content related to the import of intermediate inputs.
Figure 4. Comparison of the import content of domestic final demand.
Source: OECD-TiVA (2017), Trade in value-added, TiVA. Available at: http://stats.oecd.org/Index.aspx/DataSetCode=TIVA_2016_C2 (1.10.2017); authors’ calculations for Croatia.
5. Conclusions
This paper has contributed to scarce literature on imports in relation to Croatian final demand and the economic sectors providing empirical estimates based on the updated 2013 input-output table. As a small, open economy, Croatia is dependent on imports of intermediate inputs and final goods and services. Trade liberalisation and integration of the Croatian economy into global and European associations additionally promotes international cooperation and trade openness. Production processes are becoming more fragmented and integrated in global value-added chains and final products incorporate inputs delivered by many domestic and foreign companies. According to the results of the I-O model, in comparison to previous studies which included NMS economies (Kersan-Škabić, Citation2017), Croatia is less integrated into global value chains. Factors behind this less pronounced international integration of domestic producers are the sectoral structure of the economy along with a higher share of non-tradable sectors and lack of export-oriented FDI inflow. Contrary to the more successful NMS, with economies completely restructured by FDI invested in highly integrated global business (Cieślik, Biegańska, and Środa-Murawska, Citation2016), most foreign investments in Croatia are directed into financial institutions, hotels and restaurants, telecommunications and other service sectors which are more oriented to the domestic market.
Despite the general perception of a significant import dependence of Croatian final demand, the results indicate a lower import content of final demand in comparison to similar EU economies and are more similar to larger self-sufficient economies such as Germany, Spain, France or Italy (Bravo & Alvarez, Citation2012). A lower level of international integration of Croatia’s economy in comparison to similar small economies limits the potential for long-term economic growth. With respect to larger economies which can achieve high value-added through specialisation in the final stages of GVC based on strong domestic demand, small economies should endeavour to restructure their economies towards more productive stages and achieve higher TIVA in the middle sections of the GVC. This strongly supports the argument that there is plenty of opportunity for further liberalisation, internationalisation and globalisation in the economy, but also the proposition that the economy is operating below the potential national production frontier.
In terms of policy implications, international integration of production processes requires the development of more sophisticated measures in order to ensure sustainable economic growth and avoid external vulnerability. Economic growth in the future period will be based primarily on the expansion of exports and gross fixed capital formation which are components of final demand with the highest share of import content. Besides hotels and restaurants which benefit from growing foreign tourist expenditures, other personal and public services face stagnant final demand due to government expenditure reforms and limited growth in household income. Although expected increases in international integration provides many positive economic outcomes, a change in the structure of final demand will result in higher import dependence. Successful industrial transformation should be supported by carefully devised industrial policy to ensure export growth based on efficient absorption of EU funds, more pronounced international integration and higher efficiency based on application of modern technologies. The results support previous findings based on a different methodological approach (Orsini, Citation2017), concluding that Croatia’s external stability is likely to be maintained under the condition that investments are redirected from inward-oriented services to tradable sectors, thus improving international competitiveness and export growth.
Disclosure statement
No potential conflict of interest was reported by the authors.
Notes
1 Croatia joined the EU in 2013.
2 Individual input-output tables can apply different price concepts (basic as opposed to purchasing prices), various methods of transforming supply and uses of data in input-output tables (product based as opposed to industry based), while international input-output tables are devised based on conversion to a uniform concept and methodology. The OECD in the international input-output table uses benchmark data from the previous period and extrapolate it to other periods (e.g., all Croatian data are based on the 2004 I-O table).
3 In the traditional I-O model, exports from an economy are assumed to be an exogenous component. In reality, economic trends in trade partners affect demand and in turn affect exports and economic activity in the exporting economy.
4 For example, in millions of HRK.
5 These countries were selected from the group of NMS economies for comparison due to the similarity in size of their economies, geographical position and institutional environment. However, the conclusion as to the worst position taken up by Croatia in relation to international integration would not be changed had other NMS been included in the comparison (TIVA/OECD database).
Related Research Data
References
- Amador, J., Cappariello, R., & Stehrer, R. (2015). Global value chains: a view from the euro area. ECB Working Paper, 1761, 1–24.
- Altomonte, C., Barattieri, A., & Rungi, A. (2008). Import penetration, intermediate inputs and productivity: evidence from Italian firms. Rivista Italiana Degli Economisti, 1/2014, 45–66. doi: 10.1427/76114
- Amaral, J. F., Lopes, J. C., & Dias, J. (2011). External dependency, value added generation and structural change: and inter-industry approach. Notas Económicas, 33, 6–19.
- Baldwin, R., & Venables, A. J. (2013). Spiders and snakes: Offshoring and agglomeration in the global economy. Journal of International Economics, 90(2), 245–254.
- Baldwin, R. E., & Evenett, S. J. (2015). Value Creation and Trade in 21st Century Manufacturing. Journal of Regional Science, 55(1), 31–50.
- Bussiere, M., Callegari, G., Ghironi, F., Sestieri, G., & Yamano, N. (2013). Estimating trade elasticities: Demand composition and the trade collapse of 2008-2009. American Economic Journal: Macroeconomics, 5(3), 118–151. doi: 10.1257/mac.5.3.118
- Bravo, A. C., & Alvarez, M. T. (2012). The import content of the Industrial sectors in Spain, Economic Bulletin, 81(2012), Banco de Espana.
- Breda, E., Cappariello, R., & Zizza, R. (2008). Vertical specialization in Europe: Evidence from the import content of exports, Working Papers, 682, Banca d'Italia.
- Broda, C., & Weinstein, D. E. (2006). Globalization and the Gains from Variety. Quarterly Journal of Economics, 121(2), 541–585.
- Chen, H., Kondratowicz, M., & Yi, K. M. (2005). Vertical specialization and three facts about U.S. international trade. The North American Journal of Economics and Finance, 16(1), 35–59. doi:10.1016/j.najef.2004.12.004
- Cieślik, E., Biegańska, J., & Środa-Murawska, S. (2016). Evaluation of Trends in Foreign Trade Development in the Post-Communist Countries of Europe in the Years 2000–2012 Following their Accession to the EU. Quaestiones Geographicae, 34(4), 12–22. https://doi.org/10.1515/quageo-2016-0033
- Crespo, A., & Jansen, M. (2014). The Role of Global Value Chains during the Crisis: Evidence from Spanish and European Firms. Fedea, 9, 1–49.
- D’Hernoncourt, J., Cordier, M., & Hadley, D. (2011). Input-output multipliers specification sheet and supporting material. Spicoza Project Report, Université Libre de Bruxelles – CEESE, 1–25.
- Ederer, S., & Reschenhofer, P. (2016). Growth Patterns and Trade Imbalances in the EMU. A Global Value Chain Analysis. WIFO Working Papers, 2016(509), 28.
- Egger, H., & Egger, P. (2003). On market concentration and international outsourcing. Applied Economics Quarterly, 49, 49–64.
- European Central Bank. (2005). Competitiveness and the export performance of the euro area, by a Task Force of the Monetary Policy committee of the European System of Central Banks, Occasional Paper, 30, Monthly Bulletin.
- Eurostat (2008). Eurostat manual of supply, use and input-output tables. Luxembourg: Eurostat.
- Ezzahid, E., & Chatri, A. (2015). Imports contents, value added generation and structural change in Marocco: Input output analysis, MPRA Paper, 63512.
- Feenstra, R. C., & Hanson, G. H. (1996). Globalization, outsourcing and wage inequality. AEA Papers and Proceedings, 86, 240–245.
- Foster, N., Stehrer, R., & Timmer, M. (2013). International fragmentation of production, trade and growth: Impacts and prospects for EU member states, European Economy - Economic Papers 2008 – 2015, 484, Directorate General Economic and Financial Affairs (DG ECFIN), European Commission.
- Ghodsi, M., Grübler, J., & Stehrer, R. (2016), Import Demand Elasticities Revisited, wiiw Working Paper, 132. https://wiiw.ac.at/import-demand-elasticities-revisited-p-4075.html.
- Golan, A., Judge, G., & Robinson, S. (1994). Recovering Information from Incomplete or Partial Multisectoral Economic Data. The Review of Economics and Statistics, 76(3), 541–549. doi: 10.2307/2109978
- Grodzicki, M. J., & Geodecki, T. (2016). New Dimensions of Core- Periphery Relations in and Economically Integrated Europe: The Role of Global Value Chains. Eastern European Economics, 54(5), 377–404. doi: 10.1080/00128775.2016.1201426.
- Guo, J., & Planting, M. A. (2000). Using Input-Output Analysis to Measure U.S: Economic Structural Change Over a 24 Year Period. Bureau of Economic Analysis, 1, 1–23.
- Hirschman, A. (1958). The Strategy of Economic Development, New Haven, Yale University.
- Hummels, D., Ishii, J., & Yi, K. (2001). The nature and growth of vertical specialization in world trade. Journal of International Economics, 54(1), 75–96. doi: 10.1016/S0022-1996(00)00093-3
- IBRD (2017), Measuring and Analyzing the Impact of GVCs on Economic Development. https://www.wto.org/english/res_e/booksp_e/gvcs_report_2017.pdf
- Kersan-Škabić, I. (2017). Trade in Value Added (TiVA) in EU New Member States (EU NMS). Croatian Economic Survey, 19(2), 105–133. doi:10.15179/ces.19.2.4
- Krugman, P. R. (1979). Increasing returns, monopolistic competition, and international trade. Journal of International Economics, 9 (4), 469–479.
- Leitner, S. M., & Stehrer, R. (2014). Trade Integration, Production Fragmentation and Performance in Europe – Blessing or Curse? A Comparative Analysis of the New Member States and the EU-15. WIIW Research Report, 397, 1–38.
- Leontief, W. (1986). Input-Output Economics. New York: Oxford University Press
- Linden, G., Kraemer, K. L., & Dedrick, J. (2009). Who captures value in a global innovation network? The case of Apple’s iPod”. Communications of the ACM, 52(3), 140–144.
- Lovrinčević, Ž., Buturac, G., & Mikulić, D. (2015). Export performance of the Croatian wood industry and its contribution to the overall Croatian economy. Forest Products Journal, 65(3-4), 159–165. doi: 10.13073/FPJ-D-14-00063
- Malley, J., & Moutos, T. (2002). Vertical product differentiation and the import demand function: theory and evidence. Canadian Journal of Economics/Revue Canadienne d`Economique, 35(2), 257–281.
- McDougall, R. A. (1999). Entropy theory and RAS are friends. GTAP Working Paper, Center for Global Trade Analysis, Purdue University, 6, 1–20.
- Miller, E. R., & Blair, D. P. (2009). Input-Output Analysis: Foundations and Extensions. 2nd ed., Cambridge: Cambridge University Press. doi: 10.1017/CBO9780511626982
- OECD-WTO (2012). Trade in Value - Added: Concepts, Methodologies and Challenges (Joint OECD-WTO Note). The Organization of Economic Cooperation and Development and the World Trade Organization. http://www.oecd.org/sti/ind/49894138.pdf.
- Orsini, K. (2017). What drives Croatia's high import dependence? Economic Brief, 29, 1–20, Brussels. https://ec.europa.eu/info/sites/info/files/eb029_en.pdf
- Porter, M. E. (1990). The Competitive Advantage of Nations. New York: Free Press.
- Rasmussen, P. N. (1957). Studies in inter-sectoral relations, Amsterdam: North-Holland.
- Rifflart, C., & Schweisguth, G. (2013). Report on new measures of international trade, in European Framework for Measuring Progress, e- Frame. http://citeseerx.ist.psu.edu/viewdoc/download/doi=10.1.1.370.9884&rep=rep1&type=pdf.
- Soklis, G. (2009). The Conversion of the Supply and Use Tables to Symmetric Input-Output Tables: A Critical Review. Bulletin of Political Economy, 3(1), 51–70.
- Taglioni, D., & Winkler, D. (2016). Making Global Value Chains Work for Development. Washington: The World Bank Group.
- Ten Raa, T. (2005). The Economics of Input-Output Analysis. Cambridge: Cambridge University Press. doi: 10.1017/CBO9780511610783
- WTO & IDE-JETRO (2011). Trade Patterns and Global Value Chains in East Asia: from trade in goods to trade in tasks, World trade organisation/The Institute of Developing Economies https://www.wto.org/english/res_e/booksp_e/stat_tradepat_globvalchains_e.pdf
Appendix A
Table A1. Import dependence of Croatian production sectors.