
 ?Mathematical formulae have been encoded as MathML and are displayed in this HTML version using MathJax in order to improve their display. Uncheck the box to turn MathJax off. This feature requires Javascript. Click on a formula to zoom.
Abstract
Information and Communication Technology (ICT) has a significant role in the growth and development of almost every national economy. The aim of this paper is to estimate the overall contribution of final expenditures on ICT goods and services on the domestic output and imports of Croatia in terms of gross value added (GVA) and employment. In order to quantify the direct, indirect and induced effects of final expenditures on ICT goods and services to the overall Croatian economy, input-output (IO) analysis is applied. The results of the empirical analysis show that of all three categories of total final uses, the final consumption expenditure on ICT goods and services recorded the highest total contribution in terms of GVA and in terms of employment. The final consumption expenditure of households had the most important role in generating GVA and employment, while the impact of government and non-profit organisations serving households expenditures was limited. At the activity section level, the majority of GVA and the number of jobs were generated in the activity section J – Information and Communication. The total number of employees induced by final expenditures on goods and services produced by the ICT sectors is estimated at 2.8%. The ICT sectors contributed to the total Croatian GVA in a range higher than 4.5%.
SUBJECT CLASSIFICATION CODES:
1. Introduction
The role of Information and Communication Technology (ICT) in economic development is broadly explored in the economic literature. ICT is a driving force of economic growth and sustainable development of modern economies (Pohjola, Citation2002), and it is the key factor in competitiveness, productivity and innovation, both at the national and international economic level (Dewan & Kraemer, Citation2000; Popova, Popov & Dalin, Citation2005; Dedrick, Kraemer & Shih, Citation2013). Through its impact on productivity, ICT contributes to the strengthening of the national economy (OECD, Citation2004). Moreover, ICT enables the creation of new and more effective models which induce growth and economic development at the global level.
Through the transfer and usage of all kinds of information, from small to large firms, ICT connects all the productive sectors of a national economy by increasing their efficiency. At the firm level, intensive use of and investments in ICT accelerate productivity growth (Bloom, Sadun & Van Reenen, Citation2012), which leads to output growth (Brynjolfsson & Hitt, Citation2003). Both ICT and R&D investments are strongly related to productivity and innovation (OECD, Citation2004; Hall, Lotti & Mairesse, Citation2013; Statistics Netherlands, Citation2015, Chapter 7).
By providing the tools and infrastructure necessary to create and transfer new knowledge, ICT enables innovation in productive sectors and fosters their growth and development. A rapid expansion of information, corporate networking, connection between firms and customers, and increased communication efficiency are just some of the innovative ICT activities. According to Vu (Citation2011), ICT also affects economic growth and development by encouraging the transfer of knowledge from the developed to developing countries.
However, despite the opportunities that ICT offers, the strategy of economic growth and development without the key elements such as political stability, human capital, firm infrastructure, cooperation between political decision-makers, contractors and citizens involved in social activities and the synergy between the mentioned elements, progress is not possible.
Cardona, Kretschmer & Strobel (Citation2013) and Draca, Sadun & Van Reenen (Citation2007) provided an overview of the empirical literature dealing with ICT and productivity, as well as the methodological approaches for estimating the impact of ICT. Authors found that in most research, the productivity effect of ICT is positive and significant, and that a methodological approach is very important to adequately estimate the effects of ICT.
The most common approach of a quantitative macroeconomic analysis that quantifies the direct, indirect and induced effects of a particular sector to the national economy, and which studies the interdependence between the productive sectors of the national economy is the input-output (IO) analysis. Despite the numerous analytical capabilities that the IO analysis provides, the number of empirical studies quantifying and analysing the effects of ICT sectors on the growth and development of the Croatian economy is relatively modest.
In Keček, Žajdela Hrustek & Dušak (Citation2016) the multiplier effect analysis of ICT sectors is limited to a simple multiplier calculation for ICT sectors, i.e., to the calculation of relative indicators describing the total output in a national economy required to deliver one unit of ICT output. In this paper, the effects of final expenditures on ICT goods and services on the total economy in the absolute terms of GVA and employment are examined for the Croatian economy for the first time. The contribution of this paper is the empirical analysis of the direct, indirect and induced effects of final expenditures on ICT goods and services on the Croatian economy.
The remainder of this paper is organised as follows: after the introduction, a literature review on the indirect and induced effects of ICT sectors on the national economy is presented; section 3 describes the research methodology, section 4 describes the data sources, while sections 5 and 6 present the empirical results of the overall contribution of final expenditures on ICT goods and services and the impact of ICT sectors on the economic activities in Croatia; finally, in the conclusion, remarks and recommendations for further research are provided.
2. Literature review
Detailed overview of the relevant research, discussed in this section, highlights that only a limited number of international and domestic articles empirically explored the economic impact of ICT on the national economy by using IO analysis. The most common approaches in the analysis of the importance of ICT sectors in the overall national economy are usually limited to the multiplier type I and multiplier type II1 calculations and the decomposition analysis. Analysing the role of ICT sectors in the national economy was mainly performed for Asian countries and some of the European countries.
According to the results of the output multipliers and the decomposition analysis for several European countries, Rohman (Citation2013) concluded that the multiplier effects of the ICT sectors on other sectors were lower in the period 2000–2005 compared to the period 1995–2000, while the decrease in the ICT sector production was a result of the loss of export advantages and technological changes. The aim of the research conducted by Di Carlo and Santarelli (Citation2010) was to estimate the impact of the ICT sector on the Italian economy. The results of the output multiplier calculation for 1995, 2000 and 2005 lead to the conclusion that the Italian ICT sector had a more significant multiplier effect on the production system than the non-ICT sector, which classified the ICT sector as the key sector for economic growth and development of the Italian economy.
In order to differentiate the role of the ICT sector from the viewpoint of the developed and developing countries, Irawan (Citation2014) conducted a comparative analysis for Indonesia, Singapore, Malaysia and Thailand based on the IO tables for the year 2005. The results of the analysis showed the significance of the total size, but also the composition of the ICT sector for the economic performance of national economies. Authors concluded that more developed countries will not always benefit more from the ICT development than the less developed countries. Toh & Thangavelu (Citation2013) emphasised that the development and use of ICT are the key drivers in the transformation from a traditional to a knowledge based economy. Authors explored the influence of ICT on production growth in Singapore within the concept of intersectoral linkages captured by the IO model. The results of the analysis indicate that the ICT sector is the key link for the expansion of manufacturing and electronics exports in Singapore.
The IO methodology for the Croatian economy was used for the first time, to analyse the multiplier effects of ICT sectors, in Keček, Žajdela Hrustek & Dušak (Citation2016). A comparison between the strength of backward linkages in two different periods was made based on the IO tables for the Croatian economy for the years 2004 and 2010. Simple output multipliers and value added multipliers were calculated for the ICT and non-ICT activities for both years. The results of the conducted analysis indicated that there was no significant difference between the simple output multipliers and value added multipliers in the ICT sectors and other productive sectors of the Croatian economy. Moreover, significant changes in the values of simple output multipliers and value added multipliers for ICT sectors in 2004 and 2010 were not observed. Simple output multipliers and value added multipliers of ICT sectors were also calculated for the group of long-standing and new European Union member states. Based on the multiplier analysis, authors concluded that the long-standing European Union member states better utilised the potential of the ICT sectors for the purpose of economic growth and development.
While Keček, Žajdela Hrustek & Dušak (Citation2016) concentrated only on multipliers as relative indicators of the integration of ICT sectors into the national economy, in this paper the impact of final expenditures on ICT products on domestic output and imports is analysed in terms of the most important economic indicators of the success and competitiveness of the national economy, i.e., in terms of GVA and employment. In order to quantify the total effects of final expenditures on ICT goods and services on the Croatian economy, the IO analysis is applied. As a main data source, symmetric IO tables for domestic production and imports for the year 2010 are used.
3. Research methodology
IO is a practical method of the quantitative macroeconomic analysis for the analysis of the economic structure and growth and the development of a national economy. The IO analysis, as a powerful analytical tool, is mainly used to calculate the direct, indirect and induced effects of a certain productive sector on the overall national economy in order to determine its significance and to examine the interdependence between the sector of interest and all other sectors of the national economy. The statistical information base of the IO analysis is the IO table in which the production system of an economy is decomposed to a certain number of productive sectors showing the flows of goods and services between them (ten Raa, Citation2005; Miller & Blair, Citation2009). The main equations describing the flows between productive sectors in the IO model are:
(1)
(1)
where
is a sector’s
total output,
is the output from sector
which is used as an intermediate input by sector
, and
is the final demand for products in sector
. Technical coefficient
(2)
(2)
is defined as the ratio of the product from sector
that is required by sector
in order to produce one unit of its product. The system of Equationequations (1)
(1)
(1) in the matrix form can be written as:
(3)
(3)
where
is the column vector of outputs,
the column vector of final demands and
is the square
-by-
matrix of technical coefficients, called the technology matrix. The solution to the system (3), where
is the
-by-
identity matrix, is:
(4)
(4)
More details about the conditions for the matrices and
can be seen in Peterson & Olinick (Citation1982). The matrix
is known as the multiplier matrix or the Leontief inverse matrix. The elements of the matrix
, represented as
, represent the total direct and indirect output of sector
per one unit of final demand in sector
.
The total effect of each productive sector on the national economy is defined as the sum of direct, indirect and induced effects of the observed sector. To quantify the direct, indirect and induced effects of each productive sector on the overall economy, the IO model is used. There are two types of the IO model, the open and closed IO model. In the open IO model, final consumption is considered to be an exogenous variable. The open IO model is used to quantify the direct and indirect effects. The indicators that determine those effects are called multipliers type I, and for their calculation the Leontief inverse matrix is used.
In the closed IO model, some components of final consumption, mainly households, are considered to be endogenous variables. Apart from the quantification of direct and indirect effects, the closed IO model enables the quantification of induced effects. The indicators that, besides direct and indirect effects, involve induced effects, are called multipliers type II. In the closed IO model, the technology matrix is expanded in matrix
with one more row and one more column. The additional row represents the compensation of employee coefficients and the additional column represents the household consumption coefficients. The matrix
, the square
-by-
matrix, except the direct and indirect effects, also indicate the induced effects which are the results of the production to satisfy the additional household consumption induced by an increase in the income. Namely, the household sector spends the earned income on final goods and services. The growth in the demand for the final goods and services of the household sector induces growth of household consumption, which induces growth of the production of all sectors involved in the production chain of the goods and services intended for final consumption of households. This effect of production growth related to the additional demand financed by increased wages and salaries is called the induced effect. When interest is on the calculation of direct, indirect and induced effects for the original n sectors, the square
-by-
matrix
is used (McLennan, Citation2006; Miller & Blair, Citation2009; Burrows & Botha, Citation2013). The elements
of the matrix
show the direct, indirect and induced effects on the increase in the sector’s
production as a result of the unit growth of the final demand by sector
. According to Grady & Muller (Citation1988) and Miller & Blair (Citation2009), multipliers type I underestimate the economic effects because households are not included in the effects calculation, while multipliers type II overestimate the economic effects because of the strict assumptions about labour incomes and attendant consumer spending. The real effect is generally located in the middle of the interval where the multiplier type I is lower and the multiplier type II is upper bound (Oosterhaven, Gerrit & Stelder, 1986).
Once the total effect on domestic production is evaluated according to Equationequation (4)(4)
(4) , it is also possible to estimate the total effects of a certain sector in terms of GVA and employment.
The value added coefficient represents the value added of sector
(
) per unit of its output (
). If the column vector of the value added coefficients is noted as
then in order to evaluate the total effects of final expenditure in terms of GVA, it is necessary to multiply
with the total domestic output induced by final demand. Therefore, the total effects of final expenditure in terms of GVA in the open IO model can be, in the matrix form, expressed as:
(5)
(5)
while the total effects of final expenditure in terms of GVA in the closed IO model can be expressed as:
(6)
(6)
The employment coefficient represents the ratio of the number of employed persons (
) in the sector’s
output (
), and the column vector
contains those employment coefficients. To provide the total effects of final expenditure in terms of employment, it is necessary to multiply
with the total domestic output induced by the final demand. Thus, in the open IO model, the total effects of final expenditure in terms of employment can be expressed as:
(7)
(7)
and in the closed IO model as:
(8)
(8)
It is important to emphasise that the column vector of the final demand , included in the calculation of the direct, indirect and induced effects of final consumption expenditures on ICT goods and services, contains the inputs only for ICT products, while the inputs for other products are set to zero.
Similarly as for GVA and employment, the import content of the final demand can in the open IO model be expressed as:
(9)
(9)
and in the closed IO model as:
(10)
(10)
where the import coefficients
of the column vector
are defined as a share of imports (
) in the sector’s
output (
).
Import content includes the imports of the final ICT products contained in the final demand, here marked as , and the imports directly and indirectly connected to the domestic ICT producers.
4. Data sources
The main data source for analysing the impact of final expenditures on ICT products on the domestic economy and imports was the Croatian symmetric IO table for the domestic production and imports for the year 2010 (Croatian Bureau of Statistics, Citation2017), where the entire Croatian economy is separated into 64 mutually exclusive productive sectors. The data of the number of employees are downloaded from the Eurostat National accounts employment data by industry (nama_10_a64_e) (Eurostat, Citation2017).
The total final uses of each productive sector are decomposed on three main components: final consumption expenditure, gross capital formation and total exports. The final consumption expenditure includes the following components: final consumption expenditure of households (HOUSEHOLDS), final consumption expenditure by non-profit organisations serving households (NPISH) and final consumption expenditure by the government (GOVERNMENT).
The definition for the identification of ICT economic activities (industries) according to the OECD (Citation2011, p. 59) is as follows: ‘The production (goods and services) of a candidate industry must primarily be intended to fulfil or enable the function of information processing and communication by electronic means, including transmission and display’. The International Standard Industrial Classification of All Economic Activities, ISIC Rev. 4 (United Nations, Citation2008) identifies ICT economic activities and arranges them into three main groups: ICT manufacturing industries, ICT trade industries and ICT services industries. According to the 2007 National Classification of Activities, the productive sector that complies with
the ICT manufacturing industry is
sector code C26 - Computer, electronic and optical products2
the ICT trade industry is
sector code G46 - Wholesale trade services, except for motor vehicles and motorcycles
the ICT services industries are
sector code J58 - Publishing services
sector code J61 - Telecommunications services
sector code J62_J63 - Computer programming, consultancy and related services, information services
sector code S95 – Repair services of computers and personal and household goods.
The sector codes G46, J58 and S95 do not exclusively produce ICT goods and services.3 Therefore, for these sectors a part of final expenditures and imports for ICT goods and services has been extracted according to the secondary source Eurostat Structural Business Statistics (Citation2017).
presents the structure of the domestic and import final expenditures on ICT goods and services by ICT sectors. The final consumption expenditure (which consists of HOUSEHOLDS, NPISH and GOVERNMENT) has a dominant share of 46% in total final uses. The final consumption expenditure is the most expressive in the sector code J61 and makes 58% of the total final consumption expenditure on ICT. The least expressive final consumption expenditure has the sector code S95 with only 2.4% of the total final consumption ICT expenditure. Gross capital formation is the most important component of final expenditures in the sector code J62_J63, where the expenditures of the domestic ICT goods and services (87%) prevail, followed by the sector code C26, where the imported ICT goods and services (96.4%) are dominant. Total exports dominate in the sector codes C26 and J61, with around 85% and 62% share of the imported ICT goods and services in total expenditures, respectively.
Table 1. Structure of final expenditures on ICT goods and services by sectors, in millions of HRK.
5. Empirical results of the overall contribution of final expenditures on ICT goods and services to the national economy
This section presents the estimates of the total contribution of final expenditures on ICT products on the domestic economic activity and imports in terms of GVA and employment. In order to quantify the total contribution of final expenditures on ICT products, the methodology and data sources described in the previous section are applied.
presents total contribution, as well as the decomposition of total contribution on the direct, indirect and induced effects of final expenditures on ICT products in terms of the Croatian GVA. It should be noted that in terms of GVA, total effects are equal to the sum of the direct effects (determined by ICT producers), indirect effects (determined by all domestic units directly or indirectly included in the value added chain of ICT producers) and induced effects (related to the household consumption achieved by employees in the entire value added chain of ICT sectors).
Figure 1. Total contribution of final expenditures on ICT goods and services in terms of the Croatian GVA, in millions of HRK.
Source: Authors’ calculation.
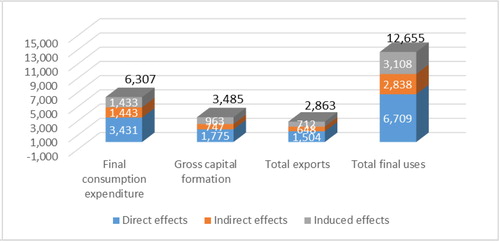
The direct, indirect and induced effects of total final uses, as well as of each component of the total final uses in terms of the Croatian GVA are calculated according to the formulas (5) and (6) and detailed explanations about this calculation that are given in the appendix.
Of all three categories of total final uses, final consumption expenditures on ICT products noted the highest total contribution in terms of GVA, approximately one-half of the total final uses contribution. The final consumption expenditure of ICT sectors induced approximately 6.3 billion of HRK in terms of GVA, of which approximately 3.4 billion of HRK was generated directly in terms of GVA, while approximately 1.4 billion of HRK was generated via indirect effects and was induced by household consumption. It can also be observed that in terms of GVA, direct effects generated by gross capital formation are almost equal to the sum of indirect and induced effects in terms of GVA generated by gross capital formation. Furthermore, it can be noted that induced effects are slightly higher than indirect effects. The same conclusion may also be adopted for total effects in terms of GVA generated by total exports.
The GVA multiplier type II, apart from the direct and indirect GVA changes, includes both the induced effects, i.e., it includes the GVA resulting from the producers who supply goods and services to meet additional household consumption induced by the growth of economic activity. It can be noted that the GVA multiplier type II for total final uses is approximately 1.9, which means that if the demand for ICT products increases for 1 HRK, GVA in the total economy will increase by 1.9 HRK. According to the categories of total final uses, the lower GVA multiplier type II of approximately 1.8 is detected for final consumption expenditures, while gross capital formation has the largest GVA multiplier type II of approximately 2, which can be explained on the basis of a higher share of equipment, where there are some stronger links between domestic producers. When interpreting the multiplier type II, it is necessary to keep in mind that the multiplier type II could overestimate economic effects as explained in section 3.
According to the formulas (7) and (8) and a similar explanation as in the calculation of direct, indirect and induced effects on GVA in the appendix, the total contribution of final expenditures on ICT products in terms of employment and its decomposition on direct, indirect and induced effects are calculated and shown in .
Figure 2. Total contribution of final expenditures on ICT goods and services in terms of employment, in the number of jobs.
Source: Authors’ calculation.
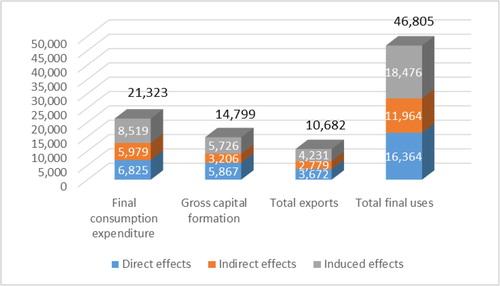
In 2010, direct, indirect and induced effects of the total final uses of goods and services produced by ICT sectors were approximately 46,800 jobs (). In order to satisfy the final demand for ICT products, direct suppliers need to engage approximately 16,400 employees. Almost 12,000 jobs are indirectly created in the supply chain, i.e., in the firms which deliver intermediate inputs to ICT producers, and additional 18,500 jobs are induced by the household demand financed by an increase in wages and salaries related to ICT sectors. In terms of employment, induced effects were relatively higher than indirect effects in all three categories of the total final uses of ICT sectors. The indirect and induced effects of the final consumption expenditure of ICT sectors were approximately 14,500 jobs, while the indirect and induced effects of total exports were approximately half the amount, 7,000 jobs. The gross capital formation of ICT sectors generated approximately one-third of the total number of jobs induced by final expenditures on ICT products.
The employment multiplier type II is defined as the ratio between the total employment growth, which includes the direct, indirect and induced effects of the changes in the final demand, and the ratio of the number of employees and the output of each of the productive sectors reflecting only the direct needs for the labour factor production. The employment multiplier type II is even bigger than the GVA multiplier type II and, for total final uses, it amounts to approximately 2.9. This means that if the demand for ICT products increases and the ICT producer who delivers goods and services directly to the final user hires one employee, the total number of employees in the whole economy will increase by 2.9 persons. Such an amount of the employment multiplier type II that is higher than the GVA multiplier type II can be explained through higher productivity in the ICT sectors. Because of the higher productivity, the ICT sectors do not need a significant number of employees per unit of output, but induce 2.9 times employment in the overall value added chain. Suppliers of intermediate goods and services used in ICT sectors, as well as the producers who produce for household consumption, are less productive and need a larger number of employees per unit of output.
According to the formulas (9) and (10) and a similar explanation as in the calculation of direct, indirect and induced effects in terms of GVA in the appendix, the direct, indirect and induced effects of import content are calculated and shown in .
Figure 3. Import content of ICT sectors, in millions of HRK.
Source: Authors’ calculation
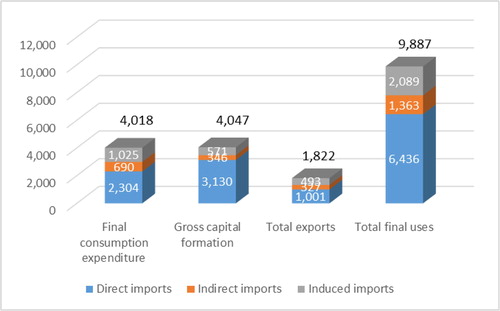
In all three categories of total final uses, the ICT directly consumed by final users is relatively higher than the indirect effects. Total final uses induced approximately 10 billion of HRK in imports Approximately 6.4 billion of HRK in imports was directly consumed by final users, while approximately 3.4 billion of HRK was achieved in imports by ICT producers and their suppliers. The final consumption expenditure and gross capital formation related to the goods and services produced by ICT sectors induced approximately the same value of 4 billion of HRK in imports, while the total export of ICT sectors involved around 18% of the total imports. A relatively high import dependence of ICT exports is to be noted. To export approximately 3.5 billion of HRK in ICT goods and services (), exporters need to induce a total import of 1.8 billion HRK, which is more than 50% of export value. This is a result of a weak connection between the domestic ICT exporters and other domestic producers.
By analysing the total contribution of final consumption expenditures on ICT products in terms of GVA and employment solely, it can be noted that HOUSEHOLDS have the most important role in generating GVA and the number of jobs.
Related to the total effects of each of the components of final consumption expenditures on ICT goods and services, it may be noted that HOUSEHOLDS generated most of the total GVA, almost 97%. GOVERNMENT generated 3% of the total GVA, while the share of GVA generated by NPISH is negligible ().
Table 2. Total effects of the components of final consumption expenditures on ICT goods and services in terms of the Croatian GVA, in millions of HRK.
Similar conclusions can also be made about the importance of each component of final consumption expenditure in terms of employment (). HOUSEHOLDS generated the majority of total jobs, more that 95%, GOVERNMENT almost 5%, while NPISH generated only 11 jobs in the total number of jobs generated by the final consumption expenditure.
Table 3. Total effects of the components of final consumption expenditures on ICT goods and services in terms of employment, in the number of jobs.
6. Empirical results of the impact of ICT sectors on economic activities
In order to present the results of the conducted IO analysis as more readable, 64 productive sectors of the national economy are often, according to the National Classification of Activities – NCA 2007, aggregated in 11 levels, as presented in .
Table 4. Definition of the NCA 2007 activity sections.
Approximately 58% of the total GVA induced by final expenditures on ICT products is related to the activity section J (). The goods and services included in the information and communication industry generated 7.28 billion out of 12.65 billion HRK of the total GVA induced by final expenditures on ICT products. Most of the 7.28 billion HRK generated by the activity section J creates direct effects (84%). Besides the activity section J, the most intensive impact of final expenditures on ICT products is recorded for the activity sections B,C,D,E and the activity sections G,H, where indirect effects prevail in all the components of total final uses.
Table 5. Total GVA induced by final expenditures on ICT goods and services, in thousands of HRK.
In relative terms ( in the appendix), almost 54% of GVA generated in the activity section J is induced by final expenditures on goods and services produced by ICT sectors, out of which around 27% is generated by final consumption expenditure, around 15% by the gross capital formation and around 12% by total exports. Final expenditures on ICT products induced only a limited share of GVA in the activity section F and activity sections O,P,Q.
Table 7. Percentage of GVA induced by final expenditures on goods and services produced by ICT sectors, in %.
Besides the direct effects of producers, the development of the ICT sectors results in strong indirect and induced effects, and consequently all domestic producers benefit from the growth of final demand.
and in the appendix present the contribution of final expenditures on the goods and services produced by ICT sectors in terms of induced employment.
Table 6. Total employment induced by final expenditures on the goods and services produced by ICT sectors, in the number of jobs.
Table 8. Percentage of total employment induced by final expenditures on goods and services produced by ICT sectors, in %.
It may be noted that in the year 2010, more than 46,000 jobs in Croatia, or in relative terms ( in the appendix) 2.76% of jobs, are induced by final expenditures on the goods and services produced by ICT sectors.
In the activity section J, almost 17,000 jobs (or approximately 31% of jobs) in Croatia were generated by the final demand for ICT products. Except in the activity section J, the largest number of people who were employed due to the final expenditures on ICT goods and services was noted in the activity sections G,H (more than 8,000 jobs, or 2.28% of jobs) and the activity sections B,C,D,E (around 7,000 jobs, or 2.25% of jobs). The smallest number of people employed was noted in the activity section F, activity section L and activity section K.
7. Conclusion
In modern and globalized society, the effects of ICT are crucial for continuous economic growth and development of almost every national economy. ICT enables greater production efficiency in ICT sectors, but it also enables productivity growth in all other productive sectors and throughout the entire economy. This research analyses the effects of final expenditures on ICT goods and services on Croatia’s domestic economy and imports by using the IO methodology. An analysis of direct, indirect and induced effects of each component of total final uses on ICT products on domestic economic activities and imports in terms of GVA and employment was performed.
The multiplier effects of final consumption expenditures on ICT goods and services, including the induced effects on Croatian GVA and employment are significant, and amount to approximately 1.9 for GVA and 2.9 for employment. An increase in the final demand for ICT goods and services creates almost double value of GVA in the overall economy, while the impact on employment is even higher. However, a high share of imported ICT goods and services of approximately 40% of total final uses limits the potential for the spill-over of the multiplier effects onto the domestic economy. Development of the domestic ICT sectors could significantly improve productivity of the overall economy. Each directly employed person in ICT sectors induces three additional jobs in the overall economy and therefore helps in reducing unemployment.
Based on the literature review, as well as results presented in this paper, it may be noted that in comparison with the developed European Union member states, Croatia is lagging behind in the adoption of modern technologies. Consequently, high import dependence is evident, particularly in the ICT manufacturing industry (i.e., in the sector code C26 – Computer, electronic and optical products), where more than 90% of total final uses are satisfied by imported ICT goods. On the other hand, according to Keček, Žajdela Hrustek & Dušak (Citation2016), for most European Union member states, the multiplier effects are the greatest for the sector code C26 – Computer, electronic and optical products, where Croatia shows the largest gap and the highest import dependence. The ICT services industries are slightly better positioned, especially the sector code J61 – Telecommunications services. The income elasticity of ICT products is usually found to be higher than one and an increase of the share of ICT goods and services in the final demand is expected in the future period. Strengthening of Croatian ICT producers through more intensive inclusion in domestic and global value chains could provide an additional stimulus toward a sustainable development of the Croatian economy.
Guidelines for future research should move towards the comparison of data and trends for several years, which at this time is not possible, since the latest available IO table for Croatia is for the year 2010. A more recent IO table could also be used in the decomposition of the impact of various final demands for ICT goods in a longer period. For future research, it is also recommended to apply a described methodology to analyse the effects of final expenditures on ICT goods and services of other European Union economies. A comparative analysis of the total contribution of final expenditures on ICT products of the European Union member states would enable an overview of the impact of the ICT sectors and a widespread understanding of the importance of the ICT sectors not only at the national, but also at the international level.
Notes
1 Multiplier type I is defined as the ratio of total effects (direct and indirect effects) and direct effects. Multiplier type II is defined as the ratio of total effects (direct, indirect and induced effects) and direct effects. Multipliers type I and type II are in more detail explained in section 3.
2 The following industries of ISIC Rev. 4 at group level are grouped into the ICT manufacturing industry: 261 - Manufacture of electronic components and boards, 262 - Manufacture of computers and peripheral equipment, 263 - Manufacture of communication equipment, 264 - Manufacture of consumer electronics and 268 - Manufacture of magnetic and optical media.
3 Due to the protection of data confidentiality, the disaggregation of C26 activity at a group level in Croatia for 2010 is not complete. The recent SBS surveys show that the share of ICT manufacturing industries in the total C26 activity is about 80%. For this reason, in the empirical analysis using the IO table for 2010, the whole C26 activity is used.
References
- Bloom, N., Sadun, R., & Van Reenen, J. (2012). Americans Do IT Better: US Multinationals and the Productivity Miracle. American Economic Review, 102(1), 167–201. doi:10.1257/aer.102.1.167
- Brynjolfsson, E., & Hitt, L. M. (2003). Computing Productivity: Firm-Level Evidence. Review of Economics and Statistics, 85(4), 793–808. doi:10.1162/003465303772815736
- Burrows, L. R., & Botha, A. P. (2013). Explaining the changing input-output multipliers in South African: 1980-2010. In: Biennial Conference of the Economic Society of South Africa, Bloemfontein, South Africa.
- Cardona, M., Kretschmer, T., & Strobel, T. (2013). ICT and Productivity: Conclusions from the Empirical Literature. Information Economics and Policy, 25(3), 109–125.
- Dedrick, J., Kraemer, K. L., & Shih, E. (2013). Information Technology and Productivity in Developed and Developing Countries. Journal of Management Information Systems, 30(1), 97–122. doi:10.2753/MIS0742-1222300103
- Dewan, S., & Kraemer, K. L. (2000). Information Technology and Productivity: Evidence from Country-Level Data. Management Science, 46(4), 548–562. doi:10.1287/mnsc.46.4.548.12057
- Draca, M., Sadun, R., & Van Reenen, J. (2007). Productivity and ICT: A Review of the Evidence. The Oxford Handbook of Information and Communication Technologies. Oxfort:Oxford University Press, 100–147.
- Croatian Bureau of Statistics. (2017). Input-output table for 2010 supply and use tables for 2010. Available at: www.dzs.hr [Accessed on August 1, 2017].
- Di Carlo, C., & Santarelli, E. (2010). Contribution of ICT to economic growth in Italy: Input Output analysis. Italy: Ministry of Economic Development. Department of Communications.
- Eurostat. (2017). Eurostat National accounts employment data by industry. Available at: http://ec.europa.eu/eurostat/data/database [Accessed on August 1, 2017].
- Eurostat Structural Business Statistics. (2017). Structural Business Statistics Data. Available at: http://ec.europa.eu/eurostat/web/structural-business-statistics [Accessed on August 1, 2017].
- Grady, P., & Muller, R. A. (1988). On the use and misuse of input-output based impact analysis in evaluation. The Canadian Journal of Program Evaluation, 3(2), 49–61.
- Hall, B. H., Lotti, F., & Mairesse, J. (2013). Evidence on the impact of R&D and ICT investments on innovation and productivity in Italian firms. Economics of Innovation and New Technology, 22(3), 300–328.
- Irawan, T. (2014). ICT and economic development: Comparing ASEAN member states. International Economics and Economic Policy, 11(1-2), 97–114. doi:10.1007/s10368-013-0248-5
- Keček, D., Žajdela Hrustek, N., & Dušak, V. (2016). Analysis of multiplier effects of ICT sectors-a Croatian Case. Croatian Operational Research Review, 7(1), 129–145. doi:10.17535/crorr.2016.0009
- McLennan, W. (2006). Information paper: Australian national accounts: Introduction to input-output multipliers. No. 5246.0, Australian Bureau of Statistics.
- Miller, R. E., & Blair, P. D. (2009). Input-Output Analysis: Foundations and Extensions. New York: Cambridge University Press.
- OECD (2004). The Economic Impact of ICT: Measurement, Evidence and Implications, OECD, Paris. Retrieved from http://www.oecd-ilibrary.org/economics/the-economic-impact-of-ict_9789264026780-en [CrossRef]
- OECD (2011). OECD Guide to Measuring the Information Society 2011. OECD Publishing. Retrieved from http://www.oecd.org/sti/ieconomy/oecdguidetomeasuringtheinformationsociety2011.htm [CrossRef]
- Oosterhaven, J., Gerrit, P., & Stelder, D. (1986). Theory and Practice of Updating Regional versus Interregional Interindustry Tables. Papers of the. Papers in Regional Science, 59(1), 57–72. doi:10.1111/j.1435-5597.1986.tb00982.x
- Peterson, B., & Olinick, M. (1982). Leontief Models, Markov Chains, Substochastic Matrices, and Positive Solutions of Matrix Equations. Mathematical Modelling, 3(3), 221–239. doi:10.1016/0270-0255(82)90027-6
- Pohjola, M. (2002). The New Economy in Growth and Development. Oxford Review of Economic Policy, 18(3), 380–396. doi:10.1093/oxrep/18.3.380
- Popova, I., Popov, O., & Dalin, R. (2005). ICT knowledge 4 ICT diffusion. Information and Communication Technologies and the Knowledge Economy, 2, 792–799.
- Rohman, I. K. (2013). The globalization and stagnation of the ICT sectors in European countries: An input-output analysis. Telecommunications Policy, 37(4-5), 387–399. doi:10.1016/j.telpol.2012.05.001
- Statistics Netherlands (2015). ICT and economic growth, Statistics Netherlands. Retrieved from https://www.cbs.nl/en-gb/publication/2015/24/ict-and-economic-growth [CrossRef]
- ten Raa, (2005). T. The Economics of Input-Output Analysis. Cambridge: Cambridge University Press.
- Toh, M. H., & Thangavelu, S. M. (2013). An input-output study of the Singapore information sector. Economic Systems Research, 25(2), 233–244. doi:10.1080/09535314.2012.740616
- United Nations (2008). International standard industrial classification of all economic activities. Statistical papers, Series M No. 4/Rev.4, Revision 4, Department of Economic and Social Affairs, New York.
- Vu, K. M. (2011). ICT as a source of economic growth in the information age: Empirical evidence from the 1996-2005 period. Telecommunications Policy, 35(4), 357–372. doi:10.1016/j.telpol.2011.02.008
Appendix
Appendix: Calculation of the direct, indirect and induced effects of each component of total final uses
Total final demand (Y) could be decomposed in the final demand for a different component of the final demand: final consumption expenditures (Y_F) , gross capital formation (Y_I) and total exports (Y_E) . Each of those categories is described as a vector with positive elements for the sectors which deliver ICT goods and services to final users and 0 for other sectors. Equations for the estimates of direct, indirect and induced effects in the continuation of this appendix are presented for the component final consumption expenditures. The calculation of direct, indirect and induced effects for other components of total final uses is identical as presented for the component final consumption expenditure, except the column vector of the exogenous final demand is different, i.e., it is inherent to a particular component of total final uses (Y_I or Y_E). In the calculation of the direct, indirect and induced effects of total final uses, the column vector of the exogenous final demand of total final uses is equal to the sum of the column vectors of the exogenous final demand of final consumption expenditures, gross capital formation and total exports, i.e., Y = Y_F + Y_I + Y_E.
1. Direct effects
If the column vector of the exogenous final demand of final consumption expenditures on ICT products is noted as , where
for non-ICT sectors and a certain value of the final demand for the production of ICT sectors, then the direct effect of final consumption expenditures on the Croatian economy is equal to the sum:
(AP1)
(AP1)
where
represents a row vector of 1’s (of an appropriate dimension, here 64).
If the column vector of value added coefficients is noted as then the direct effects in terms of GVA present the sum of the value added coefficients per sector multiplied by the output of ICT sectors which is delivered to the final users:
(AP2)
(AP2)
If the column vector of employment coefficients is noted as then the direct effects in terms of employment present the sum of the employment coefficients per sector multiplied by the output of ICT sectors which is delivered to the final users:
(AP3)
(AP3)
2. Effects in an open I-O model
The open IO model includes the effects on units which directly deliver ICT goods or services to the final user, and the indirect effects on producers included in the value added chain of ICT producers.
Direct and indirect effects on the output of domestic producers
The output of domestic producers included in the value added chain of ICT sectors could be estimated by the general formula, where final demand includes only the demand of final consumption expenditures on ICT goods and services:
(AP4)
(AP4)
X is the column vector whose elements present the output of all domestic sectors and the matrix is the Leontief Inverse matrix. The total value of the output of all domestic producers, which includes the production of final goods and services directly delivered to final users and the production of intermediate goods and services that are used in the production processes of ICT sectors and other domestic producers included in the ICT value added chain can be calculated by summing up the output of all producers:
(AP5)
(AP5)
where
represents a row vector of 1’s (of an appropriate dimension, here 64).
The direct and indirect effects in terms of GVA present the sum of value added coefficients per sector multiplied by the output of all domestic producers included in the supply chain of ICT sectors:
(AP6)
(AP6)
The direct and indirect effects in terms of employment present the sum of employment coefficients per sector multiplied by the output of all domestic producers included in the supply chain of ICT sectors:
(AP7)
(AP7)
Indirect effects as presented in and are derived as a difference of total effects estimated by an open IO model and direct effects. Indirect effects in terms of GVA are equal to the difference between the results of the equation (AP6) and the equation (AP2), while indirect effects in terms of employment are equal to the difference between the results of the equation (AP7) and the equation (AP3).
If one is interested not only in the total effects in terms of GVA induced by the final demand for ICT goods and services, but also in the sectoral breakdown, instead of a vector which presents value added coefficients, the diagonal matrix is to be used. For the diagonal matrix
containing the value added coefficients
on the main diagonal, the Leontief Inverse matrix
and the column vector of the exogenous final demand of final consumption expenditures on ICT products
, the column vector
whose elements
represent the total contribution of final consumption expenditures in terms of GVA of each productive sector
is equal to the:
(AP8)
(AP8)
The same set of equations could be used to estimate the total effects in terms of employment, but instead of the matrix of value added coefficients (), a matrix which presents employment coefficients is to be used (matrix
).
3. Total effects in the closed I-O model
Furthermore, total effects in the closed IO model are equal to the sum of direct, indirect and induced effects (an increase in the output related to the additional household consumption financed by wages and salaries earned in the ICT value added chain). The key matrix used in the closed model is the matrix , the sub-matrix of the matrix
,where matrix
is the expanded matrix
(the matrix of input coefficients as defined above) with an additional row with coefficients for wages and salaries and an additional column presenting the structure of household consumption.
In the simpler form, when only the total activity of all production sectors is measured, the following expressions are used:
(AP9)
(AP9)
where
represents a row vector of 1’s (of an appropriate dimension, here 64).
Total effects in terms of GVA present the sum of the value added coefficients per sector multiplied by the output of all domestic producers included in the supply chain of ICT sectors ( is the column vector of the value added coefficients):
(AP10)
(AP10)
Total effects in terms of employment present the sum of employment coefficients per sector multiplied by the output of all domestic producers included in the supply chain of ICT sectors:
(AP11)
(AP11)
Induced effects as presented in and are derived as a difference of total effects estimated by the closed IO model and total effects estimated by the open IO model. Induced effects in terms of GVA are equal to the difference between the results of the equation (AP10) and the equation (AP6), while induced effects in terms of employment are equal to the difference between the results of the equation (AP11) and the equation (AP7).
However, if not only the total economic effects in terms of GVA, but also the effects for each individual sector are estimated in the closed IO model, a diagonal matrix containing value added coefficients () is to be used. Items
are elements of the
matrix. The total contribution of final consumption expenditures in terms of GVA of each productive sector
in the closed IO model is equal to the:
For estimating the total effects in terms of employment, the same set of equations could be used, but instead of the matrix of value added coefficients (), a matrix which presents employment coefficients is to be used (
).
The calculation of direct, indirect and induced effects described in terms of GVA and employment can also be applied for calculating the direct, indirect and induced effects for the import content of the final demand, but instead of the column vector (in the case of GVA) or column vector
(in the case of employment), the column vector
is used.