
 ?Mathematical formulae have been encoded as MathML and are displayed in this HTML version using MathJax in order to improve their display. Uncheck the box to turn MathJax off. This feature requires Javascript. Click on a formula to zoom.
Abstract
Value at Risk method became one of the most used tools in bank management in order to estimate the losses resulting from a foreign currency portfolio. The study aims to estimate the maximum loss for the euro currency due to exchange rate volatility by establishing VaR, starting from the method based on historical simulations. The sample of the research consists of the four commercial banks listed on the Bucharest Stock Exchange (BSE), respectively: Romanian Commercial Bank SA (member of Erste – BCR Group); Romanian Development Bank – Groupe Societe Generale (BRD); Transylvania Bank SA (BT) and Carpatica Bank (BCC), based on a number of 757 observations corresponding to the working days in the period 1 January 2012 – 31 December 2014. The results obtained from the research showed that in case of the analyzed banks the maximum anticipated loss in a future time horizon of 10 days, with a relevance of 1%, does not exceed 2% of the net positions on the euro currency. The study could not be extended to other currencies, because in the information available for the four commercial banks only the net position on the euro currency is separately expressed.
1. Introduction
The definition attributed to the Value at Risk (VaR) method explains the significance of the results, indicating the estimated maximum loss of a portfolio of financial instruments on a short fixed-time period, and the use of the method involves arbitrary choice of two parameters: holding period of the instruments, namely, the timing and level of relevance. The VaR method is mostly used in assessing maximum loss resulting from the manifestation of various risk categories. Specifically, it is used to estimate the foreign currency portfolio depreciation, following an unfavourable exchange rate variation, credit risk event (increased non-performing loans), operational risk and even liquidity risk.
The history of VaR is related to the investment bank JP Morgan, whose president had a decisive role in its development. The creation of the Risk Metrics department in this bank – specialising only in the study and analysis of the risk – has led to a measure of risk popularised as the Value at Risk. For the first time, this method was been assigned a particular importance in 1993, in the Report of the Group of 30.
The importance and success of the method determined the Basel Committee to issue, in 1996, an amendment to the first Agreement (in force at that time) with the view to recommending to the commercial banks a way through which they calculate their minimum capital to cover exposure to market risk. Later, in the Basel II Agreement (2004), the recommendation to calculate capital requirements by taking into account the outcome of VaR becomes mandatory. Even if this legislative framework has had considerable changes made by the Basel III and the Regulation 575/2013 of the European Parliament on prudential requirements of credit institutions, the VaR calculation methodology has not undergone essential changes, being maintained as a pillar for setting capital requirements for market risk. Once adopted, the method quickly became used by commercial banks in the attempt to manage efficiently foreign currencies’ portfolios.
VaR’s ability to counter financial failures early contributed to increasing the success of this risk management instrument as in the Metallgesellschaft-1993 case, the Barings-1995 case, the LTCM-1997 case, etc. (Armeanu & Bălu, Citation2007, p. 83).
The developments of the international banking system, the complexity of the banking activity and of the economic environment have imposed further adaptations of risk management techniques.
European Parliament Regulation no. 575/2013 on prudential requirements for credit institutions recommends VaR calculation by strict compliance with the following steps:
Determining daily the level of exposure of risk;
Establishing confidence interval with a probability of 99%;
Withholding period: 10 days;
Observation period: one year minimum;
Monthly updating of the database used to determine VaR.
In order to determine VaR (analytic VaR, VaR calculated using Monte Carlo simulation, historical VaR, etc.) various models were developed, starting from the financial instruments to which the method can be applied; the accuracy of risk measures (including statistical assumptions on which they are based); implementation requirements (risk assessment models, risk decomposition, data availability); necessary informatics systems; ease of communication of results to users (Moinescu, & Codîrlașu, 2009).
2. Specialty literature
The wide use of the VaR method is closely related on the one hand to the recommendations of the Basel Committee, which requires the calculation of capital requirements for market risk based on the results obtained, and, on the other hand, to the possibility of its application in determining the loss from various areas of activity in the loan portfolios, foreign exchange portfolios and securities portfolios.
The researcher Chowdhury (Citation1993) studied the impact of exchange rate volatility on trade flows of the G7, using an error correction model, noting that there is a strong and negative correlation between the two variables.
Duncan Wilson (Citation1995), through the study undertaken, stressed VaR applicability in operational risk control.
Boudoukh, Richardson, and Whitelaw (Citation1998), after using the historical VaR, concluded that the new information on future risks has a much higher informational content than the former, which is the why it is considered proper to take into consideration the share of profit/loss values, depending on their maturity (the newer they are, the higher their share should be).
In the years 2000 and 2001, studies conducted showed significant differences resulting from the use of different methodologies for calculating VaR. Therefore, Alexander and Baptista (Citation2000) have studied the use of the Mean VaR method compared to the variance–covariance method. Whereas the application of VaR implies assuming some restrictions, they were considered by Gourieroux and Manfort (2001) in the study on the portfolios’ effectiveness analysis.
According to the researcher Medova (Citation2001), a low-frequency event has a low probability of generating operational risk.
The study conducted by experts of the International Monetary Fund (2004) considered closely the factors affecting the exchange rate volatility, focusing on the structural characteristics of the foreign exchange regime. The researchers’ conclusions (Canales-Kriljenko, Citation2004) showed that decentralised markets, regulations on the use of national currency by non-residents, and accepting limits on currency positions of banks are associated with reduced exchange rate volatility.
The VaR method is easily transmissible to the board of a company in the context of the assumption of a normal daily distribution of the return on assets (Fen Ying C., 2010).
Although the VaR method of estimating resulting loss of the currency portfolio is popular and widely used at commercial banks, many researchers recommend the CVaR (Conditional-VaR) method, arguing the ease in usage and in determining those strategies to optimise the various portfolios.
Studies conducted by Alfaro-Cid, Baixauli-Soler, and Fernández-Blanco (Citation2011) demonstrated that the use of variance provides the same results as CVaR model.
Canova and Ciccarelli (Citation2009, 2013) have shown that in the panel VaR models statistical and dynamic interrelations are captured simultaneously, making it possible to take into account a dynamic heterogeneity of the data series.
The applicability of the VaR method in the Romanian financial-banking system was studied by researchers such as:
Trenca, Mutu, and Dezsi (Citation2011) on the share price of six companies listed on the Bucharest Stock Exchange (Erste Group Bank, SIF Banat Crişana, SIF Moldova, SIF Transilvania, SIF Muntenia, SIF Oltenia), by the comparative usage of the different techniques for determining the VaR;
Trenca, Mutu, and Petria (Citation2011) on interbank interest rates;
Trenca, Pece, and Mihut (Citation2015). showed that losses in the portfolio are determined mainly by increased volatility in the currency market;
Bobeică, and Ţimurlea (2012) following the modelling of a series of data EUR/RON, for a period of five years from 2007 to 2012 (data on a daily basis), showed that at the level of a portfolio consisting of the euro currency, the maximum loss was of 2.4%, on a time horizon of 10 days, at a significance level of 1%;
Armeanu and Bălu (Citation2007) estimated VaR recorded in the portfolio of currencies held by a commercial bank for two years, while emphasising that final VaR is lower than the individual VaR of a portfolio of currencies, therefore considering the correlation coefficients between them;
time horizon (h) for which the risk assessment is carried out;
the confidence coefficient (p) or risk tolerance coefficient (1–p) for which the risk is calculated.
In addition to the recommendations of the Basel Committee, which involves a time horizon of 10 days and a probability of 99% confidence, it can be also used the methodology developed by the Risk Metrics department in case of which time horizon shrinks to 1 day, and the probability of confidence drops to 95%.
Since 1993, commercial banks have developed their own methods of assessing market risk, the selection of either of them being carried out according to the purpose of research, and the merits and disadvantages of each:
Parametric method (the method variance–covariance/analytic VaR) which requires making three assumptions, namely: a normal distribution of returns of a portfolio’s values’ instruments; constant maintenance of initial shares granted to instruments of the portfolio; completely ignoring the presence of ‘fat tails’ in the distribution of probability. The main drawback of the method is derived from the actual statistical hypothesis, according to which financial asset’s price development shows a normal distribution (rare case in practice). Moreover, the method is not recommended for portfolios containing discontinuous payoff (barrier options);
Historical simulation method which, unlike the parametric method, makes no assumption regarding the distribution of profitability, only empirical distribution being used (resulting from the analysis of the data series). The method has disadvantages in terms of estimating future values that are based on the past values and also in terms of dependency of the data set used. For example, in the situation of a determination of VaR on unusually calm markets (or volatile), but whose conditions were later changed, historical simulation is likely to generate too small estimates of the VaR for current risks. Historical simulation has difficulties in terms of taking into consideration the changes in market developments that occurred in the period considered and the VaR measures obtained through historical simulation do not capture the risk associated with plausible events in the future, but which have not happened in the past.
Monte Carlo Simulation Method, showing great flexibility compared to the other two methods, in terms of the portfolio’s return distribution, which is obtained by generating various scenarios for risk factors considered.
3. Methodology of research
For estimating VaR, Down (Citation2002) proposes determining the resulting loss or gain, as the difference between the original value of the portfolio and the value expected after h days.
(1)
(1)
in which:
W0 – initial value of the portfolio;
Wh – portfolio value after “h” days;
ΔWh – loss/profit resulted after h days (W0 < Wh – indicates registration of loss in the foreign currency portfolio after h days).
The recommendation of the Basel Committee shall require VaR by applying the following model:
(2)
(2)
where:
Wi,0 – net foreign currency position for the currency considered in RON equivalent;
α – confidence coefficient;
σi – daily volatility of currency;
h – withholding period (set timeframe).
From this model, it can be concluded that an increase in portfolio volatility will cause the flattening of the curve (distribution of returns), therefore resulting in an increase of the VaR and the increase of confidence sets an increase in VaR.
Romanian supervisory authorities (NBR Regulation no. 5/2013 and the NBR Regulation no. 22/2011) and the European supervisory authorities (Regulation no. 575/2013 of the European Parliament on prudential requirements for credit institutions, Basel III) have decided to use within the model the correlation between the confidence coefficient and the probability of simulation. Thus, as recommended by Basel III, at a probability of 99%, it is appropriate to use a confidence coefficient of 2.33, while by the recommendation of the Risk Metrics department, at a probability of 95% it is indicated to use a confidence coefficient of 1.65.
Back-testing plays an important role in validating the performance of the model and procedures for risk, although, by using back-testing errors may occur, such as: incorrect historical data/estimated incorrectly parameters; incorrect estimation of standard deviation of portfolio or of excessive nonlinearity; abnormal distribution of returns (generating an incorrect VaR); etc.
The primary objective of this study is to identify the maximum estimated loss of exposures denominated in the euro currency to commercial banks listed on the Bucharest Stock Exchange. Also, starting from foreign currency portfolio structure, we intended to identify the most vulnerable commercial bank in terms of EUR/RON rate of exchange fluctuation.
As already mentioned, the study of exchange rate volatility was conducted on a set of data on a daily basis (757 observations, the equivalent of the 757 working days in the period 1 January 2012–31 December 2014). The database was developed, starting from the value of net recorded positions of the four banks, registered on 31 December 2014 and the amounts of EUR/RON exchange rates communicated by the National Bank of Romania.
In determining VaR, the historical simulation method was used and data processing and value at risk calculation was performed using the statistical and mathematical software Excel. In this study, we used the method proposed by the Basel Committee (approved by the National Bank of Romania), respectively: 99% probability, associated with a confidence level of 2.33.
Carrying out the research involved taking the following steps:
Taking from the annual financial statements of the four commercial banks the value of the euro currency position (long or short position);
Identifying the daily EUR/RON exchange rate, in the period 1 January 2012–31 December 2014 period (757 days working);
VaR determination, namely:
Daily return calculation, according to the model:
(3)
Based on the daily rates of exchange, determining the continuous daily return (757 returns calculated with a value lower than 1);
Determination of volatility expressed as standard deviation (Standard Deviation) for the euro currency, based on the following models:
Determination of the final VaR value, by applying the model:
3.1. Limitations of the research
The research could not be extended to other currencies, given the fact that banks did not report the structure of the balance sheet and net positions denominated in currencies in which most operations were done (EUR and USD). As for the commercial banks included in the survey, most operations were denominated in euros. Net foreign currency position denominated in USD could not be brought into the study, whereas at BRD it has not been included in the financial statements. For this reason, in conjunction with the desire to ensure the maintenance of homogenous data, it was decided to study the maximum loss that the four banks may incur, due to variation of the EUR/RON rate of exchange.
4. Results of the research
The share of foreign currency positions in euro in total foreign currency position on 31 December 2014 is presented in .
Table 1. The share of foreign currency positions on the euro component at 31 December 2014.
The analysis of the foreign currency position’s structure lead us to the conclusion that in case of commercial banks that hold a majority foreign equity (Romanian Commercial Bank SA, Romanian Development Bank SA), the share of foreign currency position denominated in euros is clearly higher than that recorded by the commercial banks with full Romanian capital (Banca Transilvania SA, Banca Carpatica SA).
At the end of 2014, the four commercial banks included in the research reported the following net position on euro currency ().
It appears that Banca Transilvania SA (Transylvania Bank SA) and Banca Comercială Română (Romanian Commercial Bank SA) hold a short foreign currency position, while Banca Comercială Carpatica SA (Carpatica Commercial Bank) and Banca Română de Dezvoltare SA (Romanian Development Bank SA) recorded at the end of 2014 a long foreign exchange position. In accordance with NBR Norm no 9/1993, holding of a long foreign exchange position indicates that the volume of claims exceeds commitments undertaken by them. Prudential rules recommend that at the end of a working day, total long foreign currency position does not exceed 25% of own funds, while short foreign currency position reaches a maximum of 10% of own funds.
Table 2. Net currency position at 31 December 2014.
Over the period analysed, the evolution of RON/EUR was relatively steady, given that it ranged between 4.3072 lei/euro and 4.6481 lei/euro, the maximum appreciation of RON/EUR over three years being 8%.
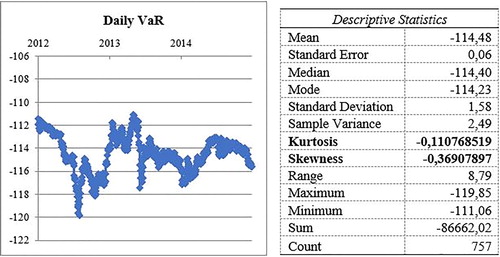
Daily evolution of VaR and the descriptive statistics of data series for the period 1 January 2012–31 December 2014 at the Romanian Commercial Bank SA – a member of Erste Group (the first largest bank in the Romanian banking system, appreciated by assets) – is shown in . From , a bimodal distribution of daily VaR can be noticed, indicating the grouping of frequencies into two modal classes, separated in their turn from classes with a low frequency. The relationship resulting from the descriptive statistics concerning the series of data between mean, median and mode indicates a normal distribution. The value obtained for the index Kurtosis (< 3) shows that the distribution is also platykurtic, indicating a lower probability for the extreme values than the normal distribution. Even if the mean of the data series is not equal to its module, a left asymmetry/skewness can be noticed, suggesting that most of the extreme values are oriented to the left, showing the appreciation trend of the RON/EUR rate of exchange. The analysis of daily VaR descriptive statistics indicates that at BCR, for a period of three years, a daily average loss of 114.480 lei is estimated, with a minimum of 111.06 thousands of lei and a maximum of 119.85 thousands of lei. By weighting the daily maximum loss with the value recorded after applying the radical in the time of withholding the structure of foreign currency position (10 days), the maximum loss resulting is of 378.99 thousand lei, representing 1.9887% of the foreign currency position (exposure the euro currency). Through the 757 simulations, the daily loss with the highest frequency was identified (5 appearances), of 114.23 thousand lei, while the standard deviation indicator’s value of 1.58 shows a very small error probability of the estimator.
Figure 1. Daily VaR evolution at BCR and descriptive statistics, period 1 January 2014–31 December 2014.
Source: Author’s calculations based on the foreign currency position and daily profitability rate developments.
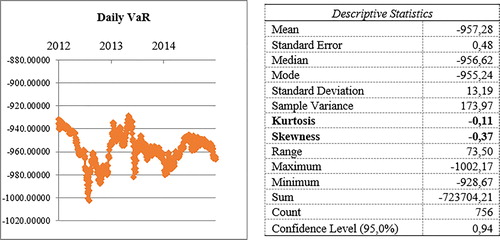
In order to determine VaR at Banca Transilvania, the standard deviation of profit or loss arising on the euro component was initially calculated, using the historical simulation method. Evolution of daily VaR with a relevance of 1%, determined over a period of three years is shown in . From , a bimodal distribution of daily VaR can be noticed, indicating the grouping of frequencies into two modal classes, separated in their turn from classes with a low frequency. The relationship resulting from the descriptive statistics concerning the series of data between mean, median and mode indicates a normal distribution. The value obtained for the index Kurtosis (< 3) shows that the distribution is also platykurtic, indicating a lower probability for the extreme values than the normal distribution. Even if the mean of the data series is not equal to its module, a left asymmetry/skewness can be noticed, suggesting that most of the extreme values are oriented to the left, showing the appreciation trend of the RON/EUR rate of exchange. The analysis of daily VaR descriptive statistics indicates that at Transylvania Bank, for a period of three years, a daily average loss of 957.28 thousands of lei is estimated, with a minimum of 928.67 thousands of lei and a maximum of 1002.17 thousands of lei. By weighting the daily maximum loss with the value recorded after applying the radical in the time of withholding the structure of foreign currency position (10 days), the maximum loss resulting is of 3.169,15 thousand lei, representing 1.99% of the foreign currency position (exposure the euro currency). Through the 757 simulations, the daily loss with the highest frequency was identified (5 appearances), of 955.24 thousand lei, while the standard deviation indicator’s value of 13.19 shows a very small error probability of the estimator.
Figure 2. Daily VaR evolution at Banca Transilvania and descriptive statistics, period 1 January 2014–31 December 2014.
Source: Author’s calculations based on the foreign currency position and daily profitability rate developments.
Banca Comerciala Carpatica SA, a medium-small-sized bank with a Romanian shareholding, considering its nature, registered a negative gap on the foreign currency component (the volume of receivables is lower than the volume of the debts in euros). To determine the maximum loss over a period of 10 days, the historical VaR method was used. The summary of daily VaR evolution is shown in .
Figure 3. Daily VaR evolution at BCC and descriptive statistics, period 1 January 2014–31 December 2014.
Source: Author’s calculations based on the foreign currency position and daily profitability rate developments.
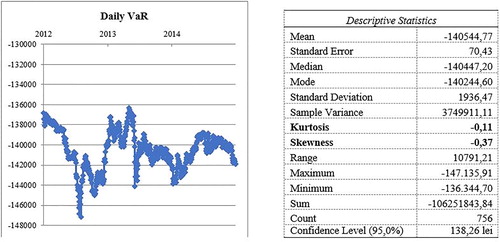
From , a bimodal distribution of daily VaR can be noticed, indicating the grouping of frequencies into two modal classes, separated in their turn from classes with a low frequency. The relationship resulting from the descriptive statistics concerning the series of data between mean, median and mode indicates a normal distribution. The value obtained for the index Kurtosis (< 3) shows that the distribution is also platykurtic, indicating a lower probability for the extreme values than the normal distribution. Even if the mean of the data series is not equal to its module, a left asymmetry/skewness can be noticed, suggesting that most of the extreme values are oriented to the left, showing the appreciation trend of the RON/EUR rate of exchange. The analysis of daily VaR descriptive statistics indicates that at Carpatica Bank, for a period of three years, a daily average loss of 140.544,77 lei is estimated, with a minimum of 136.344,70 lei and a maximum of 147.135,91 lei. By weighting the daily maximum loss with the value recorded after applying the radical in the time of withholding the structure of foreign currency position (10 days), the maximum loss resulting is of 465.281,61 lei, representing 1.9887% of the foreign currency position (exposure the euro currency). Through the 757 simulations, the daily loss with the highest frequency was identified (5 appearances), of 140.244,60 lei, while the Standard Deviation indicator’s value of 70.43 shows a very small error probability of the estimator.
Romanian Development Bank – Groupe Societe Generale SA held at the end of financial year 2014 a short foreign currency position on their foreign currency portfolio in the euros component. Although it recorded a positive gap on the euro currency, the objective proposed in the research was to identify the maximum loss the bank may feel, due to the structure of its currency portfolio. Therefore, the first step considered determining and analysing the distribution of the daily rates of return. The evolution of the exchange rate yield is summarised in .
Figure 4. Daily VaR evolution at BRD and descriptive statistics, period 1 January 2014–31 December 2014.
Source: Author’s calculations based on the foreign currency position and daily profitability rate developments.
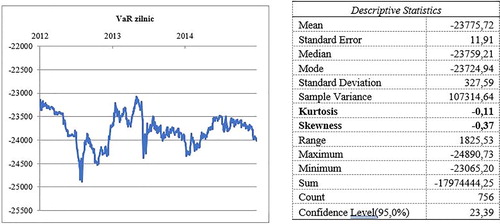
As with the other banks subject to the research, shows the existence of a bimodal distribution of daily VaR, indicating the grouping of frequencies into two modal classes, separated in their turn from classes with a low frequency. The relationship resulting from the descriptive statistics concerning the series of data between mean, median and mode indicates a normal distribution. The value obtained for the index Kurtosis (< 3) shows that the distribution is also platykurtic, indicating a lower probability for the extreme values than the normal distribution. Even if the mean of the data series is not equal to its module, a left asymmetry/skewness can be noticed, suggesting that most of the extreme values are oriented to the left, showing the appreciation trend of the RON/EUR rate of exchange. The analysis of daily VaR descriptive statistics indicates that at the Romanian Development Bank, for a period of three years, a daily average loss of 23.775,72 thousands of lei is estimated, with a minimum of 23.065,20 thousands of lei and a maximum of 24.890,73 thousands of lei. By weighting the daily maximum loss with the value recorded after applying the radical in the time of withholding the structure of foreign currency position (10 days), the maximum loss resulting is of 78.711,41 thousand lei, representing 1.9887% of the foreign currency position (exposure the euro currency). Through the 757 simulations, the daily loss with the highest frequency was identified (5 appearances), of 23.724,94 thousands of lei, while the standard deviation indicator’s value of 327,59 shows a very small error probability of the estimator (this conclusion is also supported by the large number of observations).
The comparative summary of results for the four commercial banks listed on the BSE indicates that the estimated maximum losses over a period of 10 days may be administered accordingly, not exceeding the 2% of the foreign currency portfolio. Although the estimated maximum loss amounts for a period of 10 days are not very different, the biggest loss is expected to be registered at Banca Transilvania SA. In interpreting this result, we should bear in mind that, in the total foreign currency position recorded at this bank, the position denominated in RON is 96%, losses being assessed as having low risk on the bank. The growth trend of the exchange rate and national currency depreciation has resulted from the distribution of daily frequencies, as well as from the resulting skewness coefficient’s value.
From the research, we have drawn the conclusion according to which holding a negative foreign currency position does not financially unbalance a commercial bank, given that VaR results show a number that offers banks the possibility of an adequate management of foreign currency risk.
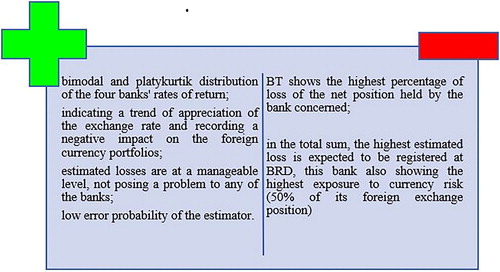
In there are captured some similarities and differences between the four commercial banks included in the survey on foreign exchange management and risk assessment.
Figure 5. Similarities and differences between the four banks on foreign currency risk assessment.
5. Conclusions
Although the share of total euro currency in the total foreign currency portfolio of the four commercial banks studied is different, the maximum loss recorded does not exceed 2% of the total foreign currency portfolio.
In the studied period, the euro currency has undergone appreciations in relation to the RON currency, therefore highlighting the volatility of markets and the lack of financial stability. However, we consider that losses are not likely to unbalance financially any of the four banks, which demonstrates the effectiveness of foreign currency portfolio management. Nonetheless, a continuation of the growth trend of the RON/EURO exchange rate may be liable to deepen the maximum estimated loss, indicating the need to increase capital requirements within these banks and a greater caution in selecting the techniques to mitigate foreign currency risk.
Our future research will consider extending the historical period, estimating VaR through Monte Carlo simulation method and subsequently comparing the results obtained by the two methods.
Bank legislation
Basel III – approved by the Basel Committee in December 2010, revised in June 2011 – available online: www.bis.org.
Regulation 575/2013 – on the prudential requirements for credit institutions and investment companies – published in the Official Journal of the European Union L176/1 of 27.06.2013.
NBR Regulation No. 5/2013 on prudential requirements for credit institutions - published in the Official Gazette, Part I, No. 841 on 30.12.2013.
OUG 99/2006 – on credit institutions and capital adequacy - published in the Official Gazette Part I, No. 1027 on 27.12.2006, as amended and supplemented.
Electronic resources
Disclosure statement
No potential conflict of interest was reported by the authors.
References
- Alexander, G. J., & Baptista, A. M. (2000). Economic implications of using a mean-VaR model for portfolio selection: A comparison with mean-variance analysis. Journal of Economic Dynamic Control, 26(7–8), 1159–1193.
- Alfaro-Cid, E., Baixauli-Soler, J. S., & Fernández-Blanco, M. O. (2011). Minimising value-at-risk in a portfolio optimisation problem using a multi-objective genetic algorithm. International Journal of Risk Assessment and Management, 15(5/6), 180–194.
- Armeanu, D., & Bălu, F.-O. (2007). Aplicarea metodologiei VaR portofoliilor valutare deținute de bănci. Economie Teoretică și Aplicată, 2, 83–92.
- Boudoukh, J. M., Richardson, Și, & Whitelaw, R. (1998). Money, banking and the financial system. Eagan, MI: West Publishing Company.
- Canales-Kriljenko, H. K. (2004). Structural factors affecting exchange rate volatility: A cross section study, IMF Working Paper no 147.
- Canova, F., & Ciccarelli, M. (2009). Estimating multicountry VaR models. International Economic Review, 50(3), 929–959.
- Chowdhury, A. (1993). Does exchange rate volatility depress trade flows evidence from error-correlation models. The Review of Economics and Statistics, 75(4), 700–706.
- Down, K. (2002). Measuring Market Risk. Chicester: John Wiley of Sons.
- Fen-Ying, C. (2010). Exchange rate risk and jump risk. Journal of Probability and Statistics, 2010, 18.
- Gourieroux, C., & Monfort, A. (2001). Pricing with Splines. Working Paper. 2001. http://www.istfin.eco.usi.ch/seminar-papers-gour.pdf.
- Medova, E. (2001). Operational Risk Capital Allocation and Integration of Risks: Firm-wide Issues for Financial Institutions. Risk Books (ed.), London.
- Moinescu, B., & Codîrlașu, A. (2009). Strategii și instrumente de administrare a riscurilor bancare. Editura ASE, 9–12.
- Trenca, I., Mutu, S., & Dezsi, E. (2011). Advantages and limitations of VaR models used in managing market risk in banks. Finance – Challenges of the Future, 1(13), 32–43.
- Trenca, I., Mutu, S., & Petria, N. (2011). Econometric models used for managing the market risk in the romanian banking system”, Analele Științifice ale Universității “Alexandru Ioan Cuza” din Iasi, Research Papers in Economics, 2011, 115–123.
- Trenca, I., Pece, A., & Mihut, I. (2015). The assessment of market risk in the context of the current financial crisis. Procedia Economics and Finance, 32, 1391–1406.
- Wilson, D. (1995). VAR in operation risk. December.