
 ?Mathematical formulae have been encoded as MathML and are displayed in this HTML version using MathJax in order to improve their display. Uncheck the box to turn MathJax off. This feature requires Javascript. Click on a formula to zoom.
Abstract
In this study, we attempt to verify if the funds constituting the (quasi)mandatory capital pillar of the Polish pension system outperformed the market in the 2014–2016 period. This research objective was raised a few times in the past, but nowadays it gains a new context. In our research the sample starts at the moment when a set of regulations was implemented to facilitate competition among funds, which should further translate into improved portfolio results. Analysing the monthly data, we employ the Performance Change Measurement approach of Grinblatt and Titman (Citation1993) to address the question of the investment outcomes. Despite the fact that the relatively short period is verified, we do not find any convincing proof of the superior portfolio performance under the new regulatory framework. Consequently, we argue that further changes should be oriented toward fund fee reduction rather than motivating managers to greater analytical effort.
1. Introduction
Pension fund performance measurement has been intensively discussed in the academic literature both on a theoretical and empirical basis. This question gains additional importance in the case of (quasi)mandatory pension funds (PFs), which are part of the public pension system (2nd pillar). We should be aware that eventual underperformance may undermine political support for PFs as well as general confidence in the system.
This paper provides portfolio performance assessment of 2nd pillar PFs operating in the Polish market. In particular, rather than creating a ranking of PFs, we address whether the PF managers were able to systematically outperform the market. This issue was raised a few times in the past, but due to the major regulatory shifts that took place in 2014, we argue it requires further investigation. We also contribute to the literature by employing the Performance Change Measurement (PCM) approach of Grinblatt and Titman (Citation1993), which may overcome a few of the shortcomings of other frequently used measures.
The remainder of the paper is organized as follows: Section 2 provides a brief overview of recent changes in the pension system landscape in Central and Eastern Europe (CEE) with a special focus on the Polish case to highlight the relevance of the research question investigated in this paper. Section 3 surveys the literature. Section 4 describes our methodological approach and data. Section 5 reports the empirical outcomes. Section 6 provides some general conclusions that may be applicable to other countries.
2. Pension system in Poland and the recent reforms in CEE region
Following the policy recommendations from the seminal (World Bank, Citation1994) report, since the late 90s’ the Central and Eastern European (CEE) governments started the fundamental reforms of their pension systems. Two general regulatory trends could be noted.
Firstly, the defined contribution rule (DC) has been introduced which could be recognized as a milestone in challenging the population ageing problem. According to this rule the pension contributions have been no longer recognized as taxes but have become the individual savings from the system participants’ perspective. This naturally should create an incentive to delay the decision to exit the labour market, as every additional contribution paid means higher pension benefit received.
Secondly, the multipillar mandatory (public) system has been established. Before, the public system was solely a Pay-As-You-Go (PAYG) type (1st pillar). This means that the taxes or contributions paid by working age generation were directly paid to retirees. Therefore, the whole mandatory system was driven by labour market trends and was especially prone to political risk. To diversify the aforementioned risk factors the capital (2nd pillar) has been introduced, where the pension receivables take the form of financial securities. Consequently, different sources of risks could be recognized there. Moreover, establishing the mandatory capital pillar was to support the development of the local financial market, if the pension contributions were allocated into domestic securities. This externality could be especially beneficial for the catching-up economies like the CEE ones. Nevertheless, the policymakers had to account also for other potential consequences of domestic vs. foreign allocation, like the emergence of speculative bubble or the depreciation of local currency. It is not surprising that due to different economic conditions the CEE states established a highly diversified policy framework in this matter, which is summarized in .
Table 1. Historical pension system framework in the selected CEE countries.
Finally, we should be aware that setting up the mandatory capital pillar, while keeping the pension contribution constant, meant a loss of budgetary revenues as part of the contribution was transferred to pension funds. This financing gap was to be covered by some fiscal adjustment or privatization revenues. However, after about a decade of experiences we know, these assumptions were overly optimistic, as this discrepancy was mainly financed by the additional public debt. It was then unsurprising that after the eruption of the global financial crisis in 2007, the policy approach to the capital pillar changed radically. Due to the worsening conditions of public finance, the governments decided to limit the size of their capital pillars ().
Table 2. Post-crisis reduction of 2nd pillar contribution in the selected CEE countries.
The aforementioned policy trends shaped also the structure of the Polish pension system. The fundamental reform was implemented in 1999; two mandatory and one voluntary pillar were established. The 1st pillar operates on a non-financial1 defined contribution (NDC) basis, i.e., the members’ contributions are recorded in individual accounts; hence, they may be treated like claims on the government. In the 2nd mandatory pillar, the individual accounts have also been settled, but the financial assets are collected here (FDC). The 2nd pillar is formed by Open Pension Funds (OFE) managed by private companies. The 3rd pillar, also of FDC type, offers supplementary occupational schemes or voluntary pension savings, which are facilitated by some tax deductions. In the decumulation phase, the value of retirement benefits from the public system (1st and 2nd pillar) is calculated as a total value of assets divided by the expected lifetime in months.
In Poland, the contribution to the public pension system has been settled at the level of 19.52% of gross salary, where 12.22% was initially transferred to the 1st pillar and the remaining 7.3% to the 2nd pillar. Since 2011, the 2nd pillar contribution has been reduced from 7.3% to 2.3%, with a possible increase to 3.5% in 2017 and beyond. However, in 2014, the government made the contribution to the capital pillar (quasi)mandatory. This means that individuals may decide if his or her contribution is split between two pillars or is transferred to the 1st pillar alone. The default option became the transfer of the whole contribution to the 1st pillar. It is not surprising (Blake, Citation2006, p. 224) that after employing the NDC as a default option, only about 15% of individuals decided to continue the partial transfer to FDC. However, the issue of 2nd pillar portfolios management did not lose its importance, as the remaining majority (85%) of labour population still possess the assets accumulated by the PFs.
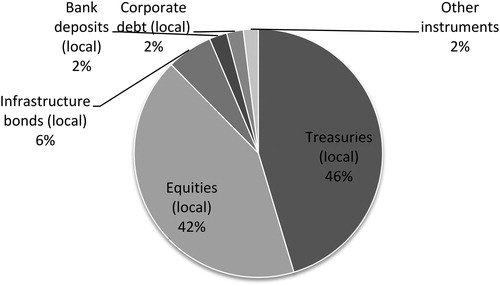
The division of the contribution and the issue of voluntariness were not the end of the regulatory shifts in the 2nd pillar. In February 2014, the government decided to exchange Polish T-bonds into the social security (NDC) records and simultaneously excluded government securities from the list of investable assets. The previously established cap on local equities became a floor at the 75% level (then, gradually decreasing every year), and the cap on foreign securities started to be gradually increased from the 5% level. exhibits the aggregated OFEs portfolio on January, 31st 2014, just before the aforementioned regulatory shifts;
Figure 1. Aggregated OFEs portfolio structure as on 31st, January 2014.
Source: own study based on Polish Financial Supervision Authority data (https://www.knf.gov.pl/Images/2014_01_czesc_A_tcm75-36989.xls)
Another important change was the abandonment of the internal benchmark, which was calculated as the weighted average of OFEs performance. This solution has been copied from the Chilean pension system and can be also found in Bulgaria, Croatia and Romania (Kawiński, Stańko, & Rutecka, Citation2012). In the case of Poland, superior performance was rewarded a special premium, and the eventual underperformance was penalized. OFEs were obliged to provide to its members the minimum guaranteed rate of return, defined as the minimum of two values: 50% of the benchmark or the benchmark deducted by 4 percentage points. If the OFE did not succeed, the discrepancy had to be covered by the OFE’s management firm. However, this system did not facilitate any competition among the OFEs, and the phenomenon of herding was identified (Kominek, Citation2006). Put simply OFEs investment behaviour was mainly driven by the threat of a severe penalty, which depended on relative underperformance; hence, OFEs were mimicking the moves of the largest players in this market. Therefore, this system gained a lot of criticism (Departament Nadzoru Inwestycji Emerytalnych, Citation2012), and an external benchmark has been established since 2014. Its structure was app. 80% of the local equity market index (WIG) and 20% of the local interbank market rate (WIBOR3M + 50 b.p.). It is important to note that this benchmark had only an informative character. To eliminate regulatory pressure on herding behaviour, the penalty mechanism was radically changed; it gained an external character – the underperformance measure is now related to the 6-year inflation rate for the Polish economy. Keeping also in mind the significant changes in the investment limits, we believe that the question of OFEs performance measurement has gained a new context and deserves further verification.
3. Literature review
There are numerous works investigating the abnormal returns of PFs in the developed economies, and here we present just a few of them. For the UK, Blake and Board (Citation2000) identified significant underperformance, while Thomas and Tonks (Citation2001) found no significant divergence from market indices for 2,175 funds in the period 1983–1997. Mixed results have also been achieved for PFs operating in the US market. Lakonishok et al. (Citation1992) analysed the quarterly returns of 769 equity PFs of a defined benefit (DB) type and identified average underperformance similarly to the earlier study of Ippolito and Turner (Citation1987). On the other hand Andonov, Bauer, and Cremers (Citation2012) found a positive and statistically significant outperformance for a sample of large US and Canadian PFs2.
Due to the relatively short history, there are just a few studies investigating the investment results of PFs operating in the CEE. The underperformance of PFs was noted in case of Latvia and Estonia (Lieksnis, Citation2010) and Slovakia (Mestan, Kubaška, & Králik, Citation2016), while mixed results were delivered for Croatia (Matek, Lukač, & Repač, Citation2015) and Lithuania (Kabašinskas, Šutienė, Miloš, & Valakevičius, Citation2017). Moving to the market of our interest, Stańko (Citation2003) was the first to challenge this dilemma for Poland. Using monthly data for the period June 1999 to March 2003 (Stańko, Citation2003), the approaches of Treynor and Mazuy (Citation1966) and Henriksson and Merton (Citation1981) were employed to identify the roots of PFs performance. The two aforementioned models can resolve if the observed performance is due to the security selection or market timing ability. This first skill applies to micro-forecasting (the manager can pick outperforming securities within the same asset class), while the second one applies to macro-forecasting (the manager can adjust the portfolio beta due to the forecasted market trends). In fact, Stańko (Citation2003) identified that both of these premia were positive and statistically significant. A similar methodology was also utilized by Bohl, Lischewski, and Voronkova (Citation2011). Using the extended sample ending in 2007, Bohl et al. (Citation2011) did not find any superior performance by Polish pension funds, while in the Hungarian case, significant underperformance was noted. Analysing monthly data for the period up to August 2013, Frasyniuk-Pietrzyk and Pietrzyk (Citation2014) again did not identify any significant outperformance of Polish PFs, but in a few cases, a positive selection premium was noted. Therefore, only Stańko (Citation2003) argued that OFEs were able to beat the market. Nevertheless, we should keep in mind that Stańko (Citation2003) investigated relatively short sample, which makes it more likely to observe the eventual outperformance, even if the asset returns are purely random.
Despite the popularity of Treynor and Mazuy (Citation1966) and Henriksson and Merton (Citation1981), we should be aware that there are always controversies around the selection of an appropriate asset pricing model. Therefore, it is worth mentioning the simulation performed by Sławiński and Tymoczko (Citation2013). In this case, the idea was basic: to observe the performance of the hypothetical pension fund managed passively and compare it with the PF results. This hypothetical portfolio had the same structure as the average PF, and its rate of return was determined by market proxies of the respective asset classes. The objective of Sławiński and Tymoczko (Citation2013) was to examine if the PFs can beat passively managed portfolios. Therefore, assuming fees typical of the passive management industry (0.1% fee on assets, no contribution fee), Sławiński and Tymoczko (Citation2013) reported surprising results. The hypothetical portfolio performance was better not only relative to the PF portfolio with the true level of fees (0.6% fee on assets, 4% contribution fee), but it outperformed the PF portfolio without any fees charged. Consequently, Sławiński and Tymoczko (Citation2013) recommended a regulatory shift toward passive management. However, this conclusion should be treated with some caution as in the analysed period, the internal minimum guaranteed rate of return mechanism was still in use, which could significantly constrain active management of PF portfolios.
4. Methodology and data
In order to verify PF performance in the new regulatory environment, we have decided to employ the Grinblatt and Titman (Citation1993) approach. Contrary to the aforementioned measures, it is not related to any asset pricing model. Instead, Grinblatt and Titman (Citation1993) classify the investors into two groups: uninformed and informed. The uninformed perceive the vector of assets’ expected returns as constant, while for informed investors, this vector is time varying. Informed investors can benefit from this knowledge by increasing (decreasing) the particular portfolio holdings for which expected returns will increase (decrease). If the informed investors perform the correct portfolio adjustment, the covariance between the asset class weight and its conditional return will be positive (Grauer Citation2008, p. 47). Therefore, a total of these covariances in a single moment for OFE is:
(1)
(1)
where is the monthly (from period
to
) rate of return on
-th asset and
and
are the weights of asset
at time
and
, respectively. Consequently, the Portfolio Change Measure is an average of the
:
(2)
(2)
In order to verify if an investor is outperforming the market, we run the -test:
(3)
(3)
where is the number of time points. The null hypothesis states that an abnormal return is zero, while the alternative states that the investor can outperform the market. Therefore, the one-tailed test is used.
It should be mentioned that the Grinblatt and Titman (Citation1993) concept has been utilized in the works of Grauer (Citation2008), Bhattacharjee and Roy (Citation2012) and Clare, Sherman and Thomas (Citation2016) for mutual fund performance analysis.
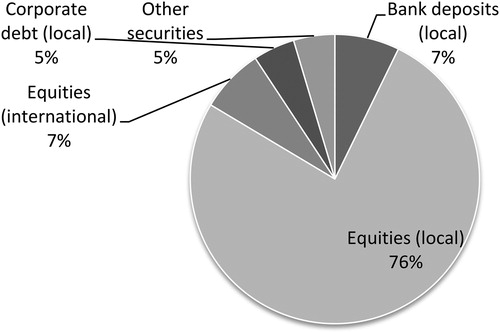
The monthly portfolio data investigated in this paper cover the period from February 2014 to December 2016 for 12 pension funds (OFE)3, which constitute the Polish (quasi)mandatory capital pension pillar. In the monthly portfolio reports, only aggregated numbers for particular asset classes can be found. Therefore, according to , we have distinguished 3 types of assets for further investigation, i.e., equities listed on the local market4, equities listed on foreign markets and bank deposits in local currency. For these three classes, we employed the appropriate proxies of . In case of local equities, the broad market index WIG was used. Foreign equities returns have been proxied by the MSCI World Index representing large and mid-cap stocks across 23 developed markets. As the MSCI Index is presented on a USD basis, we have multiplied its values by the USD/PLN spot exchange rate. According to existing regulations, OFEs are not allowed to use any currency hedging derivatives, so this step is necessary to correctly present the funds’ perspective. In the case of bank deposits, we have used the 1-month interbank PLN market rate (WIBOR 1M). The analysed asset classes comprise app. 90% of the portfolio. We have decided to exclude corporate debt from our analysis (app. 5%) as this market segment is highly illiquid and still lacks a well-grounded benchmark. OFE portfolio holdings reports have been obtained from the Polish Financial Supervision Authority website, while the source of market proxy data was Reuters Datastream.
Figure 2. OFEs portfolio structure as on 30th, December 2016.
Source: own study based on Polish Financial Supervision Authority data. (https://www.knf.gov.pl/Images/OFE_dane_mies_201612_tcm75-49032.xls)
5. Empirical results
We start our verification process from the assessment of interdependence between OFEs returns. To deliver meaningful sample estimates of correlation coefficients we need to verify the stationarity of the investigated series first. Consequently, we employ two tests for this purpose: Augmented Dickey–Fuller (ADF) and Kwiatkowski–Phillips–Schmidt–Shin (KPSS). In case of ADF test the null hypothesis states that series has a unit root (variable is not stationary), while the null of KPPS states that variable is stationary. The use of both tests should support the robustness of the results, as the ADF is known to have rather low power. The test statistics for both of the tests have been presented in and .
Table 3. ADF and KPSS tests of OFE returns.
Table 4. Correlation matrix of OFE monthly returns.
We observe that for both intervals the results of the tests are highly consistent. In case of 1 month frequency data, ADF rejects the null any time at 1% level, while KPSS delivers the same conclusions. For 3 months frequency only in three cases the significance level of ADF test is greater than 1%, but any time lower than 10%. Therefore, we are able to run the correlation analysis.
The correlation estimates presented in indicate very high level of co-movement between OFEs returns. The divergence of OFEs performance can be also evaluated on the risk-adjusted basis. For this purpose we have calculated the well-grounded measure, i.e. the Sharpe ratio:
(4)
(4)
where is the mean portfolio return,
mean risk-free rate and
is the portfolio return standard deviation of the
OFE. The results of these estimates have been presented in the second column of the .
Table 5. OFEs portfolio performance: Sharp ratio and PCM estimates and t-statistics.
We notice that the Sharpe ratios for the analysed portfolios are quite similar and the relative volatility of these estimates approximated by the coefficient of variation
(5)
(5)
where denotes standard deviation of the Sharp ratios and
its mean value, is rather limited reaching only 0,25 value. Using Sharpe ratio it is also possible to employ the Opdyke (Citation2007) test to verify if the difference between the selected pair of Sharpe ratios is statistically significant. Testing the Sharpe ratios of two portfolios (
and
) the null hypothesis states
, against the alternative
. The distribution for the null is normal with zero mean and the following variance:
(6)
(6)
where:
– standard deviation for
and
respectively,
– covariance of
and
returns,
– 3rd central moment for
and
respectively,
– 4th central moment for
and
respectively,
Once we take the difference between the top performance (0,1451) and the worst one (0,0432) according to Sharpe ratio for the investigated sample, we find it statistically significant only at the 10% level (p-value is 0,0911). If we wished to exclude the outlier from the sample and test the difference between the top (0,1451) and the restricted (0,0763) bottom result, the difference becomes insignificant even at 10% level (p-value is 0,2782). Consequently, the correlation estimates and Sharpe ratio analysis reveal that the objective of the new regulations, i.e., enhancing the investment competition between OFEs, has not been achieved.
This result is supported also by (Marcinkiewicz, Citation2015), where the similarity of the portfolios in the new regulatory environment was assessed by employing the taxonomic analysis framework. On the other hand, it would be hard to expect large diversity in the investment policy, as 75% floor limit for local equities was applied that time. Nevertheless, Marcinkiewicz (Citation2015) did not address the clue question of our interest, i.e. whether the OFEs outperformed the market. For this reason, we have tested if the PCMs for particular OFEs are greater than zero. The results are presented in .
Despite the fact, that the relatively short sample has been analysed, in the vast majority of cases (10 out of 12) the PCM values have been found to be insignificant at the 10% level This means the OFEs have been unable to adjust their portfolio structure to take an advantage from the market trends.
To sum up, the carried analysis has enabled us to formulate two general conclusions. Firstly, the OFEs performance is to large extent similar. Secondly the evidence on the superior results of OFEs relative to the market performance is still missing. Both of these findings should have some meaning for the regulatory policies.
6. Conclusions
This study supports the results obtained in earlier works by Bohl et al. (Citation2011) and Frasyniuk-Pietrzyk and Pietrzyk (Citation2014), but we contribute to the existing body of knowledge be analysing OFEs portfolio choices in the period of the new regulatory environment (2014–2016). Therefore, we conclude that the new rules were not sufficient to facilitate greater competition in the area of investment policy. There may be two general explanations for this finding.
OFEs may not try to beat the market, which may be due to various reasons. The international evidence, e.g., Queisser (Citation1998) and Chybalski (2011a) clearly reveal that individuals select the PF not on the basis of its past investment performance but by PF marketing activities (advertising, promotional gifts). Hence, there is no motivation for PFs to beat the market.
It is also possible that OFEs engage in the closet indexing phenomenon which means that managers try to mimic market indices, which are the benchmarks for their individual remuneration. Unlike passive management, it is an inexplicit strategy, as managers do not usually purchase the same securities that comprise the market index, but they mimic the weights of stocks in particular sectors. Consequently, the official strategy is an active one, but the fund charges higher fees than under a purely passive style. Following the results of the Cremers, Ferreira, Matos, and Starks (Citation2016) study, closet indexing is more likely to happen in the countries where explicit indexed funds are less popular, which resembles Polish market conditions. Currently in the Polish second pillar none of the PFs is explicitly passive, but in the region some of the PFs officially declare passive strategy, e.g. in Latvia5 or Slovakia6.
The other option is simply that OFEs are unable to beat the market due to the Efficient Market Hypothesis (EMH). According to this fundamental concept, the investors are unable to systematically outperform the market, as the security prices reflect all available information. Consequently, the prices react only to the unexpected information which means that they will follow a random walk process (Fama, Citation1970). In fact, numerous studies confirmed the unpredictability of asset returns for Polish (Potocki & Świst, Citation2012) and international, e.g., (Cheung & Lai, Citation1995), (Borges, Citation2010), markets.
Consequently, the regulator should reconsider its policy. If OFEs cannot beat the market indices, the protocols should be oriented toward reducing the charged fees. One solution can be the aforementioned passive management. In the case of Poland and other CEE countries, there is also an additional argument supporting this index tracking approach: passive management is a kind of market free riding, but due to the reductions of the 2nd pillar size, we should be less constrained by this circumstance. The another regulatory option, independent of the portfolio management style, is applying the reverse auctions in this industry which should lead to the substantial cut of the fees charged by the PFs. The promising experiences from Chile and Peru show it can be the right track and the recent research (Kurach, Kuśmierczyk, & Papla, Citation2017) additionally supports this view.
Acknowledgements
We are thankful to two anonymous reviewers for their constructive remarks on an earlier version of this manuscript. All remaining errors are our own.
Disclosure statement
This project was financed using the sources of the National Science Centre (Poland) granted under decision number DEC-2013/11/D/HS4/03840.
Notes
1 Also called ‘notional’ instead of ‘non-financial’.
2 An international comparison of PF performance on a risk adjusted basis can be also found in (Antolin, Citation2008).
3 Due to the acquisition of ‘OFE Warta’ by ‘Allianz Polska OFE’, till September, 19th 2014, there were 13 OFEs operating in the Polish market. Hence, in our estimates, we ignored the data for ‘OFE Warta’.
4 Warsaw Stock Exchange
5 http://www.manapensija.lv/en/2017/08/invalda-invl-offers-in-the-latvian-market-new-passive-management-2nd-pillar-pension-plan-invl-index-direct/ (last accessed: 25.04.2018)
6 https://europa.eu/epc/sites/epc/files/docs/pages/slovakia_-_country_fiche_on_pensions.pdf (last accessed: 25.04.2018)
Related Research Data
References
- Andonov, A., Bauer, R., & Cremers, M. (2012). Can large pension funds beat the market? Asset allocation, market timing, security selection, and the limits of liquidity. Netspar Discussion Paper (10/2012-062).
- Antolin, P. (2008). OECD Working Papers on Insurance and Private Pensions, 20.
- Bhattacharjee, K., & Roy, B. (2012). Fund performance measurement without benchmark – A case of select indian mutual funds. International Journal of Information Technology and Business Management, 5(1),12–19.
- Blake, D. (2006). Pension Economics. Hoboken, NJ: John Wiley & Sons Ltd.
- Blake, D., & Board, J. (2000). Measuring value added in the pensions industry. Geneva Papers on Risk and Insurance - Issues and Practice, 25(4),539–567. doi:10.1111/1468-0440.00081
- Bohl, M. T., Lischewski, J., & Voronkova, S. (2011). Pension Funds' performance in strongly regulated industries in Central Europe: Evidence from Poland and Hungary. Emerging Markets Finance and Trade, 47(Suppl 3),80–94. doi:10.2753/REE1540-496X4704S305
- Borges, M. R. (2010). Efficient market hypothesis in European stock markets. The European Journal of Finance, 16(7),711–726. doi:10.1080/1351847X.2010.495477
- Cheung, Y.-W., & Lai, K. S. (1995). A search for long memory in international stock market returns. Journal of International Money and Finance, 14(4),597–615. doi:10.1016/0261-5606(95)93616-U
- Chybalski, F. (2011a). The choice of Open Pension Fund made by Citizens of Poland in the Years 2003–2009: The Analysis of the criteria. The Pensions Institute Discussion Paper (PI-1102).
- Chybalski, F. (2011b). The Resilience of Pension Systems in the CEE Countries to Financial and Economic Crisis: the Need for Higher Diversification. 13th International Conference on Finance and Banking Proceedings, (pp. 258–67). Ostrava.
- Clare, A., Sherman, M. B., & Thomas, S. (2016). Multi-asset class mutual funds: Can they time the market? Evidence from the US, UK and Canada. Research in International Business and Finance, 36, 212–221.doi:10.1016/j.ribaf.2015.09.011
- Cremers, M., Ferreira, M. A., Matos, P., & Starks, L. (2016). Indexing and active fund management: International evidence. Journal of Financial Economics, 120(3),539–560. doi:10.1016/j.jfineco.2016.02.008
- Departament Nadzoru Inwestycji Emerytalnych (2012). Kryterium oceny efektywności inwestycyjnej OFE, system motywacyjny PTE oraz minimalny wymóg kapitałowy dla PTE. Warszawa: Urząd Komisji Nadzoru Finansowego.
- Fama, E. F. (1970). Efficient capital markets: A review of theory and empirical work. The Journal of Finance, 25(2),383–417. doi:10.2307/2325486
- Frasyniuk-Pietrzyk, M., & Pietrzyk, R. (2014). Efektywność inwestycji funduszy emerytalnych w Polsce – wybrane problemy. Prace Naukowe Uniwersytetu Ekonomicznego we Wrocławiu, 371,88–100.
- Grauer, R. R. (2008). Benchmarking performance measures with perfect-foresight and bankrupt asset-allocation strategies. The Journal of Portfolio Management, 34(4),43–57. doi:10.3905/jpm.2008.709979
- Grinblatt, M., & Titman, S. (1993). Performance measurement without benchmarks: An examination of mutual fund returns. The Journal of Business, 66(1),47–68. doi:10.1086/296593
- Henriksson, R. D., & Merton, R. C. (1981). On the market timing and investment performance of managed portfolios II – Statistical procedures for evaluating forecasting skills. The Journal of Business, 54(4),513–533. doi:10.1086/296144
- Ippolito, R. A., & Turner, J. A. (1987). Turnover, fees and pension plan performance. Financial Analysts Journal, 43(6),16–26. doi:10.2469/faj.v43.n6.16
- Kawiński, M., Stańko, D., & Rutecka, J. (2012). Protection mechanisms in the old-age pension systems of the CEE countries. Journal of Pension Economics & Finance, 11(4),581–605. doi:10.1017/S147474721200008X
- Kominek Z., Regulatory induced herding? evidence from polish pension funds, Econ. Change. Restruct. 45(1-2),97–119 (2011)
- Kominek, Z. W. (2006). Regulatory induced herding? Evidence from Polish Pension Funds. European Bank for Reconstruction and Development Working Paper(96).
- Kabašinskas, A., Šutienė, K., Miloš, K., & Valakevičius, E. (2017). The risk–return profile of Lithuanian private pension funds. Economic Research-Ekonomska Istraživanja, 30(1),1611–1630. doi:10.1080/1331677X.2017.1383169
- Kurach, R., Kuśmierczyk, P., & Papla, D. (2017). Can auctions help reduce mandatory pension fund fees? Journal of Pension Economics and Finance, First View, 1-30. doi: 10.1017/S1474747217000440.
- Lakonishok, J., Shleifer, A., Vishny, R. W., Hart, O., & Perry, G. L. (1992). The structure and performance of the money management industry. Brookings Papers on Economic Activity: Microeconomics, 1992,339–391. doi:10.2307/2534766
- Lieksnis, R. (2010). Evaluating the financial performance of Latvian and Estonian second-pillar pension funds. Research in Economics and Business: Central and Eastern Europe, 2(2),54–70.
- Marcinkiewicz, E. (2015). Zachowania stadne i konkurencja na rynku OFE. Badanie empiryczne z wykorzystaniem wielowymiarowej analizy statystycznej. Marketing i Rynek, 5,1067–1080.
- Matek, P., Lukač, M., & Repač, V. (2015). Performance appraisal of Croatian mandatory pension funds. Effectus - Working Paper Series(4).
- Mestan, M., Kubaška, P., & Králik, I. (2016). Evaluating Financial Performance of Pension Funds in Slovakia. International Scientific Conference FERNSTAT 2016, (pp. 105–15). Banská Bystrica.
- OECD. (2015). Pensions at a Glance 2015: OECD and G20 indicators. Paris: OECD Publishing.
- Opdyke, J. D. (2007). Comparing Sharpe ratios: So where are the p-values? Journal of Asset Management, 8(5),308–336. doi:10.1057/palgrave.jam.2250084
- Potocki, T., & Świst, T. (2012). Empirical test of the strong form efficiency of the Warsaw stock exchange: The analysis of WIG 20 index shares. South-Eastern Europe Journal of Economics, 10(2),155–172.
- Queisser, M. (1998). The second-generation pension reforms in Latin America. Ageing Working Papers(5.4).
- Rajevska, O. (2013). Funded pillars in the pension systems of Estonia, Latvia and Lithuania. Economics and Business, 23,83–89.
- Schwarz, A. M. (2011). New realities of pension policy in Central Europe. Proceedings of Pension Systems in Emerging Europe: Reform in the Age of Austerity. London: EBRD.
- Sławiński, A., & Tymoczko, D. (2013). Dla kogo wyspy tropikalne. Retrieved from http://archiwum.rp.pl/artykul/1176580-Dla-kogo-wyspy-tropikalne.html
- Stańko, D. (2003). Performance evaluation of public pension funds: The reformed pension system in Poland. Pension Institute Discussion Paper.
- Thomas, A., & Tonks, I. (2001). Equity performance of segregated pension funds in the UK. Journal of Asset Management, 1(4),321–343. doi:10.1057/palgrave.jam.2240025
- Treynor, J., & Mazuy, K. (1966). Can Mutual Funds Outguess the Market?. Harvard Business Review, 44,131–136.
- World Bank (1994). Averting the old age crisis: Policies to protect the old and promote growth. Washington DC: World Bank.