
 ?Mathematical formulae have been encoded as MathML and are displayed in this HTML version using MathJax in order to improve their display. Uncheck the box to turn MathJax off. This feature requires Javascript. Click on a formula to zoom.
Abstract
In the beginning of the twenty-first century, governments have tried to attract companies by offering different tax incentives or even changing their entire tax regime. Among the countries that have attracted foreign investments we have countries in Eastern Europe which enjoyed the benefits of the Single European Market and the stability that an EU membership brings. Given the importance of foreign capital we focus our paper on the factors the impact FDI and GDP. The main objective of the paper was to assess the impact of taxation on the GDP and FDI but our analysis has allowed to also view the impact of other factors such as infrastructure, unemployment, cost of doing business and labour force. We have selected 11 countries of the 13 New Member States that have joined the EU after 2004 and looked at data for the years 2005–2015. To see which factors influence the GDP and FDI, we have used the method of panel least squares. The results of our analysis show that taxation does play a role in the increase of the GDP and the attraction of FDI. Nevertheless, it is not the main factor and countries should not only rely on reduction of fiscal pressure.
1. Introduction
Starting in the twenty-first century, we have seen a high movement of capital between countries. The movement of capital alone does not necessarily result in growth and wealth for companies or citizens. For countries to benefit from the inflow of capital, taxation plays a vital role. While looking at the European Union (EU), we notice that the average tax to Gross Domestic Product (GDP) rate is 40% (DIAS Raquel et al. Citation2016) , which could be considered high if we compare it to 26% in the United States. However, the EU must not be viewed as a compact block in regard to taxation due the low impact of the European Union on its member states. In addition to indirect taxes, where the VAT Directive leads as the best example of tax harmonisation in the EU, the European Commission has failed to find a common understanding.
The objective of the paper is to assess the impact of taxation on GDP and Foreign Direct Investments (FDI). However, after analysing the data and constructing the model, we have focused also on other factors that impact foreign direct investment and gross domestic product. Our assumption was that taxation is an important determinant in FDI inflow and GDP growth. The importance of the paper is given by the fact that a correlation between the factors would imply that countries should focus on their tax system to attract foreign capital. This goes in line with several other authors who consider low taxation to be a factor in the attraction of FDI (Azémar & Delios, Citation2008), (Cassette & Paty, Citation2008), (Devereux, Lockwood, & Redoano, Citation2008), (Mariana Citation2008), (Nistor & Paun, Citation2013), (Redoano Citation2014), (Zodrow Citation2003), (Zodrow Citation2010). For many countries, taxation represents the primary source of government revenue. Thus, an increase in revenue can only occur through an increase in tax pressure or an increase in the tax base. In an effort to increase these revenues, we have seen that countries have developed complex fiscal systems that enable them to attract foreign capital. The tax competition could be beneficial for the countries, but it can also be harmful, leading to a ‘race-to-the-bottom’ with countries reducing their statutory corporate income tax rates.
2. Literature review
Looking at the literature available, we notice that some authors have focused on the impact of taxation on foreign direct investment and tax competition. The fact that the taxes play a significant role in the location of FDI is supported by Azémar and Delios (Citation2008). Their study shows that the fear of tax competition is not completely unjustified, as FDI reacts to changes in tax rates. Guziejewska, Grabowski, and Bryndziak (Citation2014) define tax competition as all the attempts within a taxation policy at lower tax burdens to increase the attractiveness of a given tax jurisdiction for domestic or foreign investors. According to Wilson (Citation1999), the purpose of tax competition is that each government would choose its tax policy in order to maximise the welfare of the residence. This decision subsequently affects other governments by reducing their tax base. According to Oates (Citation1972), ‘The result of tax competition may well be a tendency toward less than efficient levels of output of local services. In an attempt to keep taxes low to attract business investment, local officials may hold spending below those levels for which marginal benefits equal marginal costs, particularly for those programs that do not offer direct benefits to local business’. While the literature also talks about the differences between vertical tax competition and horizontal tax competition, in the case of Eastern European Countries, we can only talk about the latter, as the countries that are the focus of this article are not federal countries. As mentioned before, the aim of this paper was to analyse if there was a clear correlation between taxation and GDP and FDI. To test the correlation, we have looked not only at the relationship between the tax rates and the abovementioned variables but also at other factors that might determine these variables. These factors include infrastructure, cost of labour, cost of doing business and demographic factors. Knowing which of the factors have a higher influence on FDI and GDP could help governments to design a tax system that would maximise development. Our work is bringing novelty to the research in this area because previous authors have either focused on the importance and impact of foreign direct investments or just looked at the impact of corporate income tax among member states.
Zodrow (Citation2003), Redoano (Citation2014), Fernández-de-Córdoba and Torres (Citation2012), Dzialo (Citation2015) and Bertola (Citation2016) have all focused their research on European tax competition or tax harmonisation, but their conclusions do not give a clear answer whether the European Union is better off with countries competing among themselves or working together. Zodrow (Citation2003) concludes that tax competition leads to an inefficient under-provision of public services. Redoano (Citation2014) analysed panel data from European countries between 1970 and 1999 and shows that a membership in the EU forces countries to react to a drop in SCIT in another member state.
Yakita (Citation2014), in his study related to the short- and long-term effects of tax competition, concludes that tax cuts may increase the capital-labour ratio in the home country because of a decrease in capital outflows, but in the long term under certain conditions, it can also reduce capital-labour ratios.
In general, in the literature, the positive effects of FDI on the growth of the economy are linked to several factors. In their paper, Borensztein, De Gregorio, and Lee (Citation1998) argue that technological spill-over from foreign companies can only appear when there is a certain level of human capital in the host country. There are other authors who also support this idea, but there is also a very interesting perspective from Hermes and Lensink (Citation2003), who show that the development of the financial system of the recipient country is an important precondition for FDI to have a positive impact on economic growth. A better-developed financial system positively contributes to the process of technological diffusion associated with FDI. We have also considered the opinion of Bonciu (Citation2003) to be very important for our study because he believes that new investments (Greenfield) provide a significant influence on economic growth by engendering new production capacities, new working places, and creating new consumers for the products and thus new taxpayers of indirect taxes. He considers that the participation of a foreign company in the privatisation process also impacts the economy, but most of the time, the number of jobs decreases after a foreign takeover. Sarkar (Citation2007) analysed panel (1981–2002) and time-series (1970–2002) data for 51 less developed countries to see if foreign direct investment promotes growth and shows that from this group, there are long-term relations between FDI and the growth of per-capita income only in a few countries, whereas for four countries, there is a clear negative relation.
Before going to the model, we have looked at statutory corporate income tax rates of the countries in Central and Eastern Europe to see if we can see signs of tax competition ().
Looking at the developments in statutory corporate income tax (SCIT) rates for the countries in Eastern Europe, we notice that the majority of them have reduced the SCIT rate just before or soon after joining the European Union. Most of these countries have done so to create a more competitive tax system either to attract foreign investments or to support local companies. Following the entry of these low-SCIT countries, some of the older member states also had to adjust their rates in order to keep companies from seeking lower rates and higher profits outside their jurisdictions (see Austria, Portugal, Germany, the Netherlands). The argument that countries will react to the decisions of others is supported, as mentioned before, by (Wilson Citation1999). The study by Cassette and Paty (Citation2008) shows that there is a strong influence on the tax regime of another country, but most of the time, the strongest factor is geographic proximity, which would explain why Austria and Germany were among the first countries to reduce their rates following the accession of CEE countries.
The most notable evolutions of the period are those of Bulgaria and Hungary. We notice that Bulgaria has the highest drop in its SCIT tax rate (13,5 percentage points), while Hungary is the only one that has increased its SCIT rate in the period mentioned. If the business environment had not reacted positively and increased its tax base, Bulgaria would have had serious problems as there was a more than 50% drop in a timeframe of five years. Bulgaria’s case supports the argument that reducing the rates could create an environment that would attract investors and in the end lead to a higher revenue. A detailed picture can be observed in and , which show the evolution of the SCIT and revenue from CIT in both Bulgaria and Hungary. In the short term, the revenue from CIT dropped from three percent to 1.8 percent of GDP but then reached 4.4 percent in 2007, the year Bulgaria joined the EU. The subsequent reduction is due to the economic and financial crisis and the debt crisis that have hit the EU. In the case of Hungary, we see an initial decrease of SCIT and then, after a few years, an increase due to a need for short-term revenue in the budget. When lowering the SCIT, positive changes to the collected revenue as a percentage of GDP appear only after a certain time. When a country raises the SCIT, it will experience a short-term boost of the revenue followed by a medium-term reduction ( and ).
Figure 1. Evolution of the SCIT rates and percentage of CIT in the GDP in Bulgaria (2002–2015). Source: Author’s own calculations.
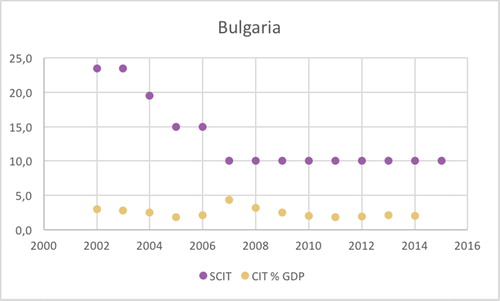
Figure 2. Evolution of the SCIT rates and percentage of CIT in the GDP in Hungary (2002–2015). Source: Author’s own calculations.
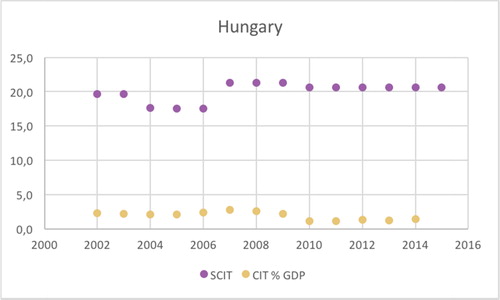
Figure 3. Coefficient confidence intervals GDP model. Source: Author’s own estimations.
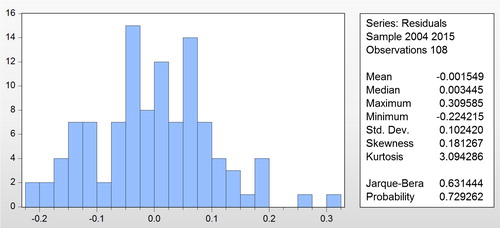
Figure 4. Fitted model for dependent variable GDP. Source: Author’s own estimations.
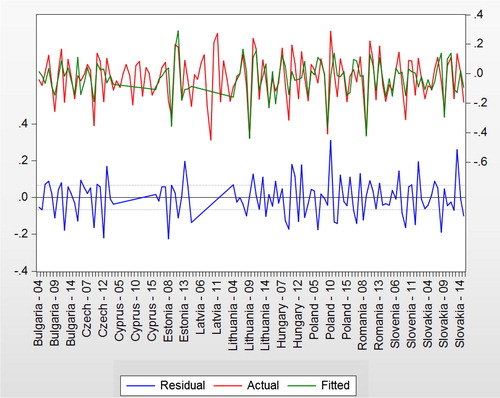
Figure 5. Coefficient confidence intervals FDI model. Source: Author’s own estimations.
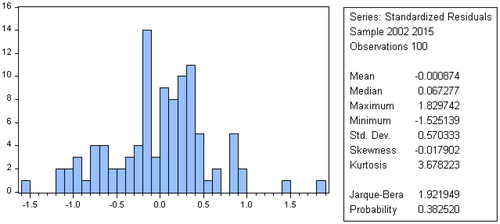
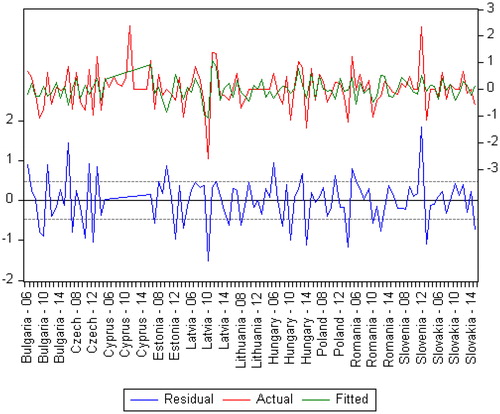
Figure 6. Fitted model for dependent variable FDI. Source: Author’s own estimations.
In previous work, we have discussed the relationship between SCIT and FDI (Nistor & Paun, Citation2013), but the focus has been mostly on Romania. The model that was used only considers the CIT and VAT rates, while as mentioned before in the paper, FDI does not only react to taxation but to several variables.
In our analysis, we have also considered that the GDP will depend on the labour cost and unemployment, with many companies switching their base of operations in Eastern Europe due to lower labour costs. Additionally, we have taken into consideration that infrastructure and its development play a role. While these variables are linked most of the time with labour-intensive jobs, we have also included variables that could attract other types of capital: investment in education, bank deposits to GDP, and costs to start a business (percentage of income per capita).
3. Data
Our study was focused on countries in Eastern Europe, as the literature has relatively little information about these countries in regard to tax competition and capital mobility. Additionally, most of the countries have a similar profile, former communist countries that started their development at the beginning of the 1990s. In the first years of democracy, these countries all went through major reforms; thus, it is difficult to analyse and to find proper data for these years. We have looked at several sources to find accurate data and to refine the numbers when we have found different numbers from different databases. The data that we have used for the countries was collected from the same source for each variable to compare the same type of data. Most of the data were collected from the United Nations Conference on Trade and Development database, the Eurostat database, the European Central Bank database, the World Bank database and the database of the DG Taxation and Customs Union of the European Commission. The data that we have obtained was most of the time either in USD or in Euros, so there was no need for conversion. To confirm that the information is accurate, where it was possible, we have also checked primary sources, i.e., national institutes of statistics.
Our most important variables were the gross domestic product, the inflow of foreign direct investments and the tax rates (Statutory Corporate Income Tax Rate, taxes on capital as percentage of total taxes, and taxes on capital as percentage of GDP). For the GDP, we have the amounts in USD at current prices. This was because the countries that we have selected use different national currencies. Some of them switched to the Euro in the studied period and have thus benefited from the stability of the European currency. We did not choose real prices, as the effects of inflation were not very important for our study, and most of these effects are also balanced by the exchange rate and thus resolved through conversion from national currency to USD. When speaking about capital mobility, we have many definitions and concepts. Most likely, the easiest to understand is the ability of capital to cross national borders without obstacles and in search of higher returns. In our model, we have assumed that the mobility of capital is represented by the inflow of foreign direct investment. We did not consider the outflow of FDI because the countries that we have selected are not known as capital exporters. This is not because of obstacles but has more to do with the capacity of local companies that do not cross national borders, with exemptions of course. The percentage of tax on capital was chosen as a sign of the tax pressure on capital mobility. These were chosen because they focus not only on foreign capital but on the entire economy. While FDI inflow does not react fast in the case of changes in tax policy, companies already operating in the jurisdiction are forced to react.
Some of the variables rely on expenditures of the government–infrastructure–such as length of highways and length of railways. Infrastructure was chosen as a variable because of the importance of access to international markets. As the markets in CEE countries are relatively small (except Poland and perhaps Romania), most companies would not rely solely on the domestic market but are using the countries as production and/or distribution centres. We have included demographic variables such as wages, unemployment and population, as these are important determinants of FDI. Access to a cheap labour force has been a driver of globalisation since the beginning (of course, we see now that in most of the CEE countries, this is not the case, and companies are looking more for competences than reduction of costs). The availability of the labour force is also strongly linked to the arguments that human resources are an important driver of FDI. We also looked at variables that are influenced directly by the state–cost of doing business and statutory corporate income tax. Finally, in our analysis, we have also included some of the variables that are indirectly linked to the measures taken by the government–EMU convergence bond yields, taxes on capital as percentage of total taxes, and taxes on capital as a percentage of GDP.
4. Methodology
As a wok method, we chose the Fully Modified Least Squares Method for the estimation of the correlation between the GDP and the variables. This method is used to provide the optimal estimates of cointegrating regressions. Using the same method, we have explained the correlation of FDI using the variables that were chosen. When looking at the revenue collection rate in the EU, we notice that the average in the last 13 years is between 38.8 and 39.4 percent. As there is a continuous competition in lowering taxes, the only way a country can increase its revenue is through increasing its GDP, thus making it vital to see the correlation between taxation, growth (represented by GDP) and capital mobility (FDI inflow). Before doing the test for causality, we have first performed a test for stationarity or a test of the order of integration for each variable that we have chosen.
The check of the stationarity of times-series variables is most of the time done by using the traditional Augmented Dickey Fuller (Dickey & Fuller, Citation1981) and the Philips and Perron unit root test (Phillips & Perron, Citation1988). Similar to Agrawal (Citation2015), we have also used for our panel data the Levin–Lin–Chu test (Levin, Lin, & Chu, Citation2002) and the lm–Persaran–Shin test (Im, Pesaran, & Shin, Citation2003). In the table below, we will show the results of the test for the variables that we have included in our hypothesis and the sources of our data ().
After the stationarity test was performed we passed to the next step, which is to test for the existence of a long-run cointegration among our variables using panel cointegration tests suggested by Pedroni. We made use of seven panel cointegrations by Pedroni (Citation1999), since he determines the appropriateness of the tests to be applied to estimated residuals from a cointegration regression after normalising the panel statistics with correction terms.
The procedures proposed by Pedroni make use of estimated residual from the hypothesised long-run regression of the following form:
for t = 1,….,T; i = 1,…., N; m = 1, …., M,
where T is the number of observations over time, N the number of cross-sectional units in the panel, and M the number of regressors. In this set up, is the member specific intercept or fixed effects parameter which varies across individual cross-sectional units. The same is true of the slope coefficients and member specific time effects,
The results of the Pedroni Residual Cointegration test using deterministic and trend assumptions are shown in .
Table 1. Statutory corporate income tax rates in CEE Countries 2002–2014.
Table 2. Results of the panel unit root test.
Table 3 Pedroni residual cointegration.
Table 4. GDP model.
Table 5. FDI model.
5. Results and discussion
After setting the correct variables, we used the method of panel least squares to see what the variables are that would influence FDI and GDP. We have noticed that besides taxation, there are other factors influencing the GDP and FDI. Thus, we have constructed several models using the different variables. In the end, we present the models that we consider to be the most accurate given the profile of the countries that we have selected in our pool ().
Our model has estimated the following equation based on the factors that we have included in the analysis:
GDP = −0.024065*FDI − 0.081146*Cost of Business − 0.427869*Hourly Cost − 0.036084*Motorways − 0.481974*Railways + 3.044326*Employment + 1.490285*Taxes on Capital as % of GDP − 1.937715*Taxes on Capital as %of Total Taxes − 0.103452*SCIT
The model explains 53% of the variation of the Gross Domestic Product for the selected countries and the time and validates our hypothesis that it is influenced by taxation. When testing our hypothesis we excluded some of the variables from the model because these are closely linked with others – the population and the total unemployment can be considered redundant if we take employment as a variable. We have left the Railways and the Motorways in the model, even if the probability is higher than 0.05 because the response of the overall model. Thus, after including the two mentioned variables the R-squared remains at a very high level 0.53 and the model has no fixed effects.
There are seven variables that have a negative correlation with the GDP, the statutory corporate tax rates, the average hourly labour costs and the percentage of the taxes on capital from the total taxes, the cost of doing business and surprisingly the length of motorways and railways. In our model, we see that there is a high correlation between employment and the GDP and taxation. The infrastructure is surprisingly negatively correlated. As a reason for this we can include the fact that most of the infrastructure is provided by foreign companies. As another reason, we could include the fact that the data is not sufficient to see the high impact of an increase in infrastructure. In fact, in the years studied we did not see a major increase in infrastructure. These findings are in contrast with those of Ahmad, Ismail, and Nordin (Citation2015), Bakar, Mat, and Harun (Citation2012), Kaur, Khatua, and Yadav (Citation2016), Rehman, Ilyas, Mobeen Alam, and Akram (Citation2011) and Wekesa, Wawire, and Kosimbei (Citation2016). In all their work infrastructure had a positive correlation with FDI.
In our model the most important variable is represented by employment which has a correlation coefficient of 3.044326. This result is in the same order as other researchers who have studied specifically the effect of labour on FDI (Jude & Silaghi, Citation2016), (Huiqun & Jinyong, Citation2011) and (Hunya & Geishecker, Citation2005). On the one hand this is normal due to the fact that the economy can only grow if there is a large enough workforce to produce the goods or to provide services, and on the other hand if we consider economies that are growing because of consumption there is a need for people who would consume the products – see the case of the German economy in 2015 ( and ).
There are some errors in the model, which are grouped for the countries that we have included in our analysis, and most of them are around the two major crises and their aftermaths that occurred within the studied period–the Economic and Financial Crisis and the Sovereign Debt Crisis.
Using the model that we have created we can estimate the impact of the most important variables which could be easily improved by governments. Thus, for instance, if we look at employment we can see that these countries have struggled to keep their workforce in the country after the accession to the EU. Romania and Poland are countries with big minorities living outside their borders. Companies have tried to promote measures that would convince their citizens to return to their home countries. We also see that taxation plays an important role. The Statutory Corporate Income Tax Rate has a low correlation −0.10 but we notice that taxes on capital as a percentage of total taxes has a high negative correlation −1.93. Thus, we could say that the more governments switch to taxes on capital, the less encouraging it is for companies. The taxes on capital as percentage of GDP have a positive correlation of 1.49 because this is linked to any increase of the GDP.
If we examine taxation at the EU level, we notice that the average percentage of taxes on capital from the total taxation is at approximately 20%. Estonia, for instance, is at 7.1 percent (ranked twenty-fourth from EU MS), and it is at the EU average level for labour taxation (ranked fifteenth from the EU MS in 2014), above the EU level with taxes on consumption (ranked eighth). If Estonia would switch from taxes on consumption to taxation of capital and reach average EU levels, this would increase their GDP by 1 percent. The ranking is based on tax revenue raised by Member States as a percentage of GDP and is based on a report issued by the DG Taxation and Customs Union (Taxation Trends in the European Union Citation2016).
The next step in our analysis was to see if the taxation of companies plays any role in the inflow of foreign direct investment and what other variables have a significant influence. Do the same variables influence both the gross domestic product and the FDI? Is their impact positive or negative?
As in the previous example, we have tested several models before choosing one that would have the highest percentage of the response variable variation.
Our model has estimated the following equation based on the factors that we have included in the analysis:
FDI= −0.21390732492*FDI(−1) + 0.839884242059*GDP + 1.3494750168*GDP(−2) + 0.391291059272*EMU_BY(−1) − 0.722025267148* Hourly Cost (−1) − 0.201594664444* Unemployment (−1) + 4.71581414583* Railway – 0.435004076522* SCIT
As in the previous model, the FDI is influenced by the infrastructure of the country, but in this case, the only variable is the length of the railways. This is easily explained because most of the shipping should be done by train due to cost efficiency and speed, if we are considering long distances (Patterson, Ewing, & Haider, Citation2008). Similar to the GDP model, we see that some of the variables have been taken out, perhaps due to redundancy–employment and population. Unlike the GDP, the FDI is influenced by the unemployment rate. Again, this is easy to explain, as green-field investments rely on availability of a workforce. The model is also influenced by the average hourly labour cost. Due to this, companies have put their labour-intensive production facilities in Eastern European countries, while the production facilities that require high production costs have still remained outside these countries. In our model, this variable has a correlation coefficient of −0.722, which is in line with most of the authors who argue that the decision to invest in the Eastern European countries is driven by cost reduction (Popescu Citation2014) (Bellak, Leibrecht, & Riedl, Citation2008).
Unlike in the GDP model, we notice that the 10-year bond yield does influence our model. There is a discussion related to the purchase of state bonds because most of the time, the mere purchase is not considered as FDI but portfolio foreign investment. The data from UNCTAD is based on the classic definition of FDI (IMF Citation1993), which would count if there is a lasting power of the investor in a company by owning at least 10% of the voting power. Nevertheless, there could be an influence of the 10-year bond yield because sometimes state bonds could be purchased through domestically owned companies.
We again see that statutory corporate income tax has a high probability, but the inclusion of this variable has increased the R-squared. Thus, if we take the entire model, we see that there is significance to this model ().
We also note that there is a problem with the residuals. The model that we estimated does not follow a normal pattern, but this could be explained because there could be many other variables that impact FDI inflows into a country ().
6. Conclusions
In our study, we have started from the assumption that taxation does play a very important role for countries. Due to this, countries will try to create a taxation system that will allow them to attract new investments and generate growth. We have also seen that switching from one type of taxation (from consumption to capital) could increase the GDP.
The models that we have constructed both include statutory corporate income tax. In the GDP model, we have seen that the variables related to taxation have a high impact. The study clearly shows that there is a correlation between taxation, GDP and FDI. Hence, there is a need to correlate the taxation systems in order to attract FDI and generate a higher GDP and revenues for the states. In our model, we have a negative correlation between the taxes on capital as percentage of the total taxes and the GDP, which would imply that in order to grow their GDP, countries would need to reduce the tax level. We also see that there is a negative correlation between the statutory corporate income tax and both the GDP and the FDI. Governments should not overestimate the effects of the reduction in statutory CIT because this could lead to a “race to the bottom”. Designing an efficient taxation system, which would maximise the revenue and minimise the costs for corporations, is a difficult challenge, and further studies are necessary to create a model that would allow countries to reach the optimal point of Laffer’s curve. In our study, we did not take into account the different types of treaties that could encourage or discourage investments. Having investors from countries that apply the credit method would make the argument of a lower tax rate obsolete, as the company investing would still need to pay taxes based on their worldwide income. Moreover, other factors such as geographical proximity were not considered, as there is no sufficient data to create models for each country included in the study.
References
- Agrawal, G. (2015). Foreign direct investment and economic growth in BRICS economies: a panel data analysis journal of economics. Business and Management, 3. doi:10.7763/JOEBM.2015.V3.221
- Ahmad, N. A., Ismail, N. W., & Nordin, N. (2015). The Impact of Infrastructure on Foreign Direct Investment in Malaysia International Journal of Management Excellence, 5
- Azémar, C., & Delios, A. (2008). Tax competition and FDI: The special case of developing countries. Journal of the Japanese and International Economies, 22(1), 85–108. doi:10.1016/j.jjie.2007.02.001
- Bakar, N. A. A., Mat, S. H. C., & Harun, M. (2012). The impact of infrastructure on foreign direct investment: The case of Malaysia. Procedia - Social and Behavioral Sciences, 65, 205–211. doi:10.1016/j.sbspro.2012.11.112
- Bellak, C., Leibrecht, M., & Riedl, A. (2008). Labour costs and FDI flows into Central and Eastern European Countries: A survey of the literature and empirical evidence. Structural Change and Economic Dynamics, 19(1), 17–37. doi:10.1016/j.strueco.2007.03.001
- Bertola, G. (2016). Labor policies and capital mobility in theory and in EMU. European Economic Review, 87, 62–77. doi:10.1016/j.euroecorev.2016.04.007
- Bonciu, F. (2003). Investitii straine directe. Bucharest: Lumina Lex.
- Borensztein, E., De Gregorio, J., & Lee, J. W. (1998). How does foreign direct investment affect economic growth?1. Journal of International Economics, 45(1), 115–135. doi:10.1016/S0022-1996(97)00033-0
- Cassette, A., & Paty, S. (2008). Tax competition among Eastern and Western European countries: With whom do countries compete?. Economic Systems, 32(4), 307–325. doi:10.1016/j.ecosys.2008.06.003
- Devereux, M. P., Lockwood, B., & Redoano, M. (2008). Do countries compete over corporate tax rates?. Journal of Public Economics, 92(5–6), 1210–1235. doi:10.1016/j.jpubeco.2007.09.005
- Dickey, D. A., & Fuller, W. A. (1981). Distribution of the estimators for autoregressive time series with a unit root. Econometrica, 49(4), 1057. 1072
- Dzialo, J. (2015). Tax competition or tax coordination? What is better for the European Union? Comp Econ Res, 18. doi:10.1515/cer-2015-0011
- Fernández-de-Córdoba, G., & Torres, J. L. (2012). Fiscal harmonization in the European Union with public inputs. Economic Modelling, 29(5), 2024–2034. doi:10.1016/j.econmod.2012.04.016
- Guziejewska, B., Grabowski, W., & Bryndziak, S. (2014). Tax competition strategies in corporate income tax - the case of EU countries. Business and Economic Horizons, 10(4), 253–271. doi:10.15208/beh.2014.21
- Hermes, N., & Lensink, R. (2003). Foreign direct investment, financial development and economic growth. Journal of Development Studies, 40(1), 142–163. doi:10.1080/00220380412331293707
- Huiqun, L., & Jinyong, L. (2011). The home‐employment effect of FDI from developing countries: in the case of China. Journal of Chinese Economic and Foreign Trade Studies, 4, 173–182. doi:10.1108/17544401111178212
- Hunya, G., & Geishecker, I. (2005). Employment effecfs of foreign direct investments in central and Eastern Europe. EU DG Employment, Social Affairs and Equal Opportunities,
- Im, K., Pesaran, M. H., & Shin, Y. (2003). Testing for unit roots in heterogeneous panels. Journal of Econometrics, 11, 53–74. doi:10.1016/S0304-4076(03)00092-7
- IMF (1993). Balance of payments manual. 5th ed. Washington D.C.: International Monetary Fund.
- Jude, C., & Silaghi, M. I. P. (2016). Employment effects of foreign direct investment: New evidence from Central and Eastern European countries. International Economics, 145, 32–49. doi:10.1016/j.inteco.2015.02.003
- Kaur, M., Khatua, A., & Yadav, S. S. (2016). Infrastructure development and FDI inflow to developing economies: Evidence from India. Thunderbird International Business Review, 58(6), 555–563. doi:10.1002/tie.21784
- Levin, A., Lin, C. F., & Chu, C. S. J. (2002). Unit root tests in panel data: Asymptotic and finite‐sample properties. Journal of Econometrics, 108(1), 1–24. doi:10.1016/S0304-4076(01)00098-7
- Mariana, S. (2008). Tax competition and capital mobility between old and new Eu members states. Annals of the University of Oradea, Economic Science Series, 17, 540–545.
- Nistor, I.-A., & Paun, D. (2013). Taxation and its effect on foreign direct investments. Nauki o Finansach, 37–47.
- Oates, W. E. (1972). Fiscal federalism. New York: Harcourt Brace Jovanovich.
- Patterson, Z., Ewing, G., & Haider, M. (2008). Shipper preferences suggest strong mistrust of rail: Results from stated preference carrier choice survey for Quebec City-windsor corridor in Canada. Transportation Research Record: Journal of the Transportation Research Board, 67–74. doi:10.3141/2008-09
- Pedroni, P. (1999). Critical values for cointegration tests in heterogeneous panels with multiple regressors. Oxford Bulletin of Economics and Statistics, 61(s1), 653–678.
- Phillips, P. C. B., & Perron, P. (1988). Testing for a unit root in time series regression. Biometrika, 75(2), 335–346.
- Popescu, G. H. (2014). FDI and economic growth in Central and Eastern Europe. Sustainability, 6(11), 8149–8163. doi:10.3390/su6118149
- Raquel, D. I. A. S., Pavel, D. V. O. R. A. K., Elvira, G. O. E. B. E. L., Lukas, R. U. C. K. A., & Laura, W. A. H. R. I. G. (2016). Taxation in the EU member states. New York: Eurostat,
- Redoano, M. (2014). Tax competition among European countries. Does the EU matter?. European Journal of Political Economy, 34, 353–371. doi:10.1016/j.ejpoleco.2014.02.006
- Rehman, C. A., Ilyas, M., Mobeen Alam, H., & Akram, M. (2011). The Impact of Infrastructure on Foreign Direct Investment: The Case of Pakistan. International Journal of Business and Management, 6. doi:10.5539/ijbm.v6n5p268
- Sarkar, P. (2007). Does foreign direct investment promote growth? Panel data and time series evidence from less developed Countries, 1970-2002. Munich Personal RePEc Archive.
- Taxation Trends in the European Union (2016). doi:10.2785/420903
- Wekesa, C. T., Wawire, N. H., & Kosimbei, G. (2016). Effects of infrastructure development on foreign direct investment in Kenya. Journal of Infrastructure Development, 8(2), 93–110. doi:10.1177/0974930616667875
- Wilson, J. D. (1999). Tax competition and trade protection. Theories of Tax Competition National Tax Journal, 52, 269–304.
- Yakita, A. (2014). Effects of capital taxation on economies with different demographic changes: short term versus long term. Journal of Population Economics, 27(1), 257–273. doi:10.1007/s00148-013-0480-x
- Zodrow, G. R. (2003). Tax coordination in the European Union. International tax and public finance, 10(6), 651–671. doi:10.1023/A:1026377819946
- Zodrow, G. R. (2010). Capital mobility and capital tax competition. National Tax Journal, 63(4, Part 2), 865–901. doi:10.17310/ntj.2010.4S.03