
 ?Mathematical formulae have been encoded as MathML and are displayed in this HTML version using MathJax in order to improve their display. Uncheck the box to turn MathJax off. This feature requires Javascript. Click on a formula to zoom.
Abstract
The financial performance is an indicator of financial stability, health and condition of any organisation. It could be utilised as a proper measure of the firm’s credibility and its ability to pay off debts. Financial institutions use this measure to determine the lending policy and applicants’ credits. This study proposes a model based on the CCSD weighing method and hybrid FCM-ARAS approach for clustering and evaluating the financial performance to enable banks to identify target groups and design appropriate and relevant policies. Based on previous studies and the views of senior financial managers of a public bank in Iran, eight economic criteria were evaluated. The presented method was used to assess the financial performance of 58 manufacturing companies applying for loans from a federal bank in Iran. However, the CCSD method was used to calculate criteria weights, and a hybrid FCM-ARAS approach was developed and applied to financial evaluation and clustering the companies. The use of the CCSD method can eliminate errors caused by subjective models and human judgments, and increase the accuracy of the assessment. In this study, the debt ratio and equity to total assets and ROA were identified as the main criteria to assess financial performance.
Introduction
An organisation’s financial performance plays a critical role in making decisions on risk-taking practices, such as provision of credit or finance in various sectors within any country’s economy (Dong, Chen, & Wan, Citation2018; Emel, Oral, Reisman, & Yolalan, Citation2003). This feature directly is related to the survival of the organisation (Wang, Citation2014) and it can be an appropriate indicator of the credibility and predicted ability to pay off debts (Yurdakul & Ic, Citation2004). Financial analysts utilise ratios presented in financial statements to analyse and assess the financial performance of organisations (Yalcin, Bayrakdaroglu, & Kahraman, Citation2012). Examining the financial report of organisations provides valuable information beneficial to banks, commercial and investment institutions, government and decision makers of organisations. This information can be used to determine the financial performance, risks, and health of organisations and predict future conditions (Chen, Nie, & Wen, Citation2015; White, Sondh, & Fried, Citation2003).
The financial performance analysis in banks and other financial institution can be performed using two main approaches: a subjective analysis based on decision makers and financial experts’xperience, and systematic study following accurate financial information and using decision models (Babic & Plazibat, Citation1998). The results of both approaches are affected by human judgments. The former approach, solely relying on experts' opinions to assess the financial performance of organisations, may not respond to today's dynamic environment conditions due to the presence of unrealistic assumptions and the strong effect of subjective orientations in assessments (Ic, Citation2014). Therefore, the systematic approach has recently become more popular as it provides more accurate and reliable results. Among the range of systematic approaches, multiple attribute decision-making (MADM) methods have received considerable attention for various reasons including the multiplicity of evaluation criteria, differences in the relative importance of rules, and its capability to handle complex evaluation. Therefore, the use of MADMs has become significant for corporate financial performance assessments (Dong et al., Citation2018; Lee, Lin, & Shin, Citation2012, Citation2018; Safaei Ghadikolaei, Khalili Esbouei, & Antucheviciene, Citation2014). However, even in these methods, financial experts play a decisive role in criteria selection and criterion weight determination (Danesh Shakib & Fazli, Citation2012; Moghimi & Anvari, Citation2014; Wang, Citation2014; Yalcin et al., Citation2012).
Banks are one of the leading organisations which use financial performance measurement techniques to decide on the provision of credit and lending services to their customers. Like any other commercial organisation, banks are typically more interested in providing credits and loans to the companies with the best financial performance to accordingly reduce repayment risks. However, in some countries such as Iran, the governments mandate public banks to provide loans and credits to all companies regardless of their financial performance to help with growth and development of top companies as well as supporting weaker companies. Thus methods capable of assessing the financial performance of companies and categorising them into different performance classes would be very beneficial to the banks to implement relevant policies for each category. Even though several methods have been developed for financial performance assessment, they cannot determine their performance class. Therefore, the current study was performed to provide such a comprehensive systematic tool for economic evaluation and clustering the companies to aid the banks in their decision making and lending service policies.
The method presented herein was developed using financial information from several manufacturing companies applying for loans from a public bank in Iran. Unlike previous approaches, the proposed method in this study uses financial experts’ opinions just for the selection of financial performance measure criteria while benefiting from an objective based technique known as CCSD (Correlation Coefficient and Standard Deviation) to determine the weight of the tests. Financial experts generally have a high degree of awareness about the key criteria and indicators. However, the subjective nature of their decisions to determine the requirements heavily influencestheir mental models which could reduce the assessment accuracy. Sometimes a criterion may be considered by experts to be of the utmost importance, but does not make a significant distinction between alternatives. The CCSD method eliminates the subjective and qualitative nature of experts’ opinions by using statistical analysis to determine the correlation coefficient and standard deviation of data (Igoulalene, Benyoucef, & Tiwari, Citation2015; Wang & Luo, Citation2010).
A method was presented in this paper, in which Fuzzy C-Means (FCM), and Additive Ratio Assessment (ARAS) were integrated to rank discrete alternatives based on a set of given multiple criteria. This integrated approach combines the strong points of these two methodologies and offers a classification for data objects based on various criteria. The rankings in the proposed combined method have two stages, and accordingly, it has a minimised computational effort needed for classification. To evaluate the financial performance of companies by this hybrid approach, firstly, the FCM algorithm is used to cluster and classify the companies and then the ARAS method is applied to assess and rank the clusters and companies within each group.
With regard to the contents presented in the sections above, the paper's innovations can be summarized as follows: First, the combination of FCM and ARAS methods for the first time has been introduced in order to simultaneously conduct clustering and prioritisation. Secondly, this approach has been used to assess the financial performance of companies using real world information. A powerful objective method, CCSD, is also used to assign more accurate weights to the criteria in financial performance assessment to eliminate the subjectivity of the process.
The remaining sections are as follow. A review of the literature of financial performance evaluation has been provided, and the criteria used in past researches have been identified. Then, the methods and steps of research techniques have been described in detail. Next, a case study has been presented, and after the selection of final criteria, the financial information extracted from financial statements of the manufacturing companies has been analysed to assess their business performance and discuss the results of this study. The final section gives conclusions and suggestions for future researches.
Literature review
The application of MADM methods has become a common systematic approach for the assessment of corporates, business firms, and manufacturers’ financial performance (Dong et al., Citation2018; Gündoğdu, Citation2015; Lee et al., Citation2012, Citation2018; Safaei Ghadikolaei et al., Citation2014; Shaverdi, Ramezani, Tahmasebi, & Rostamy, Citation2016). To this end, several criteria covering a broad range of financial information have been considered to aid with the economic evaluation. The requirements included but were not limited to profit margin, sales growth, sales margins, operating income, return on equity (ROE), return on assets (ROA), debt ratio, current ratio, equity ratio, deposit ratio, pre-tax profit ratio, and current assets ratio. The type of studies using MADM methods in the context of financial performance evaluation were classified into three major categories based on the kind and procedure of criteria weighting.
The first category includes studies where equal weights are assigned to all criteria (e.g., Bulgurcu, Citation2012; Gündoğdu, Citation2015; Ignatius, Behzadian, Malekan, & Lalitha, Citation2012; Karimi & Barati, Citation2018). The second category includes studies in which a unique weight is assigned to each criterion using subjective expert-oriented methods such as AHP and fuzzy AHP (e.g., Cheng, Chen, & Huang, Citation2012; Danesh Shakib & Fazli, Citation2012; Moghimi & Anvari, Citation2014; Safaei Ghadikolaei et al., Citation2014; Shaverdi et al., Citation2016; Turskis, Daniūnas, Zavadskas, & Medzvieckas, Citation2016; Yalcin et al., Citation2012). Finally, the last category of MADM includes a few studies in which objective methods such as entropy model are used to determine the relative importance of criteria and assign realistic weight to them (Saparauskas, Zavadskas, & Turskis, Citation2011). The research developed by (Lee et al., Citation2012) is among few studies in the literature in which the experts did not play a role in determining criteria weights.
To date, several models have been proposed and used to analyse the financial criteria and evaluate performance. Technique for Order of Preference by Similarity to Ideal Solution (TOPSIS) has been widely used for financial performance assessment (e.g., Bulgurcu, Citation2012; Gündoğdu, Citation2015; Moghimi & Anvari, Citation2014; Shaverdi et al., Citation2016; Wang, Citation2014; Yalcin et al., Citation2012). VIKOR is another robust model used for financial performance assessment (Chang & Tsai, Citation2016; Yalcin et al., Citation2012). Recently, new integrated methods have been developed. For example, Safaei Ghadikolaei et al. (Citation2014) measured the financial performance of six Iranian automobile manufacturers based on 11 economic indicators. The Fuzzy AHP was used to determine the criteria weights, whereas the Fuzzy ARAS, Fuzzy VIKOR, and Fuzzy COPRAS were implemented for individual examinations of research alternatives (Zavadskas, Turskis, & Bagocius, Citation2015). Further, Li (Citation2014) developed a new decision-making approach known as IVIF-HCA (Interval-Valued Intuitionistic Fuzzy Hamacher Correlated Averaging). This method was employed to assess the financial performance of five hypothetical companies, based on four specific indicators: the ability to pay off debts, operational capability, revenue capacity and development capability.
Research methodology
The overarching goal of this study is to evaluate the financial performance of several business organisations applying for loans from a public bank and to use multiple attribute decision-making methods to aid with the process of loaning and allocation. shows the overall operation and steps required to achieve the research objectives.
Figure 1. Research methodology diagram.
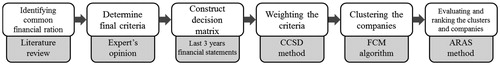
Based on a review of relevant studies (e.g., Lee et al., Citation2012; Moghimi & Anvari, Citation2014; Safaei Ghadikolaei et al., Citation2014; Shaverdi et al., Citation2016; Wang & Lee, Citation2010), a list of most usable financial criteria was prepared for financial performance evaluations in the context of manufacturing companies. The list of rules was provided to a group of experts including six high-rank experienced managers of the case study bank. The experts were requested to evaluate the set of criteria and, based on their experience and knowledge, to select the most important and relevant ones. They also were asked to add the missed criteria to this collection based on their opinion. After the final criteria were defined, to increase the accuracy and comprehensiveness of this evaluation, the 12-month audited financial statements for the last three years were reviewed, and the data necessary for obtaining the criteria were extracted. Thus, the average performance of companies was regarded as the assessment base over the past three years. Next, the CCSD method was used for weighting the criteria, and the integrated FCM-ARAS approach was employed individually to cluster the companies under study and also to evaluate the clusters and financial performance of related companies. The techniques are described in detail below.
CCSD method
The multiple attribute decision-making process is based on choosing the best alternative from a limited set, according to a finite set of criteria. Since the requirements have different values of importance, determining the weight of each measure is a crucial parameter for the multiple attribute decision-making process. Many techniques proposed to determine criteria weights using multi-criteria decision making were categorised into three main groups: expert-based (Subjective), data-based (Objective) and hybrid methods. Experts play an essential role in determining criteria importance in Subjective approaches. The weight values are calculated based on the information derived from their preferences. However, in an actual procedure, the weight of indicators is given according to the report available in the decision matrix, while data extracted by experts and their judgments do not contribute to determining the criterion weight. This may reduce the impact of subjective orientations and individual tendencies of experts on the weighting process, and also increase the accuracy of evaluations. Among the most common objective methods are CRITIC (Diakoulaki, Mavrotas, & Papayannakis, Citation1995); Entropy (Deng, Yeh, & Willis, Citation2000); standard deviation (Deng et al., Citation2000); maximising deviation method (Wu & Chen, Citation2007); CCSD (Wang & Luo, Citation2010). In the third category, weights of attributes are determined by using both decision makers’ subjective information and objective decision matrix information. Thus, it is known as Integrated methods. Subjective and objective integrated approaches are examples of this category (Ma, Fan, & Huang, Citation1999; Xu, Citation2004).
CCSD is a new objective method offering a correlation coefficient (CC) and standard deviation (SD) integrated approach to determine attribute weights, developed by (Wang & Luo, Citation2010). This method has several advantages over other objective techniques. The lack of need for a specific normalisation method, in contrast to the entropy method; more comprehensive and reliable weights compared to entropy and SD methods; and having a more transparent mechanism than the CRITIC are some advantages of the CCSD method. The more complete examples were discussed by (Wang & Luo, Citation2010). The CCSD method has been used to determine the weights of criteria in some studies (Hua & Lei, Citation2018; Igoulalene et al., Citation2015; Singh & Benyoucef, Citation2013). Below is a description of the weight calculation process (Wang & Luo, Citation2010).
Suppose that there are n decision alternatives, assessed based on m attributes,
forms a decision matrix,
where
represents the performance of alternative
for the attribute
The m attributes are divided into two major categories: cost (negative) and benefit (positive). Since the attributes usually have different unit’s calls, the decision matrix
must be normalised to make them comparable. The most widely-used relations for the matrix normalisation are given as:
(1)
(1)
(2)
(2)
Where,
and
are the index sets of benefit and cost attributes, respectively. A normalised decision matrix with elements defined as
is computed by EquationEq. (3)
(3)
(3) :
(3)
(3)
Now, for the weight vector of attributes, which satisfies W ≥ 0, we have:
(4)
(4)
The assessed value for each of the decision alternatives is calculated by EquationEq. (5)(5)
(5) , when the Simple Additive Weighting (SAW) method is used (Hwang & Yoon, Citation1981; MacCrimmon, Citation1968).
(5)
(5)
This is a linear function of attribute weights. The higher the assessed value, the better utility the decision alternative has. The best decision alternative provides the greatest overall assessed value. Here, the attribute is removed to investigate its effect on the decision making. Once
was removed, the overall assessment values for each decision alternative are redefined as EquationEq. (6)
(6)
(6) :
(6)
(6)
The correlation coefficient between the value of the attribute and the above-mentioned overall assessment value is expressed as (7):
(7)
(7)
Where the values of and
are calculated using EquationEquations (8)
(8)
(8) and Equation(9)
(9)
(9) :
(8)
(8)
(9)
(9)
If is large enough to be close to unity, then
and the overall assessment value with the exclusion of
will have the same numerical distributions and rankings. Here, the removal of
exerts little influence on decision making; therefore, a small weight is assigned to it. If
is small enough to be close to 0, then
and the overall assessment value with the exclusion of
will find different numerical distributions and rankings. In this case, the removal of
has the significant influence on decision making and, therefore, the high weight is assigned to it. Further, when one attribute shows the same effect with all alternatives, it is possible to delete that attribute without affecting decision-making. In other words, the attributes with larger standard deviations (SDs) must be assigned higher weights than those with smaller SDs. Therefore, the attribute weights are expressed as (10):
(10)
(10)
Where is the standard deviation of attribute
given by EquationEq. (11)
(11)
(11) :
(11)
(11)
And, the square root of is found to reduce the difference between the largest and smallest values of weight. Otherwise, a bigger difference between the largest and smallest weights is observed. EquationEq. (10)
(10)
(10) is a non-linear system of equations. It includes m equations uniquely determined by m weight variables. It is possible to form a non-linear optimisation model to solve this system of equations, as follows:
(12)
(12)
Next, the non-linear model can be solved using MATLAB or LINGO software packages, and the weights of each attribute can be extracted.
Fuzzy C-Means algorithm
Clustering is an important topic in the context of data mining that can be used to classify several alternative different clusters (Shahsamandi E, Sadi-nezhad, & Saghaei, Citation2017). Fuzzy C-Means (FCM) is a well-known clustering method. It is of great interest for allocating members to clusters, due to its high reliability and greater flexibility compared to hard clustering techniques (Keskin, Citation2015; Pimentel & de Souza, Citation2016; Yang & Nataliani, Citation2017). It is an indefinite cluster of the set of objects described in the form of U matrix (Bai, Dhavale, & Sarkis, Citation2014). This matrix has n rows and c columns, representing the number of objects and categories, respectively. The element uik represents the value of membership for the object i in cluster k. There is no certainty about the membership of an object in one clustering. However, the probability of object membership in different clusters is of importance. The partitions of the FCM algorithm included a set of n objects, each with a p-character, a data vector and clustered in c clusters. Cluster centres are displayed for each cluster by and
and calculated using EquationEq. (17)
(17)
(17) . Moreover, the membership degree for the i-th alternative in the k-th cluster (
) is shown as uik, calculated by EquationEq. (16)
(16)
(16) . Accordingly, the possible relationships are described as follows.
(13)
(13)
(14)
(14)
(15)
(15)
The FCM algorithm seeks to minimise the target function shown in EquationEq. (16)(16)
(16) .
(16)
(16)
Where m (m > 1) represents an exponential weight controlling the fuzzy rate of clustering results. This weight is equal to the Euclidean distance of the object from the centre of cluster
The solutions to the constrained optimisation problem in EquationEq. (16)
(16)
(16) are expressed in EquationEquations (17)
(17)
(17) and Equation(18)
(18)
(18) .
(17)
(17)
(18)
(18)
The recurring steps required to find an optimum solution are (Türksen, Citation2006) as follows:
Step1: Select (
)
Step 2: Find cluster centres
Step 3: Repeat the steps above for
Step 4: Calculate the membership value in EquationEq. (17)
If and
then the procedure stops. Otherwise, it continues until finding other t values.
After clustering using the FCM algorithm, each object can be assigned to one cluster according to its membership degree, ranged in the interval [0,1]. The higher the membership degree of an object in a group, the higher the probability that the object belongs to that category. The FCM algorithm requires two types of relevant information from the user, including the value of c (the number of clusters) and m (the fuzzy value of the group). As the user subjectively determines these two values, the quality of optimum solution and the membership degree of objects in clusters are influenced by choice of these two parameters. The value of c - the number of groups - affects the causal region of a cluster, while the initial value of cluster centres impacts the amount of compression and the accuracy of clusters.
In recent years, the FCM algorithm method has been integrated with several multiple criteria decision-making methods, among which DEA (Azadeh, Anvari, Ziaei, & Sadeghi, Citation2010), TOPSIS (Bai, Dhavale et al., Citation2014), VIKOR (Akman, Citation2015), DEMATEL (Keskin, Citation2015), PROMETHEE (Bai, Zhang, Qian, Liu, & Wu, Citation2018) and an interval type 2 hesitant MCDM (Oner & Oztaysi, Citation2018) can be cited.
Additive ratio assessment (ARAS) method
Recently, attention paid to the ARAS method, a relatively novel tool for MCDM (Turskis & Zavadskas, Citation2010a, Citation2010b; Zavadskas & Turskis, Citation2010), according to the theory that states that the accurate understanding of the world complex phenomena is possible through simple relative comparisons (Buyukozkan & Gocer, Citation2018; Heidary Dahooie, Beheshti Jazan Abadi, Vanaki, & Firoozfar, Citation2018; Liao, Fu, & Wu, Citation2015; Tamosaitiene, Zavadskas, Sileikaite, & Turskis, Citation2017) The ARAS method adopts the optimality degree concept to find the ranking. It is equal to the sum of weighted normalised values of the criteria with respect to each of the alternatives divided by the sum of weighted normalised values of the best option (Chatterjee & Kar, Citation2018; Ecer, Citation2018; Heidary Dahooie, Zavadskas, Abolhasani, Vanaki, & Turskis, Citation2018; Rostamzadeh, Esmaeili, Nia, Saparauskas, & Keshavarz Ghorabaee, Citation2017; Sivilevicius, Daniunas, Zavadskas, Turskis, & Susinskas, Citation2012; Turskis, Kersuliene, & Vinogradova, Citation2017; Turskis, Morkunaite, & Kutut, Citation2017)
Step 1: First, an
represents the performance value of the i-th alternative based on the j-th criterion. Also,
indicates the optimum value for the j-th criterion. The unknown optimum value for the variable j is found as follows:
(20)
(20)
Generally, the evaluation values of the alternatives based on criteria and the weight of each criterion (
) are provided as the entries of the decision matrix. Each criterion reflects its certain dimension; therefore, to perform a comparative analysis and to prevent potential consequences of different dimensions, it is required to derive dimensionless quantities. Therefore, the weighted values are simply divided by the optimal value obtained as EquationEq. (20)
(20)
(20) . Several methods are available to derive dimensionless values, which are explained in the following. Normalisation is a process which converts the original decision matrix values into the values on [0, 1] or on [0; ∞].
Step 2: The normalisation of the primary entries is performed for all criteria.
We have benefit type and cost type criteria; hence, the normalisation process is performed positively or negatively based on (22) and (23), respectively.
(22)
(22)
(23)
(23)
A framework is provided in which each criterion can be compared to all others using dimensionless quantities.
Step 3: At this step, the weight values are applied to the normalised decision matrix
Where, represents the weight value for the j-th criterion, and
denotes the normalised value for the i-th alternative. Then, the optimality function value can be determined using the following equation:
(26)
(26)
Based on the ARAS method logic, the best alternative has the highest optimality function value while the worst alternative has the lowest optimality function value. Hence, the alternatives are ranked according to the value of To evaluate the degree of utility,
we can compare each alternative against the best/optimal alternative, denoted by
The degree of utility for the alternative
is determined as follows:
(27)
(27)
Where and
are obtained using EquationEq. (26)
(26)
(26) .
is used for ranking all the alternatives, placed in the interval [0,1].
Hybrid FCM-ARAS method
Suppose that there are n decision alternatives, assessed based on m attributes,
forms a decision matrix,
where
represents the performance of alternative
for the attribute
Step 1: Determining the membership values of the alternatives in each cluster and calculating the cluster centres. It is necessary to determine the membership values in each group (matrix U) and the centres of clusters (matrix V) using EquationEq. (13)
Step 2: Determining the cluster of each alternative after clustering. After determining the membership value of each alternative in different clusters, it is necessary to specify the final allocation of each alternative in the existing clusters and assign a cluster to each of them. For this purpose, EquationEq. (28)
Where denotes the cluster which the i-th alternative belongs to. Similarly, using EquationEq. (29)
(29)
(29) , all alternatives in each cluster are also determined:
(29)
(29)
Where
represents the alternatives in the k-th cluster.
Step 3: Determining the ideal alternative for all clusters. In this step of the process, it is necessary to specify the ideal alternative or, in other words, the optimal values of the alternatives for each criterion according to EquationEq. (30)
Where is the optimal value for the j-th criterion. If the optimal value of j-th variable is unknown, then, it is determined by using EquationEq. (31)
(31)
(31) considering whether the criterion is positive or negative:
(31)
(31)
Step 4: Normalising the alternatives in each cluster. To normalise the alternatives available in each of the clusters, EquationEqs. (32)
For positive (benefit) criteria
(33)
(33)
For negative (cost) criteria
Step 5: Weighting the normalised values in each of the clusters. The weights obtained from the CCSD method are used in the EquationEq. (34)
Where and
represent the normalised value and the weight of the j-th criterion, respectively. In this study,
is calculated using the CCSD objective method which satisfies the conditions described in EquationEq. (24)
(24)
(24) .
Step 6: Determining the value of optimality function for the k-th cluster. In this step, it is necessary to calculate the value of the optimality function using EquationEqs. (35)
In EquationEq. (35)(35)
(35) , ‖
‖ represents the number of members in the set
and
denotes the average optimality function of the alternatives in the k-th cluster. Also, in EquationEq. (36)
(36)
(36) ,
represents the value of the optimality function of the ideal alternative.
Step 7: Calculating the degree of utility for each cluster and ranking them. The degree of alternative utility is obtained by comparing the value of the optimality function of that alternative (cluster) with the value of the optimality function of the ideal alternative or
The value of is placed in the interval [0,1], which is considered as the basis for cluster ranking. Accordingly, the higher the
value for a cluster, the higher its rank.
Step 8: Ranking the alternatives in the k-th cluster. Following the above steps and prioritising each of the clusters, the alternatives in each cluster are prioritised. The evaluation of the alternatives in the k-th cluster based on each of criteria is represented by
Now, based on EquationEq. (19)(19)
(19) through (27), and using the matrix
as the input of the above process, the alternatives in the k-th cluster are also ranked.
Case study
The methodology proposed in this study was used for evaluation of the financial performance of a business organisation applying for loans from a public bank in Iran. The sample includes 58 different manufacturing companies with the 12-month financial records for the last three years. A comprehensive list of financial measures commonly used to evaluate the financial performance of manufacturing companies was extracted from the literature and provided to the experts. The experts involved in this study included six high-rank experienced financial managers of the bank under investigation. They were requested to select the most important criteria based on their experience, opinion and reviewing the data availability of all companies. The final list of requirements for this study was included eight different financial measures where seven of them are benefit criteria, and the remaining one is cost criteria. The final list is presented in . The information to evaluate the companies was extracted after analysing their annual financial statements for the last three years and the required indicators were calculated to develop the decision matrix for the evaluation process ().
Table 1. Final financial criteria.
Table 2. Initial decision matrix.
Results
CCSD method
To evaluate the financial performance of companies using the proposed method, the weight of each criterion must be determined using the CCSD method. With respect to the positive (benefit) or negative (cost) criteria, EquationEquations (1)(1)
(1) and Equation(2)
(2)
(2) were employed to normalise the decision matrix shown in . After obtaining the normalised decision matrix, the optimisation problem Eq. (12) was solved using the definitions given in EquationEquations (4)
(4)
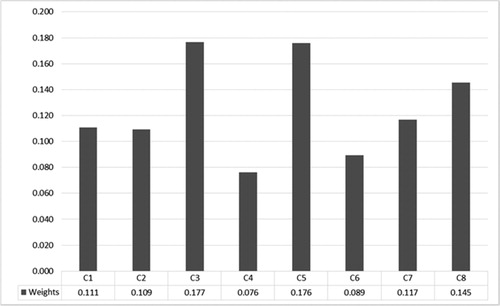
(4) through (11). The weight of criteria was obtained using the CCSD method shown in . As shown in , the debt ratio and equity to total assets (C3 and C5) are the most important evaluation criteria while Net Profit margin ratio (C4) is the least important one.
Figure 2. Criteria Weights using CCSD.
FCM algorithm
The FCM was then utilised to cluster the 58 manufacturing companies using the initial decision matrix shown in . Based on the initial review of the applicants’ information, the experts decided to classify them into ten different clusters using the FCM. Therefore, the cluster centres were computed using Equationequation 16(16)
(16) and presented in . Then, using EquationEq. (17)
(17)
(17) and the values obtained for the cluster centres, the membership of companies in each cluster was calculated, as shown in . Accordingly, each company is placed in the group which has the highest percentage of membership.
Table 3. Calculating cluster centres in each cluster.
Table 4. Companies membership percentage in each cluster.
ARAS method
After determining the weights of the criteria and the members in each of the clusters, using the EquationEqs. (30)(30)
(30) and Equation(31)
(31)
(31) , the ideal alternatives for all clusters were estimated, and after stepping through the integrated FCM-ARAS method described above, the degree of utility for each one of the groups was calculated. The ranking of groups was determined based on the degree of efficiency which is shown in .
Table 5. Ranking of clusters using the ARAS method.
After ranking the clusters, it is necessary to evaluate the alternatives in each group using EquationEq. (38)(38)
(38) . Due to the plurality of the clusters, the ranking process of the alternatives in cluster 1 is presented as an example. The output of the ranking process for other groups is presented. Accordingly, after applying EquationEq. (38)
(38)
(38) to cluster 1, the initial decision matrix is formed as .
Table 6. Initial decision matrix for cluster 1.
In the next step, using EquationEq. (20)(20)
(20) , the ideal alternative in this cluster was calculated, and the resulting decision matrix was normalised. Therefore, based on whether the criteria are positive or negative, we may use EquationEqs. (22)
(22)
(22) or Equation(23)
(23)
(23) . In this step, the weighted normalised decision matrix () was obtained following the EquationEq. (25)
(25)
(25) (multiplying the matrix mentioned above by the weight of each criterion).
Table 7. Weighted Normalised decision matrix for cluster 1.
In this step, we should calculate the value of the optimality function and the degree of utility of each alternative by applying the EquationEqs. 26(26)
(26) and Equation27
(27)
(27) . Based on the logic of the ARAS, the ranking is based on the degree of utility. These values for the alternatives in cluster 1 are shown in .
Table 8. Ranking of alternatives in cluster 1.
The process mentioned above is similar for other clusters, and the results are presented in .
Table 9. Ranking of companies in ten clusters.
The results to better illustrate the outcome of the analysis are summarised and shown in . The companies located in the upper left corner (e.g. A17, A20, and A54) of have the best financial performance, while the ones found in the bottom of the last column (e.g., A37, A4, and A30) have the worst performance. is the final product of the proposed method which can be utilised by the bank managers and decision makers to allocate their resources according to the government’s policies.
Figure 3. The ranking of clusters and companies in each cluster.
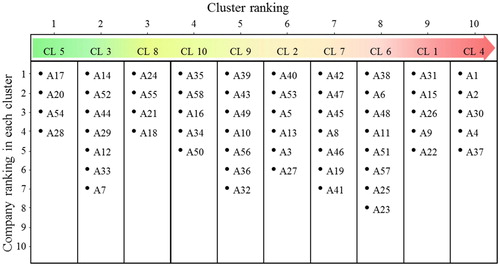
Based on the ranking results in , companies A17, A20 and A54 are the top three companies with the best financial performance and high priority to receive loans from the bank. A37, A4, and A30 are the companies in the lowest clusters which have the preference to receive supportive credits from the bank according to governmental policies. This will help the bank’s decision-makers to identify their major and minor roles to define payment policies. The result of this study was submitted to the experts and the bank decision makers. According to their feedback, the results show good agreement with their experience and judgment.
Conclusion & recommendation
Performance evaluation is a very critical process in any industry, and the assessment of financial performance is among the most important ones. It is necessary to determine and evaluate the financial performance of companies carefully as well as to predict their future conditions. In particular, banks need accurate tools for assessing financial performance to analyse the creditworthiness of their clients’ ability to pay debts and to decide on the provision of a facility. However, based on economic policies of governments like Iran, banks require financing funds to support weaker corporations. In such a situation, banks need measures to assess the financial performance of companies and categorise them to adopt appropriate policies applicable to each company. Accordingly, we developed a new integrated evaluation approach in this research by using FCM-ARAS for modelling the financial performance assessment and clustering of manufacturing companies. The proposed approach benefits from the CCSD objective method to determine the relative importance of criteria, led to higher accuracy of evaluation by eliminating the role of experts and subjective assessment of criteria. Then, in order to evaluate the financial performance of companies by FCM-ARAS hybrid approach, first, the FCM algorithm was used to cluster and classify the companies, and then the ARAS method was applied to assess and rank the clusters and companies within each group.
In this study, the debt ratio and equity to total assets and return on assets (ROA) were identified as the most critical criteria of financial performance assessment. Although these criteria have received lower weights in previous studies, the significant differences in their associated values in the decision matrix led to their choice as the essential criteria according to the CCSD logic. Since the CCSD method is a data-based process, criterion weights are determined based on the degree of difference between the alternatives. However, in subjective weighting methods such as fuzzy hierarchical analysis (used by -for example- (Danesh Shakib & Fazli, Citation2012; Moghimi & Anvari, Citation2014; Safaei Ghadikolaei et al., Citation2014), the relative importance of criteria is based on expert opinions and personal judgments, where the relative value of rules against each other is not calculated. Since clustering aims to put similar alternatives within one cluster, assigning higher weights to criteria with a higher degree of differentiation will lead to more accurate clustering and ranking. Obviously, that changes in the subject, and data of the study will change the importance and criteria due to the use of objective methods.
The presented method was used for evaluating the financial performance of 58 manufacturing companies applying for loans from a public bank in Iran. The information was extracted to assess the companies after analysing their annual financial statements for the last three years. The companies were classified into ten clusters by using the FCM algorithm and the priority of each group and the companies in each cluster was determined by the ARAS method based on their financial performance.
In summary, the FCM-ARAS combination method which was developed for the first time in this paper to simultaneously compare clustering and ranking companies from the perspective of their financial performance assessment, can greatly undermine the shortcomings of previous research in the field of financial performance assessment of companies and will significantly help organisations and financial institutions in selecting target customers to provide financial facilities. On the other hand, in order to minimise the role of experts and their judgments in the process of evaluating the financial performance of companies, the authors used the CCSD method instead of conventional subjective methods to weight the criteria, which reduces dependency on experts and as a result, greatly decreases the subjectivity of the model.
Even though the role of experts in determining the weight of criteria is eliminated in the proposed approach, the authors believe that the combination of objective (e.g. CCSD) and subjective (e.g. experts opinion) approaches will result in a more comprehensive and accurate result. Therefore, it is suggested that in future studies integrated criteria evaluation approaches be considered. Also, the companies in this study were only evaluated based on their financial performance. It was found that the non-financial performance of companies should be regarded simultaneously to ensure a comprehensive evaluation.
This research is based on real data and one of its limitations is the lack of access to similar data in other financial institutions, which in part reduces the possibility of comparison and model performance evaluation. Therefore, it is recommended that the method presented in this research be used in future research in several financial institutions to evaluate the companies applying for the facility and the results be compared so that the model's reliability can be measured.
References
- Akman, G. (2015). Evaluating suppliers to include green supplier development programs via fuzzy c-means and VIKOR methods. Computers & Industrial Engineering, 86, 69–82. doi:10.1016/j.cie.2014.10.013
- Azadeh, A., Anvari, M., Ziaei, B., & Sadeghi, K. (2010). An integrated fuzzy DEA–fuzzy C-means–simulation for optimization of operator allocation in cellular manufacturing systems. The International Journal of Advanced Manufacturing Technology, 46(1-4), 361–375. doi:10.1007/s00170-009-2088-6
- Babic, Z., & Plazibat, N. (1998). Ranking of enterprises based on multicriterial analysis. International Journal of Production Economics, 56-7, 29–35. doi:10.1016/S0925-5273(97)00133-3
- Bai, C., Zhang, R., Qian, L., Liu, L., & Wu, Y. (2018). An ordered clustering algorithm based on fuzzy c-means and PROMETHEE. International Journal of Machine Learning and Cybernetics, 1–14. doi:10.1007/s13042-018-0824-7
- Bai, C. G., Dhavale, D., & Sarkis, J. (2014). Integrating Fuzzy C-Means and TOPSIS for performance evaluation: An application and comparative analysis. Expert Systems with Applications, 41(9), 4186–4196. doi:10.1016/j.eswa.2013.12.037
- Bulgurcu, B. (2012). Application of TOPSIS technique for financial performance evaluation of technology firms in istanbul stock exchange market. World Conference on Business, Economics and Management (Bem-2012), 62, 1033–1040. doi:10.1016/j.sbspro.2012.09.176
- Buyukozkan, G., & Gocer, F. (2018). An extension of ARAS methodology under interval valued intuitionistic fuzzy environment for digital supply chain. Applied Soft Computing, 69, 634–654. doi:10.1016/j.asoc.2018.04.040
- Chang, S. C., & Tsai, P. H. (2016). A hybrid financial performance evaluation model for wealth management banks following the global financial crisis. Technological and Economic Development of Economy, 22(1), 21–46. doi:10.3846/20294913.2014.986771
- Chatterjee, K., & Kar, S. (2018). Supplier selection in telecom supply chain management: A Fuzzy-rasch based Copras-G method. Technological and Economic Development of Economy, 24(2), 765–791. doi:10.3846/20294913.2017.1295289
- Chen, Y-H., Nie, P-y., & Wen, X-W. (2015). Analysis of innovation based on financial structure. Economic research-Ekonomska Istraživanja, 28(1), 631–640.
- Cheng, C. H., Chen, C. T., & Huang, S. F. (2012). Combining fuzzy integral with order weight average (OWA) method for evaluating financial performance in the semiconductor industry. African Journal of Business Management, 6(21), 6358–6368. doi:10.5897/AJBM11.534
- Danesh Shakib, M., & Fazli, S. (2012). Separating successful and unsuccessful firms using multiple attribute decision-making methods. International Journal of Information and Decision Sciences, 4(1), 19–29. doi:10.1504/IJIDS.2012.045126
- Deng, H., Yeh, C. H., & Willis, R. J. (2000). Inter-company comparison using modified TOPSIS with objective weights. Computers & Operations Research, 27(10), 963–973. doi:10.1016/S0305-0548(99)00069-6
- Diakoulaki, D., Mavrotas, G., & Papayannakis, L. (1995). Determining objective weights in multiple criteria problems—The Critic method. Computers & Operations Research, 22(7), 763–770. doi:10.1016/0305-0548(94)00059-H
- Dong, J. Y., Chen, Y., & Wan, S. P. (2018). A cosine similarity based QUALIFLEX approach with hesitant fuzzy linguistic term sets for financial performance evaluation. Applied Soft Computing, 69, 316–329. doi:10.1016/j.asoc.2018.04.053
- Ecer, F. (2018). An integrated fuzzy Ahp and Aras model to evaluate mobile banking services. Technological and Economic Development of Economy, 24(2), 670–695. doi:10.3846/20294913.2016.1255275
- Emel, A. B., Oral, M., Reisman, A., & Yolalan, R. (2003). A credit scoring approach for the commercial banking sector. Socio-Economic Planning Sciences, 37(2), 103–123. doi:10.1016/S0038-0121(02)00044-7
- Gündoğdu, A. (2015). Measurement of financial performance using TOPSIS method for foreign banks of established in Turkey between 2003–2013 years. International Journal of Business and Social Science, 6(1), 139–151.
- Heidary Dahooie, J., Beheshti Jazan Abadi, E., Vanaki, A. S., & Firoozfar, H. R. (2018). Competency‐based IT personnel selection using a hybrid SWARA and ARAS‐G methodology. Human Factors and Ergonomics in Manufacturing & Service Industries, 28(1), 5–16. doi:10.1002/hfm.20713
- Heidary Dahooie, J., Zavadskas, E. K., Abolhasani, M., Vanaki, A., & Turskis, Z. (2018). A novel approach for evaluation of projects using an interval-valued fuzzy additive ratio assessment (ARAS) method: A case study of oil and gas well drilling projects. Symmetry-Basel, 10(2) doi:10.3390/sym10020045
- Hua, C., & Lei, W. (2018). Effectiveness analysis of exoatmospheric interceptor using reachable set model. Proceedings of the Institution of Mechanical Engineers Part G-Journal of Aerospace Engineering, 232(7), 1304–1314. doi:10.1177/0954410017711724
- Hwang, C. L., & Yoon, K. (1981). Multiple attribute decision making: Methods and applications: A state of the art survey Berlin, New York: Springer-Verlag.
- Ic, Y. T. (2014). A TOPSIS based design of experiment approach to assess company ranking. Applied Mathematics and Computation, 227, 630–647. doi:10.1016/j.amc.2013.11.043
- Ignatius, J., Behzadian, M., Malekan, H. S., & Lalitha, D. (2012). Financial Performance of Iran’s Automotive Sector based on PROMETHEE II. IEEE, International Conference on Management of Innovation and Technology (ICMIT), Sanur Bali, Indonesia.
- Igoulalene, I., Benyoucef, L., & Tiwari, M. K. (2015). Novel fuzzy hybrid multi-criteria group decision making approaches for the strategic supplier selection problem. Expert Systems with Applications, 42(7), 3342–3356. doi:10.1016/j.eswa.2014.12.014
- Karimi, A., & Barati, M. (2018). Financial performance evaluation of companies listed in Tehran Stock Exchange. International Journal of Law and Management, 60(3), 885–900. doi:10.1108/IJLMA-12-2016-0145
- Keskin, G. A. (2015). Using integrated fuzzy DEMATEL and fuzzy C: Means algorithm for supplier evaluation and selection. International Journal of Production Research, 53(12), 3586–3602. doi:10.1080/00207543.2014.980461
- Lee, P. T. W., Lin, C. W., & Shin, S. H. (2012). A comparative study on financial positions of shipping companies in Taiwan and Korea using entropy and grey relation analysis. Expert Systems with Applications, 39(5), 5649–5657. doi:10.1016/j.eswa.2011.11.052
- Lee, P. T. W., Lin, C. W., & Shin, S. H. (2018). Financial performance evaluation of shipping companies using entropy and grey relation analysis Multi-Criteria Decision Making in Maritime Studies and Logistics (pp. 219–247). Cham: Springer.
- Li, W. (2014). Approaches to decision making with Interval-valued intuitionistic fuzzy information and their application to enterprise financial performance assessment. Journal of Intelligent & Fuzzy Systems, 27(1), 1–8. doi:10.3233/Ifs-130973
- Liao, C. N., Fu, Y. K., & Wu, L. C. (2015). Integrated Fahp, Aras-F and Msgp Methods for Green Supplier Evaluation and Selection. Technological and Economic Development of Economy, 22(5), 651–669. doi:10.3846/20294913.2015.1072750
- Ma, J., Fan, Z. P., & Huang, L. H. (1999). A subjective and objective integrated approach to determine attribute weights. European Journal of Operational Research, 112(2), 397–404. doi:10.1016/S0377-2217(98)00141-6
- MacCrimmon, K. R. (1968). Decisionmaking among multiple-attribute alternatives: A survey and consolidated approach (No. RM-4823-ARPA). Santa Monica, CA: RAND CORP.
- Moghimi, R., & Anvari, A. (2014). An integrated fuzzy MCDM approach and analysis to evaluate the financial performance of Iranian cement companies. The International Journal of Advanced Manufacturing Technology, 71(1–4), 685–698. doi:10.1007/s00170-013-5370-6
- Oner, S. C., & Oztaysi, B. (2018). An interval type 2 hesitant fuzzy MCDM approach and a fuzzy c means clustering for retailer clustering. Soft Computing, 22(15), 4971–4987. doi:10.1007/s00500-018-3191-0
- Pimentel, B. A., & de Souza, R. M. C. R. (2016). Multivariate Fuzzy C-means algorithms with weighting. Neurocomputing, 174, 946–965. doi:10.1016/j.neucom.2015.10.011
- Rostamzadeh, R., Esmaeili, A., Nia, A. S., Saparauskas, J., & Keshavarz Ghorabaee, M. (2017). A fuzzy ARAS method for supply chain management performance measurement in SMEs under uncertainty. Transformations in Business & Economics, 16(2a), 319–348.
- Safaei Ghadikolaei, A., Khalili Esbouei, S., & Antucheviciene, J. (2014). Applying fuzzy MCDM for financial performance evaluation of Iranian companies. Technological and Economic Development of Economy, 20(2), 274–291. doi:10.3846/20294913.2014.913274
- Saparauskas, J., Zavadskas, E. K., & Turskis, Z. (2011). Selection of facade's alternatives of commercial and public buildings based on multiple criteria. International Journal of Strategic Property Management, 15(2), 189–203. doi:10.3846/1648715X.2011.586532
- Shahsamandi E, P., Sadi-Nezhad, S., & Saghaei, A. (2017). Multi-objective complete fuzzy clustering approach. Intelligent Automation & Soft Computing, 23(2), 285–294. doi:10.1080/10798587.2016.1209322
- Shaverdi, M., Ramezani, I., Tahmasebi, R., & Rostamy, A. A. A. (2016). Combining fuzzy AHP and fuzzy TOPSIS with financial ratios to design a novel performance evaluation model. International Journal of Fuzzy Systems, 18(2), 248–262. doi:10.1007/s40815-016-0142-8
- Singh, R. K., & Benyoucef, L. (2013). A consensus based group decision making methodology for strategic selection problems of supply chain coordination. Engineering Applications of Artificial Intelligence, 26(1), 122–134. doi:10.1016/j.engappai.2012.03.013
- Sivilevicius, H., Daniunas, A., Zavadskas, E. K., Turskis, Z., & Susinskas, S. (2012). Experimental study on technological indicators of pile-columns at a construction site. Journal of Civil Engineering and Management, 18(4), 512–518. doi:10.3846/13923730.2012.709958
- Tamosaitiene, J., Zavadskas, E. K., Sileikaite, I., & Turskis, Z. (2017). A novel hybrid MCDM approach for complicated supply chain management problems in construction. Modern Building Materials, Structures and Techniques, 172, 1137–1145. doi:10.1016/j.proeng.2017.02.168
- Türksen, I. B. (2006). An ontological and epistemological perspective of fuzzy set theory. Amsterdam: Elsevier.
- Turskis, Z., Daniūnas, A., Zavadskas, E. K., & Medzvieckas, J. (2016). Multicriteria evaluation of building foundation alternatives. Computer-Aided Civil and Infrastructure Engineering, 31(9), 717–729. doi:10.1111/mice.12202
- Turskis, Z., Kersuliene, V., & Vinogradova, I. (2017). A new fuzzy hybrid multi-criteria decision-making approach to solve personnel assessment problems. Case Study: Directo Selection for Estates and Economy Office. Economic Computation and Economic Cybernetics Studies and Research, 51(3), 211–229.
- Turskis, Z., Morkunaite, Z., & Kutut, V. (2017). A hybrid multiple criteria evaluation method of ranking of cultural heritage structures for renovation projects. International Journal of Strategic Property Management, 21(3), 318–329. doi:10.3846/1648715X.2017.1325782
- Turskis, Z., & Zavadskas, E. K. (2010a). A new fuzzy additive ratio assessment method (Aras-F). Case study: The analysis of fuzzy multiple criteria in order to select the logistic centers location. Transport, 25(4), 423–432. doi:10.3846/transport.2010.52
- Turskis, Z., & Zavadskas, E. K. (2010b). A novel method for multiple criteria analysis: Grey additive ratio assessment (ARAS-G) method. Informatica, 21(4), 597–610.
- Wang, Y. J. (2014). The evaluation of financial performance for Taiwan container shipping companies by fuzzy TOPSIS. Applied Soft Computing, 22, 28–35. doi:10.1016/j.asoc.2014.03.021
- Wang, Y. J., & Lee, H. S. (2010). Evaluating financial performance of Taiwan container shipping companies by strength and weakness indices. International Journal of Computer Mathematics, 87(1), 38–52. doi:10.1080/00405000701489412
- Wang, Y. M., & Luo, Y. (2010). Integration of correlations with standard deviations for determining attribute weights in multiple attribute decision making. Mathematical and Computer Modelling, 51(1-2), 1–12. doi:10.1016/j.mcm.2009.07.016
- White, G. L., Sondh, A. C., & Fried, D. (2003). The analysis and use of financial statements. New Jersey: John Wiley & Sons.
- Wu, Z. B., & Chen, Y. H. (2007). The maximizing deviation method for group multiple attribute decision making under linguistic environment. Fuzzy Sets and Systems, 158(14), 1608–1617. doi:10.1016/j.fss.2007.01.013
- Xu, X. Z. (2004). A note on the subjective and objective integrated approach to determine attribute weights. European Journal of Operational Research, 156(2), 530–532. doi:10.1016/S0377-2217(03)00146-2
- Yalcin, N., Bayrakdaroglu, A., & Kahraman, C. (2012). Application of fuzzy multi-criteria decision making methods for financial performance evaluation of Turkish manufacturing industries. Expert Systems with Applications, 39(1), 350–364. doi:10.1016/j.eswa.2011.07.024
- Yang, M. S., & Nataliani, Y. (2017). Robust-learning fuzzy c-means clustering algorithm with unknown number of clusters. Pattern Recognition, 71, 45–59. doi:10.1016/j.patcog.2017.05.017
- Yurdakul, M., & Ic, Y. T. (2004). AHP approach in the credit evaluation of the manufacturing firms in Turkey. International Journal of Production Economics, 88(3), 269–289. doi:10.1016/S0925-5273(03)00189-0
- Zavadskas, E. K., & Turskis, Z. (2010). A new additive ratio assessment (ARAS) method in multicriteria decisionmaking. Technological and Economic Development of Economy, 16(2), 159–172. doi:10.3846/tede.2010.10
- Zavadskas, E. K., Turskis, Z., & Bagocius, V. (2015). Multi-criteria selection of a deep-water port in the Eastern Baltic Sea. Applied Soft Computing, 26, 180–192. doi:10.1016/j.asoc.2014.09.019