
 ?Mathematical formulae have been encoded as MathML and are displayed in this HTML version using MathJax in order to improve their display. Uncheck the box to turn MathJax off. This feature requires Javascript. Click on a formula to zoom.
Abstract
The subject of this article is customer satisfaction, loyalty, knowledge and business competitiveness from the perspective of a food-industry customer. This article aims to analyse the relationship between customer satisfaction, customer loyalty, product knowledge, business competitiveness and other selected factors which influence customer satisfaction. The research is aimed at customers who purchase the product in question repeatedly and have personal experience with this product. The research was carried out using a questionnaire which was presented to the respondents, who were customers of the selected companies. In order to model the relationships between the factors, a structural equation model approach was used. The research showed the direct influence of the product-knowledge variable on customer expectation and product competitiveness, as well as the influence of customer loyalty on product knowledge. Increased loyalty thus leads to the customer’s increased knowledge of the product. The rate of repeat purchase of the same product is important for the relationship between the variables. In this case, customer expectation was shown to be an important variable which is influenced by customer satisfaction. It can be concluded that when a product’s price is set correctly in relation to its quality, the price does not affect other research factors.
1. Introduction
Customer satisfaction, loyalty, product knowledge and competitive ability are variables which have been researched extensively across the globe. The relationships which tend to be researched the most are customer satisfaction and loyalty (e.g., Fornell, Johnson, Anderson, Cha, & Bryant, Citation1996; Türkyilmaz & Özkan, Citation2007). Over time these two variables have been supplemented by business competitiveness (El-Diraby, Costa, & Singh, Citation2006), and more recently, comprehensive knowledge (of the customer) (Aghamirian, Dorr, & Aghamirian, Citation2015).
However, the research presented above mainly looks at the service sector and certain sectors of the manufacturing and construction industries. The authors are not aware of any research which has been conducted within the food industry. The authors are also unaware of any such research having been carried out in the Czech Republic. Therefore, one of the aims of this paper is to fill the gap in identifying the connections between the specified variables in the food industry in the Czech Republic.
Another distinguishing feature of the research is the focus on the repeat purchase of a product, where one of the main requirements of the research was the customer’s personal experience with a product which was purchased on more than one occasion. As a result, it was possible to examine the interaction between the specified variables in a different (new) context from most other studies which look at the same issue.
Therefore, the subject of this paper is customer satisfaction, loyalty, knowledge and business competitiveness from the perspective of a food-industry customer. This article aims to analyse the relationship between customer satisfaction, customer loyalty, product knowledge, business competitiveness and other selected factors which influence customer satisfaction. The factors we examined were selected and then defined on the basis of previous studies which are discussed in the Theoretical Framework section.
2. Theoretical framework
This section defines the different variables in order to show what is appropriate and possible to measure. This definition will provide the basis for the questionnaire from which will emerge the individual factors of satisfaction, which will then be analysed. Customer expectation plays an important role in a customer’s assessment of food (Cardello, Citation1995). Research has confirmed that the various expectations mentioned above affect the assessment of the quality of food products (see Cardello & Sawyer, Citation1992; Olson & Dover, Citation1976; Tuorila, Cardello, & Lesher, Citation1994). Customer expectation (expected quality) is closely related to the perceived quality of the product (see below). The customer expects quality (in relation to food) in sensory terms (taste, sight, touch – relating to texture), in terms of health (nutritional and microbiological quality), in terms of convenience,1 and in terms of the process (ecological/organic, natural production, animal welfare, genetically modified crops, etc.) (Brunsø, Fjord, & Grunert, Citation2002; the same perception of quality used in the model by Grunert, Citation2005, and by Ophuis & Van Trijp, Citation1995).
Perceived quality can be defined as the customer’s perception of the overall quality or superiority of a product or service in terms of its intended purpose relative to the alternatives (Aaker, Citation1991). The perceived quality (consumers’ overall quality evaluation) is both the result of the expected quality and the experienced quality (Poulsen, Juhl, Kristensen, Bech, & Engelund, Citation1996). Food quality is understood as good nutritional, microbiological and textural quality (Cardello, Citation1995). At the same time, textural quality contains the mechanical, geometric and surface qualities of the product, perceptible through mechanical, tactile, visual and auditory receptors. Quality defined in such a way can also be considered as sensory (see Cardello, Citation1995). However, the perception of a product’s quality cannot be restricted to sensory attributes, and has to be expanded using safety, utility and costs, etc. (Cardello, Citation1995). A similar view, albeit with differently structured characteristics, is also given by Ophuis and Van Trijp (Citation1995).
Customer perceived value can be defined as the result of the personal comparison between perceived overall benefits and perceived sacrifices or costs paid by the customer (Zeithaml, Citation1988). The customer’s perceived value represents an overall mental evaluation of particular goods or services (Yang & Peterson, Citation2004). The research shows that perceived customer value can be measured as the ratio of price and quality, i.e., that there can be a trade-off between quality and price (a certain level of quality can be linked to a specific cost). It was also discovered that if a customer sees the value of a product as high, then there is also the relatively high probability that they will actually buy the product (Monroe, Citation2002; Zeithaml, Citation1988).
Due to the shortcomings in a unidimensional approach to perceived value (see Woodruff & Gardial, Citation1996), it is necessary to choose a multidimensional approach when examining customer perceived value. The construct then reflects the customer’s functional, economic, emotional and social value perceptions (Floh, Zauner, Koller, & Rusch, Citation2014). This research was focused on two dimensions: (1) functional and economic value perception: price/value for money – the utility derived from the product due to the reduction of its perceived short-term and long-term economic value; and (2) performance/quality – the utility derived from the perceived quality and expected performance of the product, its own functional value (Sweeney & Soutar, Citation2001).
Customer satisfaction has a very strong influence on the competitiveness of the product and, therefore, on the company, so it is also necessary to examine customer satisfaction within the context of competitiveness. “Customer satisfaction with a company’s products or services is often seen as the key to a company’s success and long-term competitiveness” (Hennig-Thurau & Klee, Citation1997). When identifying the variables which can measure the competitiveness of the company, it is possible to start from the consumer buying-decision model (Dubrovski, Citation2001). This model demonstrates that customer satisfaction depends on whether the customer actually bought the product, as the customer purchases the product by comparing the values of different (competing) products (Dubrovski, Citation2001).
Customer satisfaction is also based on customer knowledge, specifically the knowledge from the customer (Aghamirian et al., Citation2015). “The knowledge from the customer is about products, suppliers and markets” (Aghamirian et al., Citation2015) and “customer trends and future needs, and ideas for product innovation” (Desouza & Awazu, Citation2005). For the requirements of this research it was narrowed down to knowledge about products (product knowledge), i.e., it surveyed how well the respondents actually knew the product.
“The literature identifies two types of satisfactions: transactional and overall (or cumulative) satisfaction” (Spiteri & Dion, Citation2004). Transactional customer satisfaction can be defined as evaluating a specific purchase after its implementation (see Hunt, Citation1977; Oliver, Citation1980, Citation1993). Transactional satisfaction is short-term, is based on the evaluation of one purchase, is narrowly focused on the purchased product and is subjective within the aforementioned definition of customer satisfaction. It also applies to new customers who, however, focus on different attributes compared with customers with repeated experience of a product (Wangenheim, Citation2003).
Conversely, cumulative customer satisfaction can be defined as the overall experience with a purchase, known as general satisfaction (see Fornell, Citation1992; Johnson & Fornell, Citation1991). Cumulative satisfaction can be understood as long-term and is based on repeated purchase and on the customer’s overall experience with a product, including an evaluation of the selling or providing parties ( i.e., not only the producer but also the seller). Therefore, this definition of customer satisfaction is wider and falls within the definition of satisfaction as it was understand in this research.
Customer loyalty is defined by Oliver (Citation1997) as the willingness of consumers to buy a product from the same producer regardless of outside factors (e.g., marketing) which could lead the consumer to a change in product (producer) (Li, Green, Farazmand, & Grodzki, Citation2012). More specifically, consumer loyalty can be defined as attitude and behaviour (Rai & Medha, Citation2013). Customer loyalty can be understood as a two-dimensional variable, which can be researched as each dimension separately or as both dimensions together (see Kwong & Candinegara, Citation2014). This research focused on the behavioural dimension. Behavioural loyalty is measured by three variables: repurchase intentions, switching intentions and exclusive intentions (Jones & Taylor, Citation2007).
3. Material and methods
The research used a questionnaire which was presented to the respondents – customers of the selected companies. The questionnaire contained twenty-eight scaled questions, from which twenty-four were finally used in the research. The specific questions, including the variables used, are shown in in the appendix.
Research often uses five- or seven-point scales (Cadotte, Woodruff, & Jenkins, Citation1987; Churchill & Surprenant, Citation1982), but 10-point scales are also used (Oliver Citation1997; Oliver, Rust, & Varki, Citation1997; Söderlund, Citation2006). Research has shown that correlation strength is connected to the width of the scale in the sense that a wider scale strengthens the discovered correlation (Frennea & Mittal, Citation2017). A wider scale thus enables the detection of the connections between variables which would not be shown in a narrower scale, and is, therefore, much more useful for the research objectives. As a result, it can be considered that the 10-point multi-item scale is acceptable and suitable for this research.
All of the questions were designed as scale variables measured on a ten-point scale, where a value of 1 meant a low rating from the respondent, i.e., low satisfaction, while a value of 10 indicated a high rating from the respondent, i.e., very satisfied. Thus, with the increasing integer value from one to ten for each variable, the measure of satisfaction is increasing. As all of the questions were constructed in the same direction (so that a higher value always meant a better assessment of the company), the interpretation of the results of the statistical analysis is then straightforward.
With regard to the focus of the research, the sample of customers only included those respondents who had experience with the product, and therefore were able to evaluate the product. The respondents who were evaluating the individual projects represented the adult population of the Czech Republic according to the structure of the Czech Republic’s population based on age, sex and region as described in data from the Statistical Office. Each respondent assessed only one product. The assignment of the products to be assessed by the individual respondents was carried out randomly so that each product was assessed by 15 respondents and the respondent was familiar with the product.
Firstly, twenty randomly generated products were shown to the respondent. This random generation was weighted with respect to the number of previous respondents assessing the product and the number of previous respondents who were familiar with the product. (For example, if ʽxʼ% of the previous respondents were familiar with the product and ʽyʼ respondents had already assessed the product, then the weight for this product was {(15 − y) ÷ x} for the generation of the 20 items displayed.
If the respondent did not know any of the products from the twenty displayed, another twenty products were generated with analogically recalculated weightings. If they knew at least one of the twenty products, then from these twenty ʽwell-knownʼ products, one product was randomly generated to be assessed separately. This randomly generated one was then weighted again to prioritise those products which had been assessed by an insufficient number of respondents (<15).
The products were presented to the respondents along with their photographs and the manufacturer’s logo. All of the weightings used were dynamically updated over time. The respondents were representative of the adult population of the Czech Republic based on the structure of the Czech population by age, sex and region, according to the Czech Statistical Office in 2016.
The answers from these fifteen respondents who rated the same product were then averaged and this average evaluation for the product represented the products for the corresponding businesses for all of the questionnaire questions.
Along with the questionnaire for the customers of the businesses under investigation, constructs were formed representing the six directly unobservable factors of satisfaction described in the introductory section. Added to these latent factors (constructs) was the variable of product knowledge, which is directly observable from the questionnaire data ( i.e., it is not an artificial construct). The latent factors of customer satisfaction were measured using manifest variables – the questions from the questionnaire.
In order to model the relationships between the factors under examination, a structural equation model (SEM) was used. Firstly, a CFA (confirmatory factor analysis) was used to estimate the factor loadings of the individual manifest variables (the questions from the questionnaire) associated with the six factors relating to customer satisfaction, loyalty and business competitiveness. In other words, this stage (the measurement part) examined the extent to which the questionnaire adequately represented the latent factors of satisfaction. The next phase (the structural part) examined whether the hypothetical network of relationships between factors, which is described further in the section Model Construction, was consistent with the data from the questionnaire.
Due to the complex nature of structural equation models, there is no ʽoverallʼ test that would unambiguously confirm or refute the accuracy of the model (for example, on the basis of a single p-value). Instead, various indices are recommended, the value of which shows whether the hypothetical model of the relationships is in accordance with the data observed. Examples of such indices are the CFI (comparative fit index), or the TLI (Tucker-Lewis index); both indices take values from an interval of (0, 1), where a higher value means a ʽbetter modelʼ. The recommended threshold for both indices is 0.9. Therefore, those models with indices which are greater than 0.9 may be considered as empirically validated.
The research was carried out on a sample of 1530 customers of food-industry companies from the Czech Republic in spring 2016. The sample of businesses from the food industry numbered 102 firms. Specifically, these were companies which manufacture food and beverage products for everyday consumption (and which are well known among consumers). Each company was represented by one product. The criterion for the selection of companies – which numbered 4255 in this sector according to the Albertina database – was the availability of a balance sheet, and a profit and loss statement (which is important for further research); a requirement fulfilled by 212 enterprises.
4. Model construction
Regarding the relationship between the factors, it was decided to take a slightly different approach than usual. When creating a model or index of customer satisfaction, researchers usually look for (and find) factors that affect customer satisfaction and consequently loyalty (see e.g., Fornell et al., Citation1996; Türkyilmaz & Özkan, Citation2007) and competitiveness (Aghamirian et al., Citation2015). Although we used variables similar to those authors, it was decided to first of all divide the factors into two groups, where the factors in one group can be labelled as causes, i.e., explanatory variables (perceived quality = PQ; perceived value = PV; customer satisfaction = CS; product knowledge = PK) and the second group of factors as consequences, i.e., the response variable (customer expectation = CE; customer loyalty = CL; competitiveness = C). This division is considered to be appropriate for investigating general customer satisfaction, where there is an examination of overall customer satisfaction with the purchase of a product over the long term, when the customer buys the product repeatedly. This leads to mutual interaction between the variables where the causes then become effects, and the effects become the causes, as suggested by Hsieh and Yuan (Citation2010). It is possible, therefore, to define three basic equations2 representing three hypotheses, and simultaneously form a model of the relationship between the variables pertaining to customer satisfaction:
In the first equation, customer expectation (CE) is affected by four factors: PQ, PV, CS, PK. The second and fourth questions in the questionnaire relating to customer expectation (CE2, CE4) show that, based on repeat purchase, the customer could create expectations that can then be compared to reality when making the next purchase. It can, therefore, be assumed that the values of perceived quality (PQ) and customer satisfaction (CS) should have an influence on customer expectation for further (repeat) purchases. The construction of questions relating to the CE factor show that at the time of the research, the expectation created (based on past purchases) could be influenced by factors PQ and CS. In the case of the customer satisfaction (CS) factor, satisfaction with the product and the customerʼs purchase are reflected in their future expectations, i.e., expectation fluctuates, based on changes in customer satisfaction. The greater the customer satisfaction, the higher the expectation. Similarly, the greater the perceived quality of the product, the higher the expectation of the customer. Perceived value (PV) is also constructed in a very similar manner, focusing on an evaluation of the relationship between the price and quality of the product and its components. This evaluation then helps to create expectation, or the level of the evaluation of this relationship is then projected onto customer expectation, and the higher the perceived value (and the lower the ratio of price versus quality), the higher the customer expectation. Repeated purchase is also reflected in product knowledge (PK) and its fluctuation, i.e., that this knowledge should influence customer expectation. The greater the customer’s product knowledge, the higher the customer’s expectation.
In the second of the structural equations, customer loyalty (CL) is again affected by the same four factors: PQ, PV, CS, PK. In accordance with the relationships confirmed by several studies, customer loyalty is dependent on its satisfaction (CS), which is further dependent on many factors (e.g., Fornell et al., Citation1996; Gronholdt, Martensen, & Kristensen, Citation2000; Türkyilmaz & Özkan, Citation2007 ). In this case, these other factors are perceived quality (PQ), price (PV) and product knowledge (PK). Unlike the other studies, it was decided to test the possibility that these variables had a direct impact on loyalty, while customer satisfaction acts as only one of the variables influencing loyalty (alongside the variables mentioned above). As part of the definition of customer loyalty mentioned in the Theoretical Framework, it can be assumed that customer loyalty will depend on the perceived quality and price of the product (this links directly to question CL 3 and 4 of the questionnaire). The direct dependence of customer loyalty (specifically behavioural intentions) on both variables has been empirically shown in several studies (Bei & Chiao, Citation2001; Cronin, Brady, & Hult, Citation2000). Questions CL 2 and 5 of the questionnaire then link indirectly to these variables, as they represent the prioritised causes (non-prioritised) or the recommended (non-recommended) product. The equation is also based on the hypothesis that in relation to repeat purchase, product knowledge and its fluctuation will influence customer loyalty, as is implied by the conceptual model of customer knowledge management (Aghamirian et al., Citation2015). It is not only the willingness to buy the product again (question CL3 of the questionnaire), but also to urge someone else to buy it (question CL5 of the questionnaire), or react to (better or worse) changes in the product price (question CL4 of the questionnaire).
The third equation is based on the hypothesis that competitiveness (C) is influenced by customer satisfaction (CS), which is based on the finding that over the long term, customer satisfaction might be of vital interest to a business’s competitiveness (see Hennig-Thurau & Klee, Citation1997). The strong influence of customer satisfaction on a business’s competitiveness, including the influence of product quality, and to a lesser degree, product price, has been shown in several studies from various sectors (see El-Diraby et al., Citation2006; Parobek, Loučanová, Kalamárová, Šupín, & Štofková, Citation2015).
This is why competitiveness is once more modelled by the factors PQ, PV, CS (as is the case for customer loyalty). Also, it can be assumed for repeated purchase that product knowledge (PK) will have a similar influence to customer expectation on the competitive ability of a product, i.e., with a growth in customer product knowledge, there will be a change (growth or decline) in the product’s competitive ability. This hypothesis is based on research by Aghaminian (Aghamirian et al., Citation2015), which showed that product knowledge is part of a company’s competitive advantage.
The entry model, consisting of three simultaneous regression equations, which models the factors CE, CL and C, was supplemented by the assumption that both the cause factors (PQ, PV, CS) and effect factors (CE, CL, C) can be mutually correlated.
5. Results and discussion
In accordance with the data, the entry model from the Model Construction part was gradually simplified, and the insignificant effects or correlations were removed from the entry model. Therefore, the final model only contained those factors and correlations which were statistically significant. On the other hand, the entry model was enhanced by a fourth equation which explained the product knowledge factor through the consumer loyalty factor.
The final simplified model, containing only significant predictors, is described using the following equations:
(1)
(1)
(2)
(2)
(3)
(3)
(4)
(4)
It is graphically represented in , from which it is also apparent that the correlation between the factors is statistically significant and has remained in the model. The estimations of the model parameters as well as the corresponding p-values of the individual factors are presented in . The index value of the CFI of final model is 0.907, the index value of the TLI is then 0.893. Thus the model can be accepted as empirically verified.
Figure 1. The mutual relationships of the individual factors examined. The curved double-sided arrows indicate correlations, the straight one-sided arrows indicate causal relationships. The unobserved factors are in circles, the observable variables are in the rectangle.
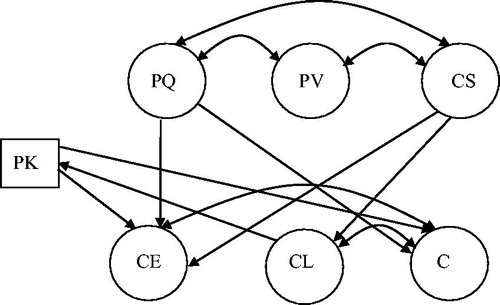
Table 1. Estimations of the model parameters (the factor/variable in italics is explained by the factors shown under them).
EquationEquation (1)(1)
(1) confirmed the relationship between customer expectation and satisfaction, product knowledge and the perceived quality of the product. The increase in customer expectation is due to the increase in customer satisfaction, perceived product quality and customer product knowledge (all of the estimated parameters: 1.110, 1.208, 2.358, have a positive sign). The model also shows that customer expectation negatively correlates with business competitiveness, which is inconsistent with the research by Yuan Hsieh, who identified a positive correlation (Hsieh & Yuan, Citation2010). The estimated correlation is, however, weak (−0.064), and is also not statistically significant (see in the appendix).
In the research, customer expectation is based on fulfilling demands and expectations (including comparisons with promises), and the level of product stability over time. Competitiveness emerges from a comparison with competitor brands, overall quality and marketing communication. It would appear that the relationship between customer expectation and competitive ability acts in the same manner as customer expectation and general satisfaction, where greater expectation leads to lower satisfaction (Matzler, Strobl, Thurner, & Füller, Citation2015). In our case, the higher the customer expectation towards a product, the lower its competitiveness.
There is no straightforward interpretation of this negative relationship. Our research analyses long-term (repeated) expectation and competitiveness, i.e., the development of expectation and competitiveness. Expectation cannot grow infinitely, which means that it will stop or stabilise at a certain moment. After that, customer expectation need not necessarily change.
Within the food industry, competitiveness is created by the large number of companies and how strongly they influence customers over time (through their products). It can, therefore, be assumed that at each moment the influence of this competition on a customer changes, i.e., the customer’s perception of the competition changes. From this it can be inferred that product competitiveness also changes as a result of customer perception, as the evaluation of the product need not alter – all that is required is for some of its competitors to change. At this point, customer expectation remains the same, but product competitiveness changes. Afterwards it may happen that during the same (constant) expectation, due to the change (fall) in the competitiveness of a product’s evaluation (due to the growth of the competitiveness of one or more of the competing products), the relationship between both variables will be negative. However, due to its statistical insignificance, this weak negative correlation only applies to the sample of industry companies under research.
EquationEquation (2)(2)
(2) confirmed the relationship between customer loyalty and satisfaction in the sense that customer loyalty is dependent on satisfaction, and increased satisfaction leads to increased loyalty (the estimated parameter of 2.88 is again positive). This result is consistent with other studies (see, e.g., Gronholdt et al., Citation2000) and is, therefore, not surprising. The model also shows that customer loyalty positively correlates with business competitiveness (a statistically significant correlation with an estimated correlation coefficient of 0.729) see in the appendix.
EquationEquation (3)(3)
(3) confirmed the positive relationship between business competitiveness, perceived product quality and product knowledge. The growth in business competitiveness is therefore directly dependent (both the estimated coefficients of 1.078, 1.628 have a positive sign) on the increase in perceived product quality, which corresponds with the results of the research by El-Diraby (El-Diraby et al., Citation2006) and on the increased product knowledge, which corresponds with the research results by Aghamirian (Aghamirian et al., Citation2015).
The last (fourth) equation was supplemented on the basis of MI (modification indices), which are part of the process of improving SEM models, provided they do not conflict with the current state of research (see Xu, Benbasat, & Cenfetelli, Citation2011). Here the equation is interesting as product knowledge depends on customer loyalty. Product knowledge influences customer expectation in the first equation and competitiveness in the third equation.
In addition to the above-mentioned significant parameters in the regression equations, other statistically significant correlations appeared (see in the appendix). The perceived value of the product (PV) positively correlates with customer satisfaction (CS) (a statistically significant correlation of 0.875) and the perceived product quality (PQ) (a statistically significant correlation of 0.791). At the same time, the perceived product quality (PQ) still positively correlates with customer satisfaction (CS) (a statistically significant correlation of 0.943).
The results showed that the design of the hypothetical model was essentially correct and the proposed causal relationships were empirically confirmed. When examining the factor of customer expectation, the influence of perceived quality, customer satisfaction and product knowledge was confirmed. It therefore appears that under the long term repeat purchase can also be observed as the opposite directions of relations to those identified in previous research. It is obvious that customer expectation for repeat purchase is based on the perceived quality of the product, which the customer is familiar with from the previous (first) purchase. At the same time, they were to some extent satisfied with the (previous) purchase, i.e., they assessed the level of their satisfaction. As with perceived quality, their satisfaction is then reflected in their expectation concerning the next product purchase. Repeat purchase is also closely linked to product knowledge. It can be inferred that product knowledge increases with the number of repeat purchases, which is then reflected in customer expectation, which grows in tandem with this knowledge.
One question is why perceived value does not have an influence on customer expectation. Authors of this paper believe that this is caused by the way in which the value is measured – the accuracy (subjectively from the view of the customer) of the ratio between costs (price) and product quality. If the price is accurately set in terms of customer satisfaction – the customer is satisfied with the set price – then this factor does not affect customer expectation. This hypothesis can be considered for repeat purchase, because if the customer was dissatisfied with the perceived value, then they would simply purchase another product. This is especially the case when bearing in mind, as Tomeš, Kvizda, Jandová, and Rederer (Citation2016) showed, that the Czech customer is generally quite sensitive to pricing. This is obviously the case with food and our research. Although the direct influence of perceived value was not shown on customer expectation, a relatively strong relationship was discovered between this value and perceived product quality and customer satisfaction (see in the appendix), which corresponds with previous research (see Herrmann, Xia, Monroe, & Huber, Citation2007; Voss, Parasuraman, & Grewal, Citation1998).
The estimated parameters of EquationEquation (2)(2)
(2) show that customer loyalty is dependent only on customer satisfaction, which does not fully correspond with the hypotheses presented in the Model Construction section. The dependency of customer loyalty, in this case specifically behavioural intentions, on perceived quality and product price was mainly shown for services. This demonstrates that customer loyalty in the case of products and services is influenced by different variables, and that the researchers conducting the relevant studies (including us), only agree on the fact that customer loyalty is directly influenced by their satisfaction (see Cronin et al., Citation2000; Türkyilmaz & Özkan, Citation2007). It also shows that it is dependent on the concept of customer loyalty, as differing concepts (in the sense of researching one dimension, two dimensions, two dimensions together or one dimension separately) lead to different results in the sense that customer loyalty is dependent on different variables.
It is interesting to note that a positive and relatively strong correlation was established between customer loyalty and business competitiveness (see in the appendix). This demonstrates that strengthening customer loyalty by increasing customer satisfaction correlates positively with business competitiveness. It is not yet known whether this correlation is causal or whether there exists in the background another variable influencing loyalty and competitiveness in the same direction.
The estimated parameters of EquationEquation (3)(3)
(3) did not confirm the statistically significant influence of customer satisfaction on business competitiveness, which does not correspond with the results of previous research (see El-Diraby et al., Citation2006; Hennig-Thurau & Klee, Citation1997; Parobek et al., Citation2015 ). On the other hand, it did confirm the influence of perceived quality on competitiveness, which corresponds with El-Diraby’s findings (see El-Diraby et al., Citation2006). It thus shows that perceived product quality is an important element in the creation or growth of business competitiveness. Another important element is product knowledge, with business competitiveness increasing in parallel.
The fourth equation is probably the most surprising result, where product knowledge is dependent on customer loyalty. One might at first have expected the opposite dependency where customer loyalty is dependent on product knowledge. When looking more closely at the questions used to investigate loyalty, we discovered the willingness to recommend the product (question CL5 of the questionnaire), how often a different product is bought compared to the one under consideration (question CL2 of the questionnaire), the willingness to swap the product under consideration for a similar but different product (question CL3 of the questionnaire) and the willingness to buy the same quantity of the product if the price was raised (question CL4 of the questionnaire).
It can be concluded that if a consumer recommends a product, arguments are used (technical, cost etc.) which led them to purchasing the product, and by recommending the product to someone else, they increase their own knowledge of the product. The same is true when thinking about changing the product (whether this was actually carried out or merely thought about), when the consumer compares the relevant parameters of the products under comparison, or when thinking about changing the quantity purchased due to a rise in price, where the consumer will likely focus on price and the price-quality ratio.
6. Conclusion
One of the contributions of this paper has been to demonstrate the direct influence of the product knowledge variable on customer satisfaction and business competitiveness, while this variable is also influenced by loyalty. This shows that in the long term it is necessary to take into account the level of the customer’s product knowledge and that this variable should not be overlooked, especially if a company wants to increase its competitiveness. The importance of this variable is underlined by the fact that it occurs in three of the four relationships identified.
The research showed the importance of the product knowledge variable, and the question arises of how management can increase customer’s product knowledge in order to increase a company’s competitiveness and customer expectation. In this regard, the marketing tool of sales support is proposed (tastings in the case of food products). Product tastings allow customers direct contact with the product, it provides a knowledge of all the product’s parameters, which increases product knowledge in comparison with the competition. Due to the fact that greater product knowledge also increases competitiveness and customer expectation, there is also the possibility to adjust prices accordingly. Higher customer expectation and greater competitiveness provide room for proportional price increases, which need not be perceived negatively by the customer in this case (see research results), and the company would not only have to pay the resultant costs, but also generate additional profit.
Regarding the relationship between loyalty and product knowledge, it is clear that it is in the management’s interest to inform its customers. It is common today for product information (contents, sell-by date, etc.) to be written in small print, with the result that the manufacturer is keeping this information secret (either inadvertently or deliberately). Research, however, suggests that a more informed customer might be more loyal to the product, leading to competitive advantages and profit. It would, therefore, benefit the manufacturer to provide more information about the product (contents, sell-by date, etc.), and not only on the packaging (where the print size should at least be increased, or graphic effects used), but also in their advertising materials (either their own or the seller’s).
Another contribution of the research is the discovery of specific links between the factors (relating to the previous research), from which it follows that the relationship between customer satisfaction, loyalty and competitive ability is (at least in the long term) complex, and certainly more complicated for the food industry in the Czech Republic than has been suggested by previous research.
One important finding from the research was the influence of perceived product quality (PQ) as a factor of customer satisfaction on competitiveness (C), as it is usually the relationship between general customer satisfaction and competitiveness which is examined (cf. Parobek et al., Citation2015). Our research shows that it is also important to examine the influence of specific (more minor) factors of customer satisfaction on product/company competitiveness. Another important finding from the research and this article is, therefore, the discovery of the influence of PQ on the competitive ability of a product/company, and not only by a specific factor but also by the direction of the influence, which differs from Dubrovski (Citation2001). An important addition to this finding is the influence of product knowledge (PK) on competitiveness (C), which has not yet been demonstrated or even researched. Therefore, the demonstration of the influence of PQ together with PK on C is another important finding in this area.
It is, therefore, clear that if a business from the food industry wants to improve its competitiveness, it has to increase the perceived quality of its product and knowledge of this product. Therefore, by using marketing tools it is possible to improve product knowledge in terms of its parameters so that the customer is not only completely familiar with the product but also with its parameters (parameters of quality) in order to correctly assess the product quality when making a purchase. This leads to the strengthening (increasing) of product and, therefore, company competitiveness.
In view of the fact that this relationship was discovered on the basis of repeat purchases, it is clear that it is possible to influence it repeatedly over a longer time period. On the one hand, therefore, it is possible to continually (permanently) improve awareness of a product and its parameters, and on the other hand, it is possible to improve the incorrect (undesired) perception of product quality.
This paper also shows the importance of the repeat purchase of a product in the relationship between these factors. This is why respondents with repeated experience with a product were given preferential treatment in the selected sample. It is in this context that customer expectation emerges as an important factor which is influenced by customer satisfaction, rather than vice versa.
It can be concluded from the research that when setting a price for a product in relation to its quality, the price does not have an impact on customer loyalty, competitiveness or even customer satisfaction, not even where customers are sensitive to pricing. However, it is necessary to emphasise that this is only the case for repeat purchases, where the customer already has personal experience with the relevant product.
The influence of customer loyalty on product knowledge is also interesting as it emerges that increased loyalty (in the sense of behavioural intentions) leads to increased customer product knowledge. Customer loyalty or behavioural intentions are also means by which the customer learns about the product and the company. It can be assumed that this information and knowledge is subsequently reflected in customer expectation and business competitiveness.
In conclusion, the theoretical importance of this article is in the division of a further two variables (competitiveness – C, and product knowledge – PK) into the concept (model) of customer satisfaction, thus expanding it. PK in particular is an important new variable in the customer-satisfaction model as none of the well-known models count it as an independent variable. At the same time, it is important to clarify the new relationships between the new and existing variables (see the EquationEquations (1)(1)
(1) , Equation(3)
(3)
(3) , and Equation(4)
(4)
(4) in Results and Discussion) in the context of repeat purchases, product manufacture (food industry) and indirect sales. In this regard, this is also a fresh look at the customer loyalty (CL) variable, which does not have to be merely a variable influencing customer satisfaction (or one of its factors) but can itself influence some of the factors of customer satisfaction. It also demonstrates that the relationship between customer loyalty and satisfaction is more complex.
From a practical perspective, it demonstrates the need to work with information with an emphasis on strengthening product knowledge, which has been shown to be essential for increasing product awareness, customer satisfaction, as well as the competitiveness of the product and the company. For companies in the food industry it is clear that this means the need for the use of marketing tools. It is also important to use these tools in a different way by stressing the customer’s correct knowledge of the product by informing the customer (repeatedly) about the product so that they understand and perceive (better and better) the qualities of the product and the utility which the product brings or could bring. On the other hand, if the company wants to be certain that the information they are providing (including the marketing) is being correctly understood, it is necessary to obtain customer feedback. The simplest method (naturally with limited effect) is to link feedback with, for example, a prize competition where the customer completes a short questionnaire before entering the competition (e.g., on the company website). One problem, however, is the limited impact, reliability and validity of the information acquired. More appropriate might be a tasting event at the company’s distributor (retail business), again linked with a questionnaire (a paper one) or a separate questionnaire study (in the same companies).
The research is limited by the fact that it only focuses on one sector (the food industry), which means that it is difficult to generalise the results for all sectors in the manufacturing industry and all production sectors. This limitation can provide us with subjects for further research. It would be useful for researchers to focus on other sectors within the manufacturing industry, while it would also be beneficial to the research if respondents focused on more than one product, ideally on products which have at least an 80% share of the companyʼs revenue. However, this will require a significant expansion in the number of respondents.
Disclosure statement
No potential conflict of interest was reported by the authors.
Additional information
Funding
Notes
1 Convenience = the saving of time, physical or mental energy at one or more stages of the overall process: planning and shopping, storage and preparation of products, consumption, and the cleaning up and disposal of leftovers (Gofton, Citation1995).
2 Function f corresponds to the linear regression function.
Related Research Data
References
- Aaker, D. A. (1991). Managing brand equity. New York, NY: The Free Press.
- Aghamirian, B., Dorr, B., & Aghamirian, B. (2015). Customer knowledge management application in gaining organization’s competitive advantage in electronic commerce. Journal of Theoretical and Applied Electronic Commerce Research, 10(1), 63–78. doi:10.4067/S0718-18762015000100006
- Bei, L. T., & Chiao, Y. C. (2001). An integrated model for the effects of perceived product, perceived service quality, and perceived price fairness on consumer satisfaction and loyalty. Journal of Consumer Satisfaction, Dissatisfaction and Complaining Behavior, 14, 125–140.
- Brunsø, K., Fjord, T. A., & Grunert, K. G. (2002). Consumers’ food choice and quality perception (MAPP Working Paper 77). Aarhus: Aarhus School of Business.
- Cadotte, E. R., Woodruff, R. B., & Jenkins, R. L. (1987). Expectations and norms in models of consumer satisfaction. Journal of Marketing Research, 24(3), 305–314. doi:10.1177/002224378702400307
- Cardello, A. V. (1995). Food quality: Relativity, context and consumer expectations. Food Quality and Preference, 6(3), 163–170. doi:10.1016/0950-3293(94)00039-X
- Cardello, A. V., & Sawyer, F. M. (1992). Effects of disconfirmed consumer expectations on food acceptability. Journal of Sensory Studies, 7(4), 253–277. doi:10.1111/j.1745-459X.1992.tb00194.x
- Churchill, G. A., Jr., & Surprenant, C. (1982). An investigation into the determinants of customer satisfaction. Journal of Marketing Research, 19(4), 491–504. doi:10.1177/002224378201900410
- Cronin, J. J., Brady, M. K., & Hult, G. T. M. (2000). Assessing the effects of quality, value, and customer satisfaction on consumer behavioral intentions in service environments. Journal of Retailing, 76(2), 193–218. doi:10.1016/S0022-4359(00)00028-2
- Desouza, K. C., & Awazu, Y. (2005). What do they know? Business Strategy Review, 16(1), 41–45. doi:10.1111/j.0955-6419.2005.00351.x
- Dubrovski, D. (2001). The role of customer satisfaction in achieving business excellence. Total Quality Management, 12(7-8), 920–925. doi:10.1080/09544120100000016
- El-Diraby, T. E., Costa, J., & Singh, S. (2006). How do contractors evaluate company competitiveness and market attractiveness? The case of Toronto contractors. Canadian Journal of Civil Engineering, 33(5), 596–608. doi:10.1139/l06-017
- Floh, A., Zauner, A., Koller, M., & Rusch, T. (2014). Customer segmentation using unobserved heterogeneity in the perceived-value–loyalty–intentions link. Journal of Business Research, 67(5), 974–982. doi:10.1016/j.jbusres.2013.08.003
- Fornell, C. (1992). A national customer satisfaction barometer: The Swedish experience. The Journal of Marketing, 56(1), 6–21. doi:10.1177/002224299205600103
- Fornell, C., Johnson, M. D., Anderson, E. W., Cha, J., & Bryant, B. E. (1996). The American customer satisfaction index: Nature, purpose, and findings. The Journal of Marketing, 60(4), 7–18. doi:10.2307/1251898
- Frennea, C., & Mittal, V. (2017). Customer satisfaction, loyalty behaviors, and firm-financial performance: What 30 years of research tells us (Working Paper). Houston, TX: Rice University. 59 p.
- Gofton, L. (1995). Dollar rich and time poor? Some problems in interpreting changing food habits. British Food Journal, 97(10), 11–16. doi:10.1108/00070709510104295
- Gronholdt, L., Martensen, A., & Kristensen, K. (2000). The relationship between customer satisfaction and loyalty: Cross-industry differences. Total Quality Management, 11(4-6), 509–514. doi:10.1080/09544120050007823
- Grunert, K. G. (2005). Food quality and safety: Consumer perception and demand. European Review of Agricultural Economics, 32(3), 369–391. doi:10.1093/eurrag/jbi011
- Hennig-Thurau, T., & Klee, A. (1997). The impact of customer satisfaction and relationship quality on customer retention: A critical reassessment and model development. Psychology and Marketing, 14, 737–764. doi:10.1002/(SICI)1520-6793(199712)14:8<737::AID-MAR2>3.3.CO;2-Z
- Herrmann, A., Xia, L., Monroe, K. B., & Huber, F. (2007). The influence of price fairness on customer satisfaction: An empirical test in the context of automobile purchases. Journal of Product & Brand Management, 16, 49–58. doi:10.1108/10610420710731151
- Hsieh, Y. H., & Yuan, S. T. (2010). Modeling service experience design processes with customer expectation management: A system dynamics perspective. Kybernetes, 39(7), 1128–1144. doi:10.1108/03684921011062746
- Hunt, H. K. (1977). CS/D-overview and future research directions. In H. K. Hunt (Ed.), Conceptualization and measurement of consumer satisfaction and dissatisfaction. Cambridge, MA: Marketing Science Institute.
- Johnson, M. D., & Fornell, C. (1991). Framework for comparing customer satisfaction across individuals and product categories. Journal of Economic Psychology, 12(2), 267–286. doi:10.1016/0167-4870(91)90016-M
- Jones, T., & Taylor, S. F. (2007). The conceptual domain of service loyalty: How many dimensions?. Journal of Services Marketing, 21(1), 36–51. doi:10.1108/08876040710726284
- Kwong, M. Z., & Candinegara, I. (2014). Relationship between brand experience, brand personality, consumer satisfaction, and consumer loyalty of DSSMF Brand. iBuss Management, 2, 89–98.
- Li, M. L., Green, R. D., Farazmand, F. A., & Grodzki, E. (2012). Customer loyalty: Influences on three types of retail stores’ shoppers. International Journal of Management and Marketing Research, 5, 1–19.
- Matzler, K., Strobl, A., Thurner, N., & Füller, J. (2015). Switching experience, customer satisfaction, and switching costs in the ICT industry. Journal of Service Management, 26(1), 117–136. doi:10.1108/JOSM-04-2014-0101
- Monroe, K. B. (2002). Pricing: Making profitable decisions (3rd ed.). New York, NY: McGraw-Hill Book Company.
- Oliver, R. L. (1980). A cognitive model of the antecedents and consequences of satisfaction decisions. Journal of Marketing Research, 17(4), 460–469. doi:10.1177/002224378001700405
- Oliver, R. L. (1993). A conceptual model of service quality and service satisfaction: Compatible goals, different concepts. Advances in Services Marketing and Management, 2, 65–85.
- Oliver, R. L. (1997). Satisfaction: A behavioral perspective on the consumer. New York, NY: Irwin-McGraw-Hill.
- Oliver, R. L., Rust, R. T., & Varki, S. (1997). Customer delight: Foundations, findings, and managerial insight. Journal of Retailing, 73(3), 311–336. doi:10.1016/S0022-4359(97)90021-X
- Olson, J. C., & Dover, P. (1976). Effects of expectation creation and disconfirmation on belief elements of cognitive structure. Advances in Consumer Research, 3, 168–175.
- Ophuis, P. A. O., & Van Trijp, H. C. (1995). Perceived quality: A market driven and consumer oriented approach. Food Quality and Preference, 6, 177–183. doi:10.1016/0950-3293(94)00028-T
- Parobek, J., Loučanová, E., Kalamárová, M., Šupín, M., & Štofková, K. R. (2015). Customer window quadrant as a tool for tracking customer satisfaction on the furniture market. Procedia Economics and Finance, 34, 493–499. doi:10.1016/S2212-5671(15)01659-7
- Poulsen, C. S., Juhl, H. J., Kristensen, K., Bech, A. C., & Engelund, E. (1996). Quality guidance and quality formation. Food Quality and Preference, 7(2), 127–155. doi:10.1016/0950-3293(95)00044-5
- Rai, A. K., & Medha, S. (2013). The antecedents of customer loyalty: An empirical investigation in life insurance context. Journal of Competitiveness, 5, 139–163.
- Söderlund, M. (2006). Measuring customer loyalty with multi-item scales: A case for caution. International Journal of Service Industry Management, 17(1), 76–98. doi:10.1108/09564230610651598
- Spiteri, J. M., & Dion, P. A. (2004). Customer value, overall satisfaction, end-user loyalty, and market performance in detail intensive industries. Industrial Marketing Management, 33(8), 675–687. doi:10.1016/j.indmarman.2004.03.005
- Sweeney, J. C., & Soutar, G. N. (2001). Consumer perceived value: The development of a multiple item scale. Journal of Retailing, 77(2), 203–220. doi:10.1016/S0022-4359(01)00041-0
- Tomeš, Z., Kvizda, M., Jandová, M., & Rederer, V. (2016). Open access passenger rail competition in the Czech Republic. Transport Policy, 47, 203–211. doi:10.1016/j.tranpol.2016.02.003
- Tuorila, H., Cardello, A. V., & Lesher, L. L. (1994). Antecedents and consequences of expectations related to fat-free and regular-fat foods. Appetite, 23(3), 247–263. doi:10.1006/appe.1994.1057
- Türkyilmaz, A., & Özkan, C. (2007). Development of a customer satisfaction index model: An application to the Turkish mobile phone sector. Industrial Management & Data Systems, 107, 672–687. doi:10.1108/02635570710750426
- Xu, J. D., Benbasat, I., & Cenfetelli, R. (2011). The effects of service and consumer product knowledge on online customer loyalty. Journal of the Association for Information Systems, 12(11), 741–766. doi:10.17705/1jais.00279
- Yang, Z., & Peterson, R. T. (2004). Customer perceived value, satisfaction, and loyalty: The role of switching costs. Psychology and Marketing, 21, 799–822. doi:10.1002/mar.20030
- Voss, G. B., Parasuraman, A., & Grewal, D. (1998). The roles of price, performance, and expectations in determining satisfaction in service exchanges. The Journal of Marketing, 62(4), 46–61. doi:10.1177/002224299806200404
- Wangenheim, F. (2003). Situational characteristics as moderators of the satisfaction-loyalty link: An investigation in a business-to-business context. Journal of Consumer Satisfaction Dissatisfaction and Complaining Behavior, 16, 145–156.
- Woodruff, R., & Gardial, S. F. (1996). Know your customer: New approaches to understanding customer value and satisfaction. Malden, MA: Blackwell.
- Zeithaml, V. A. (1988). Consumer perceptions of price, quality, and value: A means-end model and synthesis of evidence. Journal of Marketing, 52(3), 2–22. doi:10.1177/002224298805200302
Appendix
Table A1. The questionnaire questions (with the low rating and high rating shown in italics), according to the individual variables and factors.
Table A2. Estimations of model parameters: factor correlation in italics with factors shown below.