
 ?Mathematical formulae have been encoded as MathML and are displayed in this HTML version using MathJax in order to improve their display. Uncheck the box to turn MathJax off. This feature requires Javascript. Click on a formula to zoom.
Abstract
Acknowledging the importance of the bioeconomy as an important dimension of sustainable economic development, and particularly for E.U. strategies, this paper aims to identify and assess several bioeconomy modellers under the compelling effects of education and research–development–innovation activities. Within this frame of reference, the authors have assessed the role of intellectual capital in shaping bioeconomy outcomes, distinct for the new E.U.-13 and E.U.-15. A complex set of methods and macro-econometric models was applied on two balanced panels, compiled during 1995–2016, that bind random effects models with panel-corrected standard errors, spatial analysis and structural equation modelling. Overall, the importance of research, development, innovation and specific skills acquired in the field of bioeconomy is outlined, as key elements of E.U. economic strategies, being essential for all Member States.
1. Introduction
Bioeconomy represents a relatively new concept whose importance has been embodied in the last decade by its inclusion in sustainable development strategies at international and regional levels, such as the European Union (E.U.) area. The E.U. strategies were further transposed into national strategies of each Member State (M.S.), both the new E.U.-13 M.S. (mainly developing countries in Central and Eastern Europe, C.E.E.) and old E.U.-15 M.S. (developed countries), entailing their specificity in adopting the general framework. Within specialist and different organisations (national or international) the concept of bioeconomy has different approaches, but in a unanimously accepted form, bioeconomy is considered through its linkages with the environment, sustaining ecology and sustainable economic development by enhancing bioresources and application of biotechnology (Adamowicz, Citation2017; Bracco, Calicioglu, Gomez San Juan, & Flammini, Citation2018).
By projecting the future of the bioeconomy in 2030, the Organization for Economic Co-operation and Development (OECD, Citation2009) underlines the synergistic role that biotechnology and biomass production will have, along with knowledge of genes and complex cell processes. In the Europe 2020 strategy, two of the seven proposed initiatives also include a bioeconomy component, namely: (i) an ‘Innovation Union’ supporting the creation of the bioeconomy by 2020 through partnerships at all M.S. levels through the implementation of specific technologies; and (ii) ‘A resource-efficient Europe’, which takes into account the ‘shift to a low-carbon economy, to increase the use of renewable energy sources, modernize the transport sector and promote energy efficiency’ (European Commission, Citation2010, pp. 15–18).
In the European Strategy entitled ‘Innovating for Sustainable Growth: A Bioeconomy for Europe’, three directions are foreseen for the development of the bioeconomy, namely: (i) investment in research, innovation and skills in the bioeconomy; (ii) strengthening the interaction between political coordination and stakeholder involvement by setting up a ‘Panel and a Bioeconomy Observatory’ to bring together all stakeholders; and (iii) developing markets and promoting competitiveness in the bioeconomy (European Commission, Citation2012).
Thus, it can be said that the bioeconomy represents the enlargement of renewable energies and biomass production, extraction, transformation and consumption by encompassing natural resources (limited resources) and grasping knowledge transfer; moreover, bioeconomy heightens the implementation of biotechnology at a large scale within the economy, achieved by sustained innovation activities. This study acknowledges the important role of research, development, innovation and specific skills acquired in the field of bioeconomy, a role which is shaped also by the European strategies, notably through the Europe 2020 targets, differentiated across E.U. countries, especially for two groups: the new E.U.-13 countries and E.U.-15 (Marcu & Dobrota, Citation2016).
Given the bioeconomy’s importance in sustainable economic development around the world and its novelty in scientific research, the general objective of this paper is to examine several modellers of bioeconomy credentials within the E.U.-13 compared with the E.U.-15, under the compelling effects of education, research, development and innovation activities (intellectual capital factors). The general objective of the paper is designed on two benchmarks for each considered panel, emphasising the main discrepancies between E.U.-13 and E.U.-15: the first aim is to assess the implications of intellectual capital (educational attainment, R&D expenses, and innovation patents) upon most representative bioeconomy outcomes; the second aim is to evaluate the interlinkages among all these variables; the direct, indirect, and overall effects of intellectual capital on bioeconomy credentials. Since there is a high heterogeneity among M.S. at E.U.-28 level, in particular as regards the intellectual capital and knowledge implementation but also the different degrees of bioeconomy development, the authors compare the modelling results of the E.U.-13 with E.U.-15 (distinct panels). Moreover, in the new M.S. of E.U.-13 the bioeconomy concept is not widely applied, but represents a key driver for sustainable economic development. Thus, different from others, this study grasps a set of complex methods and models processed on two sub-panels compiled after splitting the E.U. territory in new E.U.-13 and E.U.-15 M.S., as an original way to analyse this issue.
In the empirical analysis the following variables were considered: (i) indicators of intellectual capital (educational attainment, research and development – R&D, innovation patents); (ii) representative outcomes for the bioeconomy sectors; and (iii) labour market and other specific variables. Various econometric procedures and techniques were applied for each considered group (E.U.-13 and E.U.-15, two balanced sub-panels compiled during 1995–2016), namely: (i) random effects (R.E.) and panel-corrected standard errors (P.C.S.E.) models, in order to assess the implications of intellectual capital upon bioeconomy outcomes – first research aim; (ii) spatial analysis models, spatial lag and error, also for supporting the first research aim; and (iii) structural equations modelling (S.E.M.), to evaluate the interlinkages between all these variables – the direct, indirect, and overall effects upon each bioeconomy variable.
After noting the importance and novelty of the bioeconomy processes within the framework of E.U. strategies, under the implications of the intellectual capital in the Introduction section, the paper is organised in three major parts. A summary of the main findings in the scientific literature focused mainly on E.U. countries is presented next. The data used and methodology applied are clearly described and further detailed. The final section comprises the results obtained for the E.U.-13 compared with the E.U.-15, followed by discussions, concluding remarks and policy implications.
2. Literature review
The bioeconomy concept has been amply addressed in the literature and has been the subject of several specialised papers, but the implications of intellectual capital on its perspectives at the macroeconomic level have been less considered, especially for the two distinctive groups of E.U. M.S., or even for the E.U. as a whole. Thus, the authors investigated the following directions: the main bioeconomy measurement approaches and the sectors included in the bioeconomy; the intellectual capital measurement for bioeconomy monitoring; and the macroeconomic implications of the intellectual capital upon bioeconomy dimensions.
At the worldwide level, and particularly within the E.U. M.S., bioeconomy presents characteristics that reflect the specificity of each country, both as measurement approach and regarding the sectors included. For bioeconomy measurement, some authors (Ahmed, Citation2018; Bracco et al., Citation2018; Pursula, Aho, Rönnlund, & Päällysaho, Citation2018) recommend those bioresources used in the production of extensive goods and services (in sectors such as agriculture, health, and industry) by applying biotechnology. Golebiewski (Citation2018, p. 32) also states that ‘bioeconomy encompasses production of renewable biological resources and transformation of these resources into value-added products’. Bracco et al. (Citation2018, p. 14) highlight that bioeconomy monitors both socio-economic (through intellectual features, education and training, R&D support, poverty dimension, food and energy resources, gender aspects) and environmental dimensions (through resources, energy and climate dimensions) under ‘progress in meeting the SDGs or environmental targets’. Based on these results, for assessing the most representative bioeconomy measurement in this research, the authors selected production, extraction, and transformation of bioresources, and their consumption.
Regarding the main sectors enclosed by bioeconomy in E.U. M.S., Ronzon, Santini, and M’Barek (Citation2015) have grouped them into four main categories, namely agriculture, agro-food and bio-chemicals industry, forestry and non-specialised bioeconomies. Thus, the C.E.E. countries are specialised on a distinctive sector of bioeconomy, such as agriculture (Romania, Poland, Slovenia and Croatia), forestry industry (Latvia and Estonia), or non-specialised sectors (Bulgaria, Hungary, Slovakia and the Czech Republic), while the developed E.U. M.S. focus mainly on the agro-food and bio-chemical industries. By analysing the bioeconomy in the 2030s horizon, the OECD (Citation2009) has forecasted that the major biotech markets in agriculture and industry will be in developing countries, amid rising incomes and population and through improving educational backgrounds, especially towards tertiary education. This idea was also underlined by Tondl and Vuksic (Citation2003), researching the role of human resources alongside foreign investment and geographic location upon economic growth within several C.E.E. countries (namely the Czech Republic, Slovakia, Hungary, Poland, and Slovenia). They proved that tertiary education has a significant role for biotechnology and innovation.
Implementation of the bioeconomy in Europe provides the prerequisites for new major implications in ‘education, training, and research’ (e.g., Bildirici & Özaksoy, Citation2018; Braha, Qineti, & Serenčéš, Citation2015; Zilberman, Gordon, Hochman, & Wesseler, Citation2018). Analysing the general changes in academia and food industry paradigms in order to meet the challenges of innovation, Saguy (Citation2011) highlighted several major changes that need to be made in this respect, such as removing the barriers between universities (tertiary education emphasis) and industry, and applying a revised model of intellectual improvement. The transition from manufacturing to knowledge-based technology innovation implies new skills acquired by the graduates of higher education, to be applied in the areas sustained by bioeconomy: agriculture, health and industry (with a focus on the chemical industry, energy, forestry, pharmaceutical, etc.) (European Commission, Citation2012; Fonseca et al., Citation2015; Urmetzer & Pyka, Citation2017). Only through partnerships developed among authorities, the business environment and universities, through the joint development of knowledge and skills, and by cross-border partnerships and exchanges between universities, can the medium- and long-term strategies be supported and achieved based on graduates in R&D and innovation activities, in key areas of bioeconomy (Pilvere, Nipers, & Mickiewicz, Citation2016). Regarding R&D support for bioeconomy sectors, C.E.E. countries, in general, invest in research to a smaller extent, although innovation is included as core of economic development in the long run in the strategies of these countries (Braha et al., Citation2015; Żółtaszek & Olejnik, Citation2017).
In terms of the variables used to measure the intellectual capital at national or regional level, there are numerous models in the literature established by international organisations or by individual researchers (e.g., Lin & Edvinsson, Citation2010). The implications of intellectual capital (mainly measured by R&D expenditure and patents) have been analysed mostly in relation to economic growth, and less so regarding the bioeconomy sector (e.g., Kacprzyk & Doryń, Citation2017).
As regards bioeconomy, intellectual capital dimensions are primarily focused on R&D support across various sectors, with implications of developing new products through invention and innovation (Ahmed, Citation2018; Anghel, Siminică, Cristea, Sichigea, & Noja, Citation2018). Besides education, training and financial support of R&D activities, Lu, Kweh, and Huang (Citation2014, p. 203) proved that ‘the most representative output indicator’ of the R&D resources is ‘the number of patents received’. Therefore, in this paper, to assess the intellectual capital factors that shape the bioeconomy, the following credentials are considered: educational attainment, R&D expenditures as share in Gross Domestic Product (G.D.P.) (as input indicators), and the number of patents received in the bioeconomy sector (as output indicator). One of the main shortcomings in the intellectual capital measures and comparison among countries is that of ‘different quality criteria and different regional-national statistical systems’ (Lin & Edvinsson, Citation2010, p. 12). For the analysis this paper considers the Eurostat database, which aligns and makes comparable the statistical data of all E.U. M.S.
Regarding the macroeconomic implications of the intellectual capital upon bioeconomy dimensions, the following findings are summarised: a few studies have focused on the regional level, particularly on E.U. M.S. (e.g., Nedelea, Mironiuc, Huian, Bîrsan, & Bedrule-Grigoruţă, 2018), which proved poor intellectual capital impact (measured by number of patents and R&D expenses) upon the bioeconomy (assessed by ecological and environmental dimensions) and economic growth, and the need for reforms and strategies in this context; a significant amount of work was dedicated to analyse this impact only at national level, for example, in Spain (Lainez, González, Aguilar, & Vela, Citation2018); a pervasive assertion of these implications was analysed by Pyka and Prettner (Citation2018), who advocated the prerequisite for an inclusive reorganisation of the whole economy for renewable resources production and consumption.
Therefore, by investigating the scientific literature, it can be stated that: the main dimensions for bioeconomy measurement are the extensive use of bioresources by biotechnology processes within a wide range of economic sectors, but especially in the fields of agriculture, health and industry; there are various approaches regarding the importance of the intellectual capital in this respect; there are many models that account different intellectual capital measures, but fewer within the bioeconomy framework; and little research has analysed the impact of intellectual capital upon bioeconomy sectors at the national or regional level (E.U.), particularly for the C.E.E. countries.
3. Data and methodology
To fulfil its general objective and specific aims, this study measures the implications of intellectual capital on bioeconomy by considering the following groups of indicators (data) separately for the new E.U.-13 and the old E.U.-15:
representative indicators of intellectual capital, mainly targeted by the Europe 2020 Strategy for each M.S., namely: tertiary education level 30–34 age group (%) (EDU_Tert); population with secondary, upper, post-secondary and tertiary education, measured as a percentage of the population aged 15–64 years (EDU); R&D expenditures (% of G.D.P.) (RD_exp); patents on recycling and secondary raw materials (number) (Patents_recy);
most representative indicators for the bioeconomy dimensions: primary biomass production and renewable energies (thousands tonnes of oil equivalent, T.O.E.) (Biorenew_P); gross inland consumption of biomass and renewable wastes (T.O.E.) (Biomass_C); transformation input of biomass and renewable wastes (T.O.E.) (Biomass_TI); and biomass domestic extraction (thousand tonnes) (Biomass_EXT);
labour market and other specific variables: the labour force stock (Labour); resource productivity, acknowledged as the indicator of resource efficiency by the Europe 2020 strategy (euro per kilogram, chain linked volumes 2010) (RES_Prod).
Because at national level there is no homogenous/unitary approach regarding bioeconomy variables, data were extracted from the Eurostat database (European Commission Citation2018) for the period 1995–2016. Two panels were set up: one panel for the E.U.-13 M.S. (new countries), having 286 observations; and another panel for the E.U.-15 M.S. (old countries), comprising 330 observations processed for each indicator (variable N in , and Appendices, ).
Table 1. Results of R.E. and P.C.S.E. Models, E.U.-13 and E.U.-15, 1995–2016.
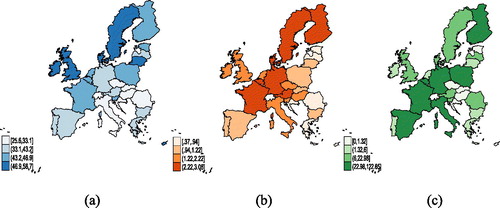
Regarding the main proxies of intellectual capital for 2016, in the E.U.-13 EDU_Tert registered a high share in only two countries, Lithuania and Cyprus, while in the E.U.-15 this was significant in Ireland, the U.K., Sweden, and Denmark (). The RD_exp registered important allocations only in the old E.U.-15 countries, namely the Nordic States (Sweden, Finland, and Denmark), Belgium, Austria, France and Germany (). The Patents_recy was sustained particularly in Poland, from the C.E.E. countries, and in several countries from the E.U.-15 (namely France, Germany, Spain, Italy, Belgium, and Finland) ().
Figure 1. Intellectual capital in 2016 in E.U.-28, namely EDU_Tert (a), RD_exp (b), and Patents_recy (c).
Source: Authors’ processing in Stata, based on Eurostat data.
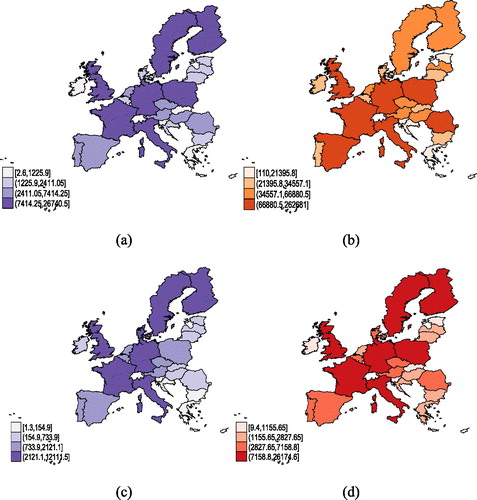
The main outcomes of bioeconomy for 2016 () reveal high contributions only for two countries from E.U.-13, namely Poland (for Biorenew_P and Biomass_C) and Romania (for Biomas_EXT), while for E.U.-15 there are important results in France, Germany, the U.K., and Italy (considering all bioeconomy variables), the Nordic States (for Biorenew_P, Biomass_TI and Biomass_C), and Spain (for Biomass_EXT).
Figure 2. The main bioeconomy indicators in 2016 within the E.U.-28, namely Biorenew_P (a), Biomass_EXT (b), Biomass_TI (c), and Biomass_C (d).
Source: Authors’ processing in Stata based on Eurostat data.
Thus, regarding the intellectual capital and bioeconomy results at the horizon of 2016, countries with important contributions from C.E.E. are Lithuania (tertiary educational attainment), Poland (innovation patents in bioeconomy, primary biomass production and renewable energies, biomass domestic extraction, and gross inland consumption of biomass and renewable wastes), and Romania (biomass domestic extraction).
For each corresponding aim of the paper, the authors propose to verify the following hypotheses (H):
H1. There are significant direct implications of intellectual capital factors (educational attainment, R&D expenses and innovation patents) upon bioeconomy dimensions – the first research aim;
H2. There are relevant interdependencies (direct, indirect, total) among the basic features of intellectual capital and their consequences upon bioeconomy credentials – the second research aim.
The research methodology consists of applying the following macro-econometric models for E.U.-13 and E.U.-15, distinctive for each aim: (1) Random Effects models (RE) completed by Panel-Corrected Standard Errors (P.C.S.E.) and spatial analysis (lag and error) models, developed to accomplish the first aim; and (2) Structural Equations Modelling (S.E.M.), developed and processed to analyse the second aim of this research.
The R.E. model describes the effect of each country included in the panel as an arbitrary extraction that is not correlated with the regressors, respectively, with residual variables or error, as shown in EquationEquation (1)(1)
(1) (Baum, Citation2001, p. 227).
(1)
(1)
where:
– the compound error term; ui – effects for each country included in the panel; i = 1, …, N; and t = 1, …, T; N – number of countries included in the panel; T – number of time periods.
The estimators of R.E. models (through the Generalised Least Squares – G.L.S. method) use the assumption that ui is not correlated with the model regressors, which is essential for identifying the coefficients β and δ.
The standard configuration of the RE model is described in EquationEquation (2)(2)
(2) .
(2)
(2)
where: BioEC comprises the fundamental indicators used to measure bioeconomy.
Relevant alternatives to attain unbiased estimators avoiding endogeneity are by applying multiple models (McKenzie & Sasin, Citation2007). In this regard, the authors have designed and processed the general model also through P.C.S.E. and spatial analysis (Spatial Lag and Spatial Error). P.C.S.E. was applied in line with other studies that have used mainly Monte Carlo experiments to assess the performances of panel data estimators (Moundigbaye, Rea, & Reed, Citation2018; Reed & Ye, Citation2011). Beck and Katz’s (Citation1995) attested that the P.C.S.E. estimator ‘is correct even when the error structures show complications’ (p. 634) and has the best performance irrespective of the degree of serial correlation of the errors and cross-sectional dependence (Moundigbaye et al., Citation2018). Furthermore, the reasons for applying spatial analysis reside in the need to capture the importance of location and spatial concentration in assessing bioeconomy outcomes across the E.U. under the compelling effects of intellectual capital. Theoretical and empirical foundations of such an endeavour are rooted in the neoclassical location theory, the new trade theory and the new economic geography (Krugman, Citation1991; Golebiewski, Citation2018). These fields of knowledge emphasise the importance of spatial organisation and distribution of economic activities and networks effects in enhancing the output of key industries. In terms of bioeconomy investigations, recent literature uses spatial econometric techniques to highlight developments in this area (Drejerska & Gołębiewski, Citation2017; Holloway, Lacombe, & LeSage, Citation2007). Therefore, the authors have processed two spatial models estimated through the maximum likelihood method (M.L.E.), with a general configuration described by EquationEquations (3a)(3a)
(3a) and Equation(3b)
(3b)
(3b) (Viton, Citation2010).
Spatial lag models:
(3a)
(3a)
Spatial error models:
(3b)
(3b)
where: W is the inverse distance weights matrix, y is the dependent (outcome) variable, X represents the explanatory (independent) variables, λ and ρ are scalars that measure the dependence of yi on nearby y and the spatial correlation in the errors, u represents the error term (spatially correlated residuals), ʋ captures independent and identically distributed disturbances.
The presence (or absence) of spatial autocorrelation is tested through Patrick Moran (Moran’s I) test by EquationEquation (4)(4)
(4) (Viton, Citation2010).
(4)
(4)
where: ωij are elements of the spatial weights matrix W (row standardised), R is the number of regions with associated neighbours (spatial units indexed by i and j), x is the variable of interest, and
is the mean of x.
In addition to these models, S.E.M. was further applied in order to include the direct, indirect and total interdependencies between the determinants of intellectual capital and each bioeconomy variable, and to complete the second aim. S.E.M. is an advanced multivariate analysis technique used to design, test, and forecast the causal relationships among selected variables.
First, to ensure an adequate comparability of data among countries and to discard the associated variations and differences, for S.E.M., the standardisation procedure was considered by developing a composite indicator (yi), according to EquationEquation (5)(5)
(5) (OECD, Citation2005).
(5)
(5)
where: xi is the gross value of the analysed indicator/variable; sd is standard deviation.
The general representation of S.E.M. models is shown in the equation system Equation(6)(6)
(6) .
(6)
(6)
where: t is the number of periods of time observed; bij is parameters of endogenous variables yij; cij is parameters of exogenous variables xij; i = 1, …, m; j = 1, …, n.
The developed S.E.M. model provides an integrated framework for analysing the implications of intellectual capital on bioeconomy credentials, from a dual perspective, namely the determinants–impact interactions.
4. Results and discussion
4.1. Results of R.E. and P.C.S.E. models
In compliance with the general objective of the paper, for the first aim, several macro-econometric models were first developed processed on the configuration of R.E. and P.C.S.E. models for each selected bioeconomy variable (, models 1–4). The R.E. estimator obtained through the G.L.S. method is efficient and provides a wider sphere of statistical and economic implications, because it captures the individual heterogeneity, since important differences across countries exist and induce a significant influence on the bioeconomy credentials (dependent variable). All R.E. models were processed in Stata with robust standard errors to account for heteroscedasticity, so as to obtain to obtain heteroscedasticity-robust standard errors (e.g., Huber/White or sandwich estimators). P.C.S.E. estimator ‘provides accurate standard error estimates with no or little loss in efficiency relative to FGLS’ (Beck & Katz, Citation1995, p. 645).
These models were processed separately for the E.U.-13 and E.U.-15 panels, allowing use of additional information about the panel units, a greater variability, low collinearity between variables, as well as several degrees of freedom, thus leading to an overall increased efficiency of the developed models. A series of specific tests were applied in order to ensure robust, efficient and unbiased estimators in the case of R.E. models (Appendices, for stationarity and for robustness check). Breusch–Pagan L.M. tests if the variances across entities are zero and the results obtained on both E.U.-13 and E.U.-15 samples highlight that there are significant differences across countries (panel effects), therefore a simple O.L.S. regression cannot be run. The authors further checked for cross-sectional dependence as a problem in macro panels with long time series (over 20 years in this case) that can lead to contemporaneous correlation by applying the Pesaran’s C.D. test. The results obtained show that there is no cross-sectional dependence for E.U.-13 and E.U.-15 panels. Furthermore, the authors tested for serial correlation through Wooldridge test for autocorrelation in the panel data, and the results find no serial correlation in the case of E.U.-15 and limited presence of first-order autocorrelation for the E.U.-13 sample.
The results obtained () outline the decisive importance of tertiary education in influencing the bioeconomy coordinates, especially at the E.U.-13 level. Thus, in case of the New E.U. M.S., an improvement in the educational level of the population aged 30–34 to tertiary education (EDU_Tert) induces beneficial effects upon bioeconomy coordinates, for both R.E. and P.C.S.E., significantly increasing domestic biomass extraction (Biomass_EXT) (model 4, the estimated coefficients are very significant at 0.1%), but also the primary biomass production and renewable energies (Biorenew_P) (model 1, the estimated coefficients have a very high level of statistical significance at the 0.1% threshold), and inland consumption of biomass and renewable wastes (Biomass_C) (model 2), and the transformation of these inputs (Biomass_TI) (model 3). On the other hand, in the case of E.U.-15, the impact of EDU_Tert is positive and significant for Biomass_TI, while for Biomass_EXT the estimated coefficients are inconsistent and different in sign for R.E. and P.C.S.E.
Innovation and increases in knowledge transfer in the field of recycling and secondary raw materials through registered patents (Patents_recy) produce positive effects on the E.U.-13 economies for all bioeconomy variables (models 1–4). Not least, the bioeconomy coordinates can be significantly and positively influenced by the countries’ financial support for stimulating R&D in these areas, expressed by the share of R&D expenditure in G.D.P. (RD_exp), both in the E.U.-13 (for production, consumption and biomass transformation, models 1–3), and especially at the E.U.-15 level (for all variables). The old E.U. M.S. (E.U.-15) also have the advantage of significant bioeconomy benefits under the impact of very high labour stock (Labour) (models 1–4) and resource productivity (RES_Prod), reflected by a significant increase in biomass production, consumption and transformation of biomass and renewable energy (models 1–3).
Based on these results, the first hypothesis – H1. There are significant direct implications of intellectual capital factors (educational attainment, R&D expenses and innovation patents) upon bioeconomy dimensions – is fulfilled, especially for EDU_Tert and Patents_recy at the level of the E.U.-13 panel, and RD_exp for E.U.-15.
4.2. Results of spatial analysis models
Further, in order to support the first aim of the paper, based on the literature, and to account for spatial interdependencies by identifying spatial spillovers effects, spatial analysis models, lag and error were developed for each bioeconomy variable.
All of these models () have ensured the accuracy and robustness of the results obtained. Therefore, the estimated coefficients are slightly different in size, but consistent in sign (they have not changed their sign throughout different estimation procedures, with very few exceptions) in the presence of statistical significance. Moran’s I shows positive global spatial autocorrelation in both samples, while positive and significant rho and lambda values entail positive autoregressive influence of the explanatory variables associated with the intellectual capital upon bioeconomy credentials.
Table 2. Results of spatial analysis models, E.U.-13 and E.U.-15, 1995–2016.
Thus, this paper presents new evidence to attest that tertiary education (EDU_Tert) is a major growth factor that leads to significant increases for all bioeconomy variables in E.U.-13 M.S., and less for E.U.-15 M.S. (different signs for Biomass_EXT). These results are in line with those obtained by Tondl and Vuksic (Citation2003) who proved that tertiary education has a significant role for biotechnology in C.E.E. countries. Moreover, in the case of E.U.-13, high performances achieved in terms of patents registration and innovation on recycling and secondary raw materials (Patents_recy) lead to significant increases for all bioeconomy credentials (models 1–4), while for E.U.-15 these are not statistically significant. On the other hand, in the case of E.U.-13, low performances achieved in terms of the share of R&D expenditure in G.D.P. (RD_exp) induce negative effects upon the Biomass_EXT (model 4), while for E.U.-15 an increasing in financial support of activity in this field positively reverberates upon all bioeconomy variables (models 1–4). However, as OECD (Citation2009) forecasted, the major biotech markets in 2030 will be the developing countries, since the prerequisites for innovation implementation in C.E.E. countries are ensured.
Another important factor with positive effects on some bioeconomy credentials for E.U.-13 is the resource productivity (RES_Prod), whose increase significantly improves the production, transformation and biomass consumption (models 1–3), while in case of Biomass_EXT the effect is opposite (model 4). Nevertheless, in the case of E.U.-15, the Biorenew_P and Biomass_EXT tend to register negative effects on E.U.-15 economies upon RES_Prod influence.
Based on these findings, the first hypothesis – H1. There are significant direct implications of intellectual capital factors (educational attainment, R&D expenses and innovation patents) upon bioeconomy dimensions – is re-attested and fulfilled, especially for EDU_Tert and Patents_recy at the level of the E.U.-13 panel, and RD_exp for E.U.-15, as R.E. and P.C.S.E. models previously proved.
4.3. Results of the S.E.M. models
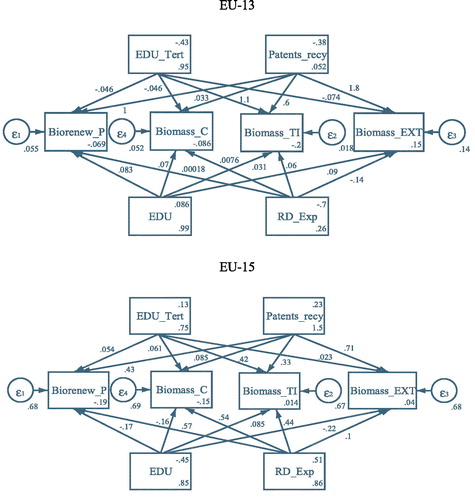
In order to fulfil the study’s second aim with associated H2 testing hypothesis, the empirical research was expanded through a two-way integrative approach that captures the modelling factors of the bioeconomy fundamentals through intellectual capital measures, within an integrative frame of analysis. The general S.E.M. model uses the standardised variables, and the results for the two panels, E.U.-13 and E.U.-15, are shown in .
Figure 3. S.E.M. models for bioeconomy and intellectual capital variables, E.U.-13 and E.U.-15, 1995–2016.
Source: own research in Stata.
In order to validate the results of the S.E.M. models (Appendices, ), a series of specific tests was applied, such as the Wald test for each equation, the good-fit tests (Likelihood ratio, Information criteria, Baseline comparison, Size of residuals), and the Alpha Cronbach per item and per total scale was also calculated. The results of Cronbach’s alpha (E.U.-13 overall = 0.8280 and E.U.-15 overall = 0.8540) reveal the reliability (internal consistency) of the scale, thus pointing to a high strength and consistency of the measures selected for the concepts. Wald tests results allowed rejection of the null hypothesis that the coefficients other than the intercepts are zero, for each equation. Akaike’s information criterion (A.I.C.) and Bayesian information criterion (B.I.C.) values are smaller in case of E.U.-13 models compared with E.U.-15; still, these criteria contain little information themselves and are generally used to compare across numerous models. The coefficient of determination is close to 1 in both model series (E.U.-13 = 0.866 and E.U.-15 = 0.813) and indicates a good fit for the whole model. However, the standardised root mean squared residual (S.R.M.R.) values, comparative fit index (C.F.I.) and Tucker–Lewis index (T.L.I.) suggest that there might be also some imperfections in the models deployed.
Within this new integrative framework, at the level of the new E.U.-13 M.S., the intellectual capital reflected by tertiary education (EDU_Tert) does not show the expected positive effects on all bioeconomy credentials, since it decreases Biorenew_P (the estimated coefficient is negative −0.0459 and very significant), leading downwards also in Biomass_EXT (the estimated coefficient is negative −0.074 and significant) and Biomass_C (the estimated coefficient is negative −0.0461 and significant). The only favourable impacts of EDU_Tert are on Biomass_TI (the estimated coefficient is positive 0.327 and very significant). The E.U.-13 M.S. are mainly labour-exporting countries with large emigration flows of highly skilled labour, with negative brain drain spillovers over their economies. Also, tertiary education in the E.U.-13 is not primarily oriented towards bioeconomy qualifications, by competences and skills formation, even though the importance of the bioeconomy is asserted in the national strategies of these countries. However, positive effects are accounted in this case under the impact of the R&D process and innovation (Patents_recy) and the increases in the population with total secondary, post-secondary and tertiary education (aged 15–64 years) (EDU), for all bioeconomy credentials. This result is opposite to that obtained by Nedelea et al. (Citation2018), which proved poor intellectual capital impact (measured by number of patents and R&D expenses) upon bioeconomy, for all E.U. M.S. In summary, overall, the interlinkages between the intellectual capital and each bioeconomy credential in E.U.-13 have generated favourable support with positive cascade effects only for the Biomass_EXT. That means tertiary education (the most unfavourable variable upon bioeconomy) needs to be reconsidered in line with the national and bioeconomy E.U. strategies, with specific and real interventions in competencies, skills formation and labour market integration within the bioeconomy sectors, as Fonseca et al. (Citation2015), Saguy (Citation2011), and Urmetzer and Pyka (Citation2017) also highlighted as major changes to be made for the development of a sustainable bioeconomy.
On the other hand, for the old E.U.-15 M.S., the intellectual capital and research–development–innovation process, reflected by tertiary education (EDU_Tert), decisively contributes to the increase of all biomass indicators, most significantly for Biomass_TI (the estimated coefficient is 0.0848, statistically significant at the 5% threshold). Even more, an increase in the number of patents (Patent_recy) generates positive and statistically very significant effects upon all biomass indicators, the most influential being for Biomass_EXT (coefficient is 0.712). From the point of view of the interlinkages generated by the intellectual capital upon the bioeconomy coordinates, a significant positive impact is shown for the Biomass_EXT and Biomass_TI (higher for biomass extraction), while the other considered bioeconomy coordinates would generate adverse effects (negative estimated coefficients) if proper strategies and policies in the direction of the bioeconomy were not implemented.
Thus, based on the S.E.M. model, the second hypothesis – H2: There are relevant interdependencies (direct, indirect, total) among the basic features of intellectual capital and their consequences upon bioeconomy credentials – is partially fulfilled.
5. Conclusions, qualitative and policy implications
This research has examined the importance of bioeconomy credentials for the new E.U.-13 M.S. (mainly C.E.E. countries) compared with the old E.U.-15 M.S., under the compelling influence of the intellectual capital. The assessment was based on several European strategies, namely: Europe 2020 (European Commission, Citation2010), and ‘Innovating for Sustainable Growth: A Bioeconomy for Europe’ (European Commission, Citation2012). These strategies are also acknowledged by O.E.C.D.’s policy, ‘The Bioeconomy to 2030: designing a policy agenda’ (OECD, Citation2009), which established solid guidelines both for developed countries and for developing ones. On this frame of reference, the importance of intellectual capital is greatly expressed, since biotechnology, as a main driver of bioeconomy, needs knowledge on research–development–innovation activities, and highly skilled people.
The general objective of this paper – assessing several models of bioeconomy credentials (biorenewable production, biomass transformation, extraction and consumption) within the E.U. under the compelling effects of intellectual capital factors – was analysed on two aims. The most relevant bioeconomy credentials (biorenewable production, biomass transformation, extraction and consumption) and intellectual capital variables (educational attainment, with focus on tertiary one, R&D expenses and innovation patents) were selected according to the supporting literature.
Thus, for the first aim, assessing the direct implications of intellectual capital upon bioeconomy outcomes for each considered panel, E.U.-13 and E.U.-15, it was proved that: there is a major importance of tertiary education in influencing the bioeconomy coordinates, especially for E.U.-13 economies; the financial support granted to encourage R&D (RD_exp) generates positive outcomes of bioeconomy, both in the E.U.-13 and, especially, in the E.U.-15 countries; the increase in the number of acknowledged patents (Patents_recy) by innovation and knowledge transfer in the field of recycling and secondary raw materials generates positive effects on the E.U.-13 economies, while on the E.U.-15 the effects are adverse (contrary to expectation).
The second aim related to the direct, indirect and total concerted influence of intellectual capital upon bioeconomy features by applying S.E.M.; the results showed important interlinkages among variables, both for new and old E.U. M.S. For the new E.U.-13 M.S., positive effects of the intellectual capital (Patents_recy and EDU) are generated upon the all bioeconomy variables, while tertiary education sustains only the transformation input of biomass and renewable wastes (Biomass_TI). Also, in case of E.U.-15, the intellectual capital (EDU_Tert, Patents_recy and RD_exp) plays a key role in promoting all bioeconomy variables in this integrative framework, while the population with total secondary, post-secondary and tertiary education (aged 15–64 years) (EDU) is relevant in sustaining the biomass transformation and renewable wastes (Biomass_TI).
Based on these findings, the interest for strong bioeconomy strategies is justified, in both E.U.-15 and, especially, in E.U.-13 countries, since ‘transition countries must encourage biomass energy consumption to enable sustainable economic growth and development’ (Bildirici & Özaksoy, Citation2018, p. 403). Therefore, for the E.U.-13 M.S., the policy implications shown by the models relate to the following directions: enhancing tertiary education skills and competences towards the main sectors of bioeconomy, specific for each country, by reorganising the curricula in line with the national and E.U. bioeconomy strategies; policy makers’ awareness for the necessity of higher allotment of R&D financing oriented to specific bioeconomy sectors; wide application of patents in the field of recycling and secondary raw materials; formation of a recycling culture in the population by specific policies and regulation, following the good practice model of the E.U.-15 developed countries.
In this regard, the specific financial schemes of the European structural funds for Research and Innovation (R&I) are the main support offered by policy makers at the European level, targeted for Smart Specialisation Strategies (RIS3), the European Fund for Strategic Investment (E.F.S.I.) and Horizon 2020 programme. However, considering ‘the maturity in the bioeconomy R&I’ at E.U. regions (Spatial Foresight et al., Citation2017, p. 48), the less developed E.U.-13 countries are marked with 1 to 4 points from 10, compared with the E.U.-15. Thus, these financial schemes need to be redesigned, further fostered and promoted by the policy makers, especially for the specific sectors of the bioeconomy (agriculture, agro-food and bio-chemicals industry, forestry and non-specialised bioeconomies).
In a nutshell, a further enhancement of the role of education, research and development and innovation is at the core of any set of measures adopted and implemented by policy makers, both nationally and at the European level. These results strengthen and support the idea that E.U. M.S. can apply their potential for innovations in the production, extraction, transformation and more efficient use of biomass and bio-based resources, to increase economic output and welfare for the public benefit (access to biotechnologies, employment, increased food security, nutrition and household income, biodiversity). Hence, an overall improvement in individuals’ health and wellbeing (quality of life) could be reinforced within an integrative strategic framework in the bioeconomy field, thus targeting sustainable development also in terms of environmental and social objectives.
A further development of the current research is considered in order to expand the analysis to distinctive sectors of bioeconomy, and to measure the impact of both intellectual capital and bioeconomy credentials upon economic and sustainable development, separately for E.U.-13 and E.U.-15.
Disclosure statement
No potential conflict of interest was reported by the authors.
References
- Adamowicz, M. (2017). Bio-economy as a concept of development strategies in the European Union. Journal of International Business Research and Marketing, 2(4), 7–12. doi:10.18775/jibrm.1849-8558.2015.24.3001
- Ahmed, E. M. (2018). Are bio-economy dimensions new stream of the knowledge economy? World Journal of Science, Technology and Sustainable Development, 15(2), 142–155. doi:10.1108/WJSTSD-06-2017-0014
- Anghel, I., Siminică, M., Cristea, M., Sichigea, M., & Noja, G. G. (2018). Intellectual capital and financial performance of biotech companies in the pharmaceutical industry. Amfiteatru Economic, 20(49), 631–646. doi:10.24818/EA/2018/49/631
- Baum, F. C. (2001). An introduction to modern econometrics using Stata. College Station, TX: Stata Press.
- Beck, N., & Katz, J. N. (1995). What to do (and not to do) with time series cross-section data. American Political Science Review, 89(3), 634–647. doi:10.2307/2082979
- Bildirici, M., & Özaksoy, F. (2018). An analysis of biomass consumption and economic growth in transition countries. Economic Research-Ekonomska Istraživanja, 31(1), 386–405. doi:10.1080/1331677X.2018.1427610
- Bracco, S., Calicioglu, O., Gomez San Juan, M., & Flammini, A. (2018). Assessing the contribution of bioeconomy to the total economy: A review of national frameworks. Sustainability, 10(6), 1698. doi:10.3390/su10061698
- Braha, K., Qineti, A., & Serenčéš, R. (2015). Innovation and economic growth: The case of Slovakia. Visegrad Journal on Bioeconomy and Sustainable Development, 4(1), 7–13. doi:10.1515/vjbsd-2015-0002
- Drejerska, N., & Gołębiewski, J. (2017). The role of Poland’s primary sector in the development of the country’s bioeconomy. Rivista di Economia Agraria/Italian Review of Agricultural Economics, 72(3), 311–326.
- European Commission. (2010). Europe 2020. A European strategy for smart, sustainable and inclusive growth (COM(2010) 2020). Brussels. Retrieved from https://ec.europa.eu/eu2020/pdf/COMPLET%20EN%20BARROSO%20%20%20007%20-%20Europe%202020%20-%20EN%20version.pdf or https://eur-lex.europa.eu/LexUriServ/LexUriServ.do?uri=COM:2010:2020:FIN:EN:PDF.
- European Commission. (2012). Innovating for sustainable growth: A bioeconomy for Europe. Brussels. Retrieved from https://ec.europa.eu/research/bioeconomy/pdf/official-strategy_en.pdf
- European Commission. (2018). Eurostat database. Retrieved from http://ec.europa.eu/eurostat
- Fonseca, S. C., Pinheiro, R., Barbosa, C., Araújo, A., Vaz-Velho, M., & Alves, R. (2015). Food innovation and entrepreneurship in higher education: A case study. International Journal of Food Studies, 4(2), 141–147.
- Golebiewski, J. (2018). Spatial concentration of bioeconomy sectors in Poland. Proceedings of the 2018 International Conference “Economic Science for Rural Development”, Jelgava, Latvia, LLU ESAF, 9-11 May 2018, Vol. 49, pp. 32–40. doi:10.22616/ESRD.2018.117
- Holloway, G., Lacombe, D., & LeSage, J. P. (2007). Spatial econometric issues for bio‐economic and land‐use modelling. Journal of Agricultural Economics, 58(3), 549–588. doi:10.1111/j.1477-9552.2007.00127.x
- Kacprzyk, A., & Doryń, W. (2017). Innovation and economic growth in old and new member states of the European Union. Economic Research-Ekonomska Istraživanja, 30(1), 1724–1742. doi:10.1080/1331677X.2017.1383176
- Krugman, P. (1991). Geography and trade. Cambridge, MA: MIT Press.
- Lainez, M., González, J. M., Aguilar, A., & Vela, C. (2018). Spanish strategy on bioeconomy: Towards a knowledge based sustainable innovation. New Biotechnology, 40(Part A), 87–95. doi:10.1016/j.nbt.2017.05.006
- Lin, C. Y. Y., & Edvinsson, L. (2010). National intellectual capital: A comparison of 40 countries. New York: Springer Science & Business Media. doi:10.1007/978-1-4614-5990-3
- Lu, W. M., Kweh, Q. L., & Huang, C. L. (2014). Intellectual capital and national innovation systems performance. Knowledge-Based Systems, 71, 201–210. doi:10.1016/j.knosys.2014.08.001
- Marcu, N., & Dobrota, C. E. (2016). The economic impact of the cohesion policy. Revista Economica, 68(3), 74–93.
- Moundigbaye, M., Rea, W., & Reed, R. (2018). Which panel data estimator should I use?: A corrigendum and extension. Economics: The Open-Access, Open-Assessment E-Journal, 12(2018-4), 1–31. http://dx.doi.org/10.5018/economics-ejournal.ja.2018-4.
- McKenzie, D., & Sasin, M. J. (2007). Migration, remittances, poverty, and human capital: Conceptual and empirical challenges (Policy Research Working Paper, No. 4272). Washington, DC: World Bank.
- Nedelea, A. M., Mironiuc, M., Huian, M. C., Bîrsan, M., & Bedrule-Grigoruță, M. V. (2018). Modeled interdependencies between intellectual capital, circular economy and economic growth in the context of bioeconomy. Amfiteatru Economic, 20(49), 616–630. doi:10.24818/EA/2018/49/616
- OECD. (2005). Handbook on constructing composite indicators: Methodology and user guide. Paris: OECD Publishing.
- OECD. (2009). The bioeconomy to 2030: Designing a policy agenda. Paris: OECD International Futures Programme.
- Pilvere, I., Nipers, A., & Mickiewicz, B. (2016, November). Bioeconomy development potential based on more efficient land use in the EU. Proceedings of the 7th International Scientific Conference Rural Development 2015: Towards the Transfer of Knowledge, Innovations and Social Progress. Aleksandras Stulginskis University, Lithuania, pp. 1–8. http://doi.org/10.15544/RD.2015.101.
- Pursula, T., Aho, M., Rönnlund, I., & Päällysaho, M. (2018). Environmental sustainability indicators for the bioeconomy. In W. Leal Filho, D. Pociovalisteanu, P. Borges de Brito, & I. Borges de Lima (Eds.), Towards a sustainable bioeconomy: Principles, challenges and perspectives (pp. 43–61). World Sustainability Series. Cham: Springer.
- Pyka, A., & Prettner, K. (2018). Economic growth, development, and innovation: The transformation towards a knowledge-based bioeconomy. In I. Lewandowski (Eds.), Bioeconomy (pp. 331–342). Cham: Springer.
- Reed, R., & Ye, H. (2011). Which panel data estimator should I use? Applied Economics, 43(8), 985–1000. doi:10.1080/00036840802600087
- Ronzon, T., Santini, F., & M’Barek, R. (2015). The bioeconomy in the European Union in numbers. Facts and figures on biomass, turnover and employment. Sevilla: European Commission, Joint Research Centre, Institute for Prospective Technological Studies.
- Saguy, I. S. (2011). Paradigm shifts in academia and the food industry required to meet innovation challenges. Trends in Food Science & Technology, 22(9), 467–475. https://doi.org/10.1016/j.tifs.2011.04.003.
- Spatial Foresight, SWECO, ÖIR, t33, Nordregio, Berman Group, & Infyde. (2017). Bioeconomy development in EU regions. Mapping of EU member states’/regions’ research and innovation plans & strategies for smart specialisation (RIS3) on bioeconomy for 2014-2020. Brussels: DG Research & Innovation, European Commission. Retrieved from https://ec.europa.eu/research/bioeconomy/pdf/publications/bioeconomy_development_in_eu_regions.pdf
- Tondl, G., & Vuksic, G. (2003). What makes regions in Eastern Europe catching up? The role of foreign investment, human resources and geography (ZEI Working Papers B 12-2003). Bonn: University of Bonn, ZEI - Center for European Integration Studies. Retrieved from https://www.econstor.eu/handle/10419/39510
- Urmetzer, S., & Pyka, A. (2017). Varieties of knowledge-based bioeconomies. In Dabbert S., Lewandowski I., Weiss J., & Pyka A. (Eds.), Knowledge-driven developments in the bioeconomy. economic complexity and evolution (pp. 57–82). Cham: Springer. https://doi.org/10.1007/978-3-319-58374-7_4.
- Viton, P. A. (2010). Notes on spatial econometric models. City and Regional Planning, 870, 1–23.
- Zilberman, D., Gordon, B., Hochman, G., & Wesseler, J. (2018). Economics of sustainable development and the bioeconomy. Applied Economic Perspectives and Policy, 40(1), 22–37. doi:10.1093/aepp/ppx051
- Żółtaszek, A., & Olejnik, A. (2017). Regional effectiveness of innovation–leaders and followers of the EU NUTS 0 and NUTS 2 regions (Lodz Economics Working Papers, No. 8). Lodz: University of Lodz, Faculty of Economics and Sociology.
Appendices
Table A1. Descriptive statistics, E.U.-13 and E.U.-15, 1995–2016.
Table A2a. Unit-root test (square root) for the residuals of models, E.U.-13 and E.U.-15, 1995–2016.
Table A2b. Robustness tests for RE models, E.U.-13 and E.U.-15, 1995–2016.
Table A3. S.E.M. results for Cronbach’s alpha, 1995–2016.
Table A4. Wald test for S.E.M. models, 1995–2016.
Table A5. Good-fit tests for S.E.M. models, 1995–2016.