
 ?Mathematical formulae have been encoded as MathML and are displayed in this HTML version using MathJax in order to improve their display. Uncheck the box to turn MathJax off. This feature requires Javascript. Click on a formula to zoom.
Abstract
This article illustrates, based on a case study, the steps that companies should follow in order to substantiate the compliance of their related party transactions with the arm’s length principle (as required by I.A.S. 24). The case study takes into consideration the provisions of the O.E.C.D. transfer pricing guidelines, and where the application was required of domestic legislation, we applied the Romanian one. We found that the most important step is represented by a comparability analysis between related party transactions and comparable market transactions. Further on, in relation to the comparability analysis, in practice two situations are met: the use of comparable entities’ information from the year under analysis and the use of this information from previous years. In this context we selected a sample of comparables and analysed if these two practical approaches impact the final conclusion regarding the compliance with the arm’s length principle. We found that there can be a small difference among the results obtained in the two situations. Mainly, the article presents important findings for professionals from the accounting and finance area in order to understand the mechanism of the arm’s length principle.
1. Introduction
Over time, as a consequence of the financial scandals in which big corporations (such as Arthur Andersen, Enron, Tyco, WorldCom, etc.) were involved, the related party transactions have begun to be considered, mainly by investors, as an instrument used by companies for opportunistic purposes (Wong & Jian, Citation2003). This is due to the fact that the transactions between related parties could not be carried out under the same terms and circumstances as the transactions performed between independent companies (Pozzoli & Venuti, Citation2014). Given this, the related party transactions ‘may distort financial statements leading to higher information asymmetry and a general erosion of investors’ confidence in the firm’ (Tong, Wang, & Xu, Citation2014, p. 5). In this context, special attention should be focused on the disclosure of this kind of transaction in financial reports (Huang & Liu, Citation2010). A disclosure of the related party transactions is necessary in order to allow the users of the financial statements to capture a full picture of an entity’s position and results of operations (Epstein & Jermakowicz, Citation2008).
At international level, guidelines regarding a proper disclosure of the related party transactions are provided by the International Accounting Standard 24 ‘Related Party Disclosures’ (i.e., I.A.S. 24). According to paragraph 23 of I.A.S. 24 companies should perform ‘disclosures that related party transactions were made on terms equivalent to those that prevail in arm’s length transactions, only if such terms can be substantiated’. Considering that the arm’s length transactions represent those transactions for which the prices were set at market level, not being established for opportunistic purposes (e.g., to move profits from one country to another), the disclosure required by I.A.S. 24 could represent a confirmation that the related party transactions do not distort the financial statements. Therefore, this kind of disclosure could have a significant impact on the increase of the investors’ confidence. But what should companies do in order to prove that their related party transactions comply with the arm’s length principle (i.e., were performed in terms equivalent to those from the arm’s length transactions)?
One of the objectives of this paper is to illustrate which are the steps that companies should follow in order to substantiate the arm’s length principle compliance of their related party transactions. More exactly, within this paper we present a case study which provides an example of related party transaction, showing and explaining each step which conducts to the final conclusion about the compliance or not of that transaction with the arm’s length principle. Trying to achieve this objective we found that one of the steps involves the preparation of a comparability analysis. Related to this analysis, we identified some issues which are strongly determined by the different internal regulations related to the deadlines for the documentation of the arm’s length principle adopted by the countries of the world. Mainly, we identified the following two situations:
Situation 1: due to these internal regulations, in order to perform the comparability analysis, there could not be used financial information from the year under analysis. For a good understanding of this situation, we provide the following examples:
Certain countries (e.g., Romania, Italy, Spain, etc.) require the documentation of the arm’s length principle of the related party transactions performed during a year until the term of the submission of the corporate income tax (C.I.T.) return for that year. Taking into account the following aspects:
○ the comparability analysis involves the comparison of the prices/margins/mark-ups used by a company in related party transactions with the prices/margins/mark-ups applied on the market within similar transactions between independent companies (which are not affiliated);
○ the margins/mark-ups of the independent companies are computed based on their financial statements which are transposed within specialised databases used for transfer pricing purposes;
○ the term for the submission of the financial statements is after the deadline for the submission of the CIT return,
It could be concluded that companies will deal with a lack of independent entities’ financial information for the year analysed. Given this, the approach adopted by these companies is to use the independent entities’ financial information from previous years. Practically there is performed a comparison between the profitability obtained by a company during a year, from a certain related party transaction, with an average profitability obtained by comparable independent entities during previous years (e.g., the profitability obtained in 2015 is compared with the average one obtained by comparable independent entities during 2012–2014).
Certain countries (e.g., Czech Republic, Bulgaria, Croatia, Germany, Estonia, etc.) do not require companies to document the arm’s length principle of the related party transactions until a fixed deadline, but only upon the request of the tax authorities. If during a tax audit the tax authorities request the documentation to be prepared until the submission of the financial statements, there will be the same situation described above.
Situation 2: there could be used financial information from the year under analysis. An exemplification of this situation is presented below:
Certain countries do not require companies to document the arm’s length principle of the related party transactions until a fixed deadline, but only upon the request of the tax authorities. If the tax authorities request the documentation to be prepared after the submission of the financial statements, there will not be a lack of financial information for independent entities for the year under analysis. In this case the comparison is performed between the profitability obtained by a company during a year, from a certain related party transaction, with an average profitability obtained by comparable independent entities during previous years, but also including the year under analysis (e.g., the profitability obtained in 2015 is compared with the average one obtained by comparable independent companies during 2013–2015).
However, an issue which could arise in this situation is represented by the fact that if companies do not document the compliance of the related party transactions with the arm’s length principle until the submission date of the financial statements, these companies are not able to disclose the statement mentioned within paragraph 23 of I.A.S. 24.
Summarising, there could be two practical approaches used by companies in order to substantiate the arm’s length principle: the use of financial information from previous years to the year in which the transaction was carried out or the use of financial information from previous years, but also including the year in which the related party transaction was performed. In this context, one research question that could arise is if these two different approaches lead to different conclusions regarding the compliance with the arm’s length principle or if these lead to the same conclusion. Therefore, the second and main objective of this paper was to find an answer to this question.
We were motivated to achieve the two objectives mentioned above due to the significant impact of the related party transactions on financial statements and also due to the novelty of the arm’s length principle as a research topic. The originality of the paper is represented by the illustration of the impact which the two practical approaches could have, determined by the situations presented above, on the conclusion regarding the compliance of the related party transactions with the arm’s length principle. We consider that the article could present important findings for the users of financial statements and for professionals from the accounting and finance area in order to understand the mechanism of the arm’s length principle, but also for the countries over the world in order to assess if the deadlines imposed for the documentation of the arm’s length principle have a significant impact on the analysis performed by companies. Given this, we consider that our study contributes to the arm’s length principle literature and at the same time could represent a starting point for future research.
2. Documentation of the arm’s length principle
According to the arm’s length principle, the price charged between related parties should be the price that would be paid by unrelated parties, for similar goods and in comparable circumstances (Choe & Matsushima, Citation2013). In order to prove the compliance of the related party transactions with the arm’s length principle, companies should perform a detailed analysis and prepare documentation in this respect. International guidelines related to this analysis are provided by O.E.C.D. within Transfer Pricing Guidelines for Multinational Enterprises and Tax Administrations (OECD, Citation2017). Most of the countries of the world have adopted the provisions of these guidelines in their domestic legislation.
Rossing, Cools, and Rohde (Citation2017) pointed out that the arm’s length principle ‘works on the basis of comparability’ between related party transactions and comparable market transactions. The authors noted that the O.E.C.D. transfer pricing guidelines outline four main steps related to the comparability analysis needed for the substantiation of the arm’s length price, as follows:
Step 1: identification of the related party transaction – here is provided an overview of the transaction;
Step 2: functional analysis – here are identified functions performed, risks incurred and assets used by each company involved in the transaction;
Step 3: identification of the appropriate transfer pricing method;
Step 4: performing of the comparability analysis.
All steps presented above should be followed in cascade because based on the first step is performed the functional analysis which influences the decision regarding the selection of the transfer pricing method. The functional analysis and the method selected determine how the comparability analysis will be performed. In the end, based on the comparability analysis is presented the conclusion regarding the compliance of the transactions with the arm’s length principle.
2.1. Functional analysis
The functional analysis represents an overview of the functions performed (i.e., key activities), risks incurred and assets used by each company (Devonshire-Ellis, Scott, & Woollard, Citation2011). Based on the functional analysis there are distinguished three main categories of companies: the manufacturers, the distributors and the services providers. Further on, each of these three categories is divided in subcategories, as follows (Herksen, Citation2009):
manufacturers: toll manufacturer, contract manufacturer, fully fledged manufacturer;
distributors: commission agent, commissionaire, classic buy-sell distributor, fully fledged distributor;
service providers: shared service centre, contract service provider, sophisticated service provider.
Within a related party transaction, the compensation should reflect the function performed, risks incurred and assets used by each company (Radolovic, Citation2012). For example, the profit obtained by a contract manufacturer should be greater than the profit obtained by a toll manufacturer, and the profit obtained by a fully-fledged manufacturer should be greater than that recorded by a contract manufacturer.
The functional analysis has a high impact on the following two steps, influencing both the selection of the transfer pricing method and the comparability analysis. This is due to the fact that before selecting a method and performing the comparability analysis there should be chosen one company of those participating in the related party transaction, which will be the tested party. According to the O.E.C.D. transfer pricing guidelines, the tested party ‘should be consistent with the functional analysis of the transaction’. The general rule is that the tested party should be that company which has the less complex functional analysis, as for this company can be found the most reliable comparables (OECD, Citation2017).
2.2. Transfer pricing methods
The O.E.C.D. transfer pricing guidelines present five transfer pricing methods that should be used in order to test the compliance of the arm’s length principle, as follows:
Comparable uncontrolled price (C.U.P.) method is based on the comparison of prices charged within a transaction performed between related parties with prices charged by independent companies performing a similar transaction, in comparable circumstances. This method cannot be applied if there are material differences between the two transactions (i.e., the related party transaction and the transaction carried out between independent companies) – for example, if the type of goods traded is not the same, the quantities traded are not comparable, the markets are not similar, etc. (Ondrušová, Citation2016).
Cost-plus method (C.P.M.) is used when the analysed transaction is represented by the production of goods or provision of services. Based on this method, the gross mark-up added by the manufacturer/service provider is compared to the costs incurred in order to produce those goods/provide the services (Matei & Pîrvu, Citation2011).
Resale price method (R.P.M.) is used when the analysed transaction is represented by the sale to independent companies of goods purchased from a related party (i.e., when the tested party is a distributor). Based on this method it is compared the gross margin applied by the distributor in order to sell the goods. It is considered that if the gross margin is at market level, them the price at which the goods were purchased from the related party is also at market level (Hughes & Nicholls, Citation2010; Jain, Citation2015).
Transactional net margin method (T.N.M.M.) operates in a similar manner to the C.P.M. and R.P.M., the difference being that within the T.N.M.M. are compared net margins/mark-ups, while within the other two methods are compared gross margins/mark-ups. T.N.M.M. is the most used method in practice due to the fact that companies deal with a lack of information regarding the expenses classified by destination, so that it is impossible to determine the gross mark-up/margin of similar independent companies (Luca, Citation2009).
Profit split method (P.S.M.) is applied when the related parties are involved in highly integrated activities or when the related parties bring unique/valuable contributions to the transaction – for example, use unique intangibles. In this situation, it would be appropriate to apply the P.S.M., as independent companies ‘could wish to share the profits in proportion to their respective contributions’ (Chand & Wagh, Citation2014, p. 403).
When applying the transfer pricing methods, the profitability indicators (i.e., the margins or the mark-ups) should be computed as a ratio between the operational result obtained from the analysed transaction and a certain base (i.e., costs, sales or assets). The base should be an indicator which is not affected by transactions with related parties (Luca, Citation2009). For example, in the case of a manufacturer, the sales are recorded in relation to a related party, while the costs are incurred in relation to independent suppliers. Given this, for a manufacturer, the net profitability indicator (i.e., the mark-up) should be computed as a ratio between the operational results and the operational costs related to the transaction analysed.
2.3. Comparability analysis
In order to perform the comparability analysis, at least one of the methods described above should be applied. In this respect there could be used internal or external comparables. The internal comparables can be used only if one of the companies involved in the related party transaction was also involved in similar transactions with independent companies. If this situation does not exist, then the external comparables should be used (OECD, Citation2017). In order to identify external comparables, there are used various specialised databases such as Amadeus, Orbis, TP Catalyst, etc. These databases contain information about various categories of companies. Information presented within the databases is that submitted by companies to the Trade Register.
To identify external comparables, there are used various criteria related to the geographic location, business activity (i.e., activity codes), independence status, availability of information, etc. (Cools, Citation1999). The search process of external comparables (known as the benchmark study) is performed until there is obtained a sufficient number of comparables (e.g., minimum of five according to the practice from Romania). If this number is not reached performing the search on the local market, the search should be extended on the E.U. market (Order no. 442, Citation2016). In the end, the comparable companies should have a similar functional profile with that of the tested party, performing comparable transactions with that tested.
In order to determine if a transaction is compliant with the arm’s length principle, a comparison between the profitability indicator obtained by the tested party from that transaction and the profitability indicator registered by the comparable companies identified should be performed. O.E.C.D. transfer pricing guidelines recommend computation of the profitability of each comparable company as a multiple year average. In this respect, there should be used the last years for which the financial information is available. The justification of the multiple year average is that to neutralise the negative influences from change in economic conditions, short-term foreign exchange fluctuations, seasonal work, frequent law alterations, etc. and make economic conditions for different companies as equal as possible (Dessatniuk & Cherevko, Citation2015). According to Dessatniuk and Cherevko (Citation2015), transfer pricing practitioners rely on three-year average results. Moreover, the authors noted that in order to increase the reliability of the results, an inter-quartile range should be determined based on the average profitability indicator computed for each comparable company. The inter-quartile range represents the range from 25th to the 75th percentile of the average profitability indicator of the comparable companies. The purpose of this range is to exclude potential outliers (i.e., extreme values). If the mark-up/margin applied within the related party transaction is situated within the inter-quartile range, then the transaction complies with the arm’s length principle.
3. Research methodology
The research methodology used within this paper is both, qualitative and quantitative. We detailed below the research methodology used in order to achieve the two objectives presented within Section 1.
To achieve the first objective, we applied initially a qualitative research methodology. In this respect, we performed a detailed analysis of the provisions of the O.E.C.D. transfer pricing guidelines related to the steps applied in order to test the arm’s length principle. After the understanding of these provisions, we performed a quantitative research, using the case study as a research tool. Within the case study we shown a practical application of the four steps needed for a comparability analysis (Rossing et al., Citation2017).
Within the first step we performed a description of a related party transaction. When applying the second step we performed a comparison between functions carried out, risks incurred and assets used by each company involved in the transaction. In this step we also selected a tested party. Within step 3 we presented reasons for accepting/rejecting a transfer pricing method. In order to illustrate how should be applied the last step, we selected a sample of companies using in this respect the Amadeus database, online version, number 2704, from March 2017. Criteria applied in order to select the sample are detailed within Section 4 below. Further on, to this sample we applied additional criteria in order to find comparable companies with the one tested by us. All criteria applied take into consideration the requirements of the O.E.C.D. transfer pricing guidelines. Where for the application of a criterion provisions of a local legislation were required, we used the Romanian ones as we already have a good understanding of them. In Section 4 we mention the criteria which took into consideration the provisions of the Romanian legislation.
The second objective of the paper was achieved through the illustration of the last step of the comparability analysis. More exactly, after the identification of the final set of comparable independent companies, we computed the average profitability indicator for each of these companies. There were performed two computations, corresponding to the two situations detailed within Section 1 (i.e., the first computation considered the period 2012–2014, while the second one the period 2013–2015). In the end, we compared the results obtained by performing the two computations. Based on this comparison, we presented the final conclusion regarding the compliance with the arm’s length principle.
4. Case study – illustration of the main steps related to the analysis performed in order to test the compliance with the arm’s length principle
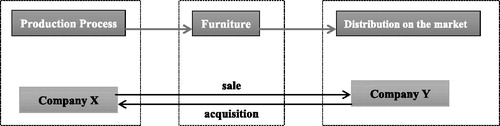
During 2015, Company X produced furniture for the affiliated entity Company Y. The finished products are sold by Company X to Company Y to a price determined based on the total costs incurred by Company X in order to produce those goods, plus a mark-up. Company X manufactures this kind of goods only for Company Y and Company Y purchases furniture only from Company X. The furniture is sold by Company Y to its clients, which are independent companies.
In order to analyse if the price charged by Company X to Company Y complies with the arm’s length principle we followed the steps required by the O.E.C.D. transfer pricing guidelines and outlined by Rossing et al. (Citation2017). The application of these steps is presented below:
Step 1: identification of the related party transaction
The related party transaction is represented by the sales of furniture by Company X and acquisition of it by Company Y. presents the flow of the related party transaction.
Figure 1. Flow of the related party transaction.
Source: Authors’ processing.
Within this step should be summarised the terms and conditions in which the related party transaction is carried out. This should be performed based on the selling – buying agreements concluded between Company X and Company Y and also based on discussions with the representatives of both companies. We presented the terms and conditions in the next step in order to illustrate a link between these and the function performed/risk incurred/asset used by each company.
Step 2: functional analysis
presents the functional analysis, illustrating the functions performed, risks incurred and assets used by each company. Next to each function/risk/asset are presented the terms and conditions based on which these functions/risks/assets were determined.
Table 1. Functional analysis.
Based on the functional analysis presented in and the classification performed by Herksen (Citation2009), we can conclude that Company X is a contract manufacturer, while Company Y is a fully-fledged distributor.
Further on, in order to apply the following two steps needed in order to determine whether the remuneration received by Company X from Company Y complies with the arm’s length principle, we have selected Company X as the tested party. The reason for which we selected Company X as the tested party is that this company is the least complex party to the transaction.
Step 3: selection of the transfer pricing method
Given that Company X manufactures furniture only for Company Y and Company Y purchases this kind of goods only from Company X, there could not be used internal comparables, but only external comparables from public sources.
Below we presented the reasons regarding the acceptance/rejection of each transfer pricing method:
C.U.P. method – given the fact that there is no available public information regarding prices charged between independent companies for the purchase and sale of furniture, we rejected the application of this method;
CPM and RPM – as we already mentioned within Section 2, specialised databases do not contain information regarding the expenses classified by destination, so that it is impossible to determine the gross profit mark-up of similar independent companies. To avoid this problem, net profitability indicators should be used. Given this, we rejected the application of both, C.P.M. and R.P.M.;
T.N.M.M. – given the fact that this method involves the comparison of net profitability indicators, we selected it in order to analyse if the remuneration paid by Company Y to Company X complies with the arm’s length principle. As we described within Section 2, the T.N.M.M. can be applied in a similar manner with both, the C.P.M. and the R.P.M. (the difference being that these two methods compare gross profitability indicators, while the T.N.M.M. compares net ones). Taking into consideration that the selected party is Company X, we chose the T.N.M.M. applied in a similar manner to C.P.M., and we rejected the T.N.M.M. applied in a similar manner to R.P.M. (which would have applied if the tested party had been Company Y);
P.S.M. – considering that the related party transaction analysed does not involve interrelated activities which determine the impossibility to identify comparables, and that the entities involved in transaction do not provide important intangible assets, we rejected this method.
Summarising, T.N.M.M. applied in a similar manner to C.P.M. is the most appropriate method that should be applied in order to analyse the compliance with the arm’s length principle of the price charge by Company X to Company Y.
Step 4: comparability analysis
Given that the tested party is Company X and the selected method is T.N.M.M. applied in a similar manner to C.P.M., within this step we compared the net profitability indicator obtained by Company X from the sale of furniture to Company Y with the net profitability indicators obtained by comparable independent companies.
In order to identify comparable independent companies, we used the following categories of criteria:
criteria applied in the Amadeus database: in this phase we obtained an initially sample of companies;
quantitative and qualitative criteria: we submitted the initially sample of companies returned by the Amadeus database to further analysis, applying manual quantitative and qualitative screenings.
presents a detailed description of each type of criteria applied.
Table 2. The search strategy.
5. Results and interpretations regarding the impact of the two approaches
Results obtained by performing the search on the Romanian market
After applying the first category of criteria (i.e., those applied in Amadeus database), we obtained an initial sample of 14 companies. After applying also the quantitative and qualitative criteria we obtained a final set of 2 comparable independent companies. presents, for each of the two approaches detailed in Section 1 of this paper (i.e., using the period 2012–2014 vs. the period 2013–2015), the number of companies eliminated after applying the quantitative and qualitative criteria.
Table 3. Results on the Romanian market.
As can been observed, two comparable companies remained in the sample after the application of all criteria. Given that this number is not sufficient to determine an inter-quartile range, we have expanded our search on the E.U. market. According to the practice from Romania, a sufficient number is represented by minimum of five comparables.
Results obtained by performing the search on the EU market
After applying the first category of criteria (i.e., those applied in Amadeus database), we obtained an initial sample of 143 companies. After applying also the quantitative and qualitative criteria we obtained a final set of nine comparable independent companies. presents, for each of the two approaches, the number of companies eliminated after applying the quantitative and qualitative criteria.
Table 4. Results on the E.U. market.
For each of the nine companies selected we computed the average profitability indicator for the period 2012–2014 and the average one for the period 2013–2015. Given that the selected transfer pricing method is T.N.M.M. applied in a similar manner to C.P.M., the profitability indicator is net cost plus (N.C.P.), computed based on the below formula. We used this indicator, as we already mentioned within Section 2 of this paper, the profitability indicator should be a ratio between the operational result and an indicator which is not affected by related party transactions (i.e., in case of a manufacturer this indicator being the expenses).
Appendix 1 presents the nine selected comparable independent companies identified.
Inter-quartile range
Based on the average N.C.P. (i.e., W.N.C.P.) computed for the comparable independent companies selected above, we determined an inter-quartile range for both periods (i.e., 2012–2014 vs. 2013–2015). This range was determined using the quartile function of the Microsoft Excel application. presents the inter-quartile range.
Table 5. Inter-quartile range.
Conclusion of the comparability analysis
Using the financial information of independent companies from the period 2012–2014, as could be observed from the , the inter-quartile range spans from 0.61% to 1.82% with a median of 1.55%. The inter-quartile range obtained by using financial information from the period 2013–2015 is between 0.11% and 2.55% with a median of 1.74%.
Given this, we can conclude that the inter-quartile range does not change significantly from a period to other. The median of the inter-quartile range recorded a slow increase in the period 2013–2015 compared with the one from 2012 to 2014. However, this result should be correlated with the evolution of the European market of the contract furniture manufacturer, which in 2015 compared with 2014 recorded also a slow increase (https://www.worldfurnitureonline.com/research-market/-0074172.html).
Therefore, the using of different approaches with regards to the multiple years considered in the analysis have a significant impact on the inter-quartile range and on the final conclusion about the compliance with the arm’s length principle, only if in the year under analysis (2015 in our case study) it is recorded a significant evolution on the market in which the transaction is performed.
On the other hand, the small variation of the inter-quartile range among the two situations could also impact the final conclusion. For example if Company X adds a mark-up of 2% on the costs incurred in order to manufacture the furniture sold to Company Y, according to the first situation there is not respected the arm’s length principle, as the mark-up of 2% is not situated within the inter-quartile range, while using the period 2013-2015 the related party transaction analysed complies with the arm’s length principle.
6. Conclusions and discussions
According to I.A.S. 24, companies should perform ‘disclosures that related party transactions were made on terms equivalent to those that prevail in arm’s length transactions’. This kind of disclosure could have a significant impact on the increasing of the investors ‘confidence as related party transaction which are not compliant with the arm’s length principle distort the financial statements of the companies.
Regarding the first objective of our research, we identified that there are four main steps: identification of the related party transaction, functional analysis, identification of the appropriate transfer pricing method, comparability analysis. In addition, we concluded that these steps should be applied in cascade, as the results from a previous step influence the analysis from the next step.
Moreover, along the application of the forth step (i.e., the comparability analysis), we noticed that due to the different deadlines imposed by countries over the world for the preparation of the transfer pricing documentation, companies use different approaches. For example, in order to perform the comparability analysis, companies from the countries where the deadline for the transfer pricing documentation is set before the deadline of the financial statements, use financial information from previous years to the year analysed. On the other hand, companies from the countries which do not have a deadline imposed for the transfer pricing documentation may use information from the previous years, but also including the year under analysis. Given this, we found that the deadline established by countries for the documentation of the arm’s length principle influences the approach which will be used by companies in respect to the years considered for the comparability analysis.
Considering all the above, and with regards to the second objective of this paper, we concluded that the approach applied (i.e., the years used in order to perform the comparability study) has a significant impact on the final conclusion about the compliance of a related party transaction with the arm’s length principle, only if in the year under analysis it is recorded a significant evolution on the market on which that transaction is performed. However, the two approaches presented within the paper determine small variation of the inter-quartile range, but by using one of the two approaches a transaction may comply with the arm’s length principle, while applying the other one, that transaction may not comply with the aforementioned principle. Based on this, we consider that the substantiation of the arm’s length principle (as it is required by I.A.S. 24) is a subjective analysis which is influenced by the domestic legislation of the countries. In this context, the main question that could arise is that if there is necessary a rule which should be applied by all countries. This rule could be related either to the deadline for the documentation of the arm’s length principle or to the approach used for the selection of the years included in the comparability analysis. At this moment, if a related party transaction is analysed within a jurisdiction, it could comply with the arm’s length principle and, if it is analysed in another jurisdiction, it may not comply with this principle. This situation may lead to a double taxation of results within a multinational group of companies.
The limits of our research are represented by the criteria applied in order to identify the final set of comparable companies. These criteria reflect our understanding of the provisions of the O.E.C.D. transfer pricing guidelines. Another limit of the research is represented by the small number of comparables identified. However, with all these limits we consider that our research contributes to the arm’s length principle literature.
Future research directions involve the performing of the comparability analysis for a company which operates in an industry that recorded a significant evolution in the year in which the related party transaction took place, compared with the previous years. The main objective of this research will be to identify in which measure a significant evolution of the industry impact the inter-quartile range determined in the two situations (presented in Section 1).
In addition, another research direction may take into consideration the different percentage used by countries in order to determine the affiliation relationship between companies and to analyse if this percentage impacts significantly the inter-quartile range.
Disclosure statement
No potential conflict of interest was reported by the author(s).
References
- Chand, V., & Wagh, S. (2014). The profit split method: Status quo and outlook in light of the BEPS action plan. International Transfer Pricing Journal, November/December, 21(6), 402–408.
- Choe, C., & Matsushima, N. (2013). The arm's length principle and tacit collusion. International Journal of Industrial Organization, 31(1), 119–130. doi:10.1016/j.ijindorg.2012.12.001
- Cools, M. (1999). International commercial databases for transfer pricing studies. International Transfer Pricing Journal, September/October, 6(5), 167–182.
- Dessatniuk, O., & Cherevko, O. (2015). Practical application of the methodology for calculating the arm’s length range of prices/profitability for transfer pricing purposes. European Journal of Economics and Management Sciences, 4, 30–33. doi:10.20534/EJEMS-15-4-30-33
- Devonshire-Ellis, C., Scott, A., & Woollard, S. (2011). Designing and implementing a transfer pricing system. In C. Devonshire-Ellis, A. Scott, & S. Woollard (Eds.), Transfer pricing in China (pp. 7–23). Berlin: Springer Berlin Heidelberg. doi: https://doi.org/10.1007/978-3-642-16080-6_2
- Epstein, B. J., & Jermakowicz, E. K. (2008). Chapter 23 Related-party disclosures. In Interpretation and application of international financial reporting standards (pp. 852–863). Hoboken, New Jersey: John Wiley & Sons Inc.
- Herksen, M. (2009). Chapter 2 Business models. In A Bakker (Ed.), Transfer pricing and business restructurings: Streamlining all the way (pp. 13–48). Netherlands: Ibfd. https://www.worldfurnitureonline.com/research-market/-0074172.html
- Huang, D. T., & Liu, Z. C. (2010). A study of the relationship between related party transactions and firm value in high technology firms in Taiwan and China. African Journal of Business Management, 4(9), 1924–1931.
- Hughes, E., & Nicholls, W. (2010). The different methods of TP: Pros and cons. TaxJournal. Retrieved from: https://www.taxjournal.com/articles/different-methods-tp-pros-and-cons
- Jain, A. K. (2015). Prioritizing transfer pricing methods: An Indian and global perspective. International Transfer Pricing Journal, May/June, 22(3), 167–174.
- Luca, A. (2009). Preţurile de transfer – metodele de stabilire. Consultantul Fiscal, Iunie, 2009, 20–27.
- Matei, G., & Pîrvu, D. (2011). Preţurile de transfer în Uniunea Europeană. Economie Teoretică şi Aplicată, XVIII (4(557), 99–11.
- OECD. (2017). Transfer Pricing Guidelines for Multinational Enterprises and Tax Administrations.
- Ondrušová, L. (2016). Management decisions in transfer pricing. Strategic Management, 21(1), 3–7.
- Order no. 442. (2016). regarding the value of transactions, the preparation terms, the content and the conditions under which the transfer pricing documentation file is to be requested and presented and the procedure for adjusting/estimating the transfer prices, Bucharest: Romanian Official Gazette no. 74/02.02.2016.
- Pozzoli, M., & Venuti, M. (2014). Related party transactions and financial performance: Is there a correlation? Empirical evidence from Italian listed companies. Open Journal of Accounting, 3(1), 28–37. doi:10.4236/ojacct.2014.31004
- Radolovic, J. (2012). Transfer pricing model based on multiple-factor transfer pricing model using the transactional net margin method. Ekonomska Istrazivanja-Economic Research, 25(1), 34–50.
- Rossing, P. C., Cools, M., & Rohde, C. (2017). International transfer pricing in multinational enterprises. Journal of Accounting Education, 39, 55–67. doi:10.1016/j.jaccedu.2017.02.002
- Tong, Y., Wang, M., & Xu, F. (2014). Internal control, related party transactions and corporate value of enterprises directly controlled by Chinese central government. Journal of Chinese Management, 1(1), 1–14. doi:10.1186/s40527-014-0001-9
- Wong, T. J., & M. Jian. (2003, July). Earnings management and tunnelling through related party transactions: Evidence from Chinese Corporate Groups. EFA 2003 Annual Conference Paper No. 549 available online at http://ssrn.com/abstract=424888
Appendix 1. Comparable independent companies