
 ?Mathematical formulae have been encoded as MathML and are displayed in this HTML version using MathJax in order to improve their display. Uncheck the box to turn MathJax off. This feature requires Javascript. Click on a formula to zoom.
Abstract
The goal of environmental regulation is to simultaneously achieve a win–win situation of economic growth and environmental quality. Based on the Porter hypothesis and panel data from 2001 to 2011, this study conducts empirical research on the intensity of environmental regulation and industrial green transformation in China. The results indicate that environmental regulation can effectively promote industrial green transformation by improving green total factor productivity (G.T.F.P.). But there is no simple linear relationship between the two. And there is a threshold effect, that is, the degree of influence of environmental regulation on industrial green transformation can change with the change of threshold value. Therefore, government policy should not focus only on the environmental regulation intensity, which cannot efficiently improve the G.T.F.P., or accelerate the green transition process. Instead, government should adopt different environmental policies in different industrial sectors.
1. Introduction
It is a commonly held view that the rapid economic growth in China exacted at the cost of environmental degradation (Li et al., Citation2018). According to Development Research Center of the State Council, coal consumption in China reached 1.95 billion tons in 2015, of which the industrial sector consumed about 80% (Yuan and Xie, Citation2014). Moreover, huge energy consumption led to serious environmental pollution. As of 2015, China has emitted total about 10.6 billion tons of carbon dioxide (CO2), which equals to 7.7 tons per capita, far exceeding the global average of 4.4 tons (IEA, Citation2015).
In order to achieve the sustainable development of the economy, China is experiencing a strategic period of industrial transformation through the transition of traditional industrial economy into a green-intensive development mode. However, because the environment quality is considered to be a public good and the existence of environmental externalities, firms or businesses always pursue the maximised profits by ignoring environmental impact if the government fails to impose mandatory measures to internalise the spillover cost. Therefore, in order to achieve a win–win solution of economic growth and improvement of environmental quality, the appropriate environmental regulations or policies should be introduced (Arrow et al., Citation1995; Pontus & Karlson, Citation2002; Spangenberg, Citation2002). However, the impacts of environmental regulation on the economic growth have been controversial. Undoubtedly, stricter environmental regulations can effectively improve the environmental quality, but can also hinder economic growth (Bhattarai & Hammig, Citation2001; Hettige et al., Citation2000; Kanada et al., Citation2013; Tang et al., Citation2014).
Some scholars believed that firms allocated part of the capital to manage environmental pollution in order to comply with environmental regulations, which led to the cost increase and the weakening of the innovation and competition (Chintrakarn, Citation2008; Dension, Citation1981; Gollop & Roberts, Citation1983; Gray, Citation1987; Rassier & Earnhart, Citation2010). Some empirical studies supported the above arguments. Jorgenson and Wilcoxen (Citation1990) found that the G.N.P. in the United States decreased by 2.59% from 1973 to 1985 compared with no environmental regulations by analysing the GNP data. Barbera and McConnell (Citation1990) conducted the empirical research by using the panel data of the chemical industry and steel industry in the United States from 1960 to 1980. The results indicated that the environmental regulation dramatically hindered the technological progress of the two industries. Jaffe and Palmer (Citation1997) found that environmental regulation had a negative impact on the production performance of a firm, mainly due to the higher production factor prices and the increased investment for environmental improvement. Greenstone et al. (Citation2012) found that different types of relationship existed between the environmental regulation for different pollutants and the productivity. The productivity was negatively impacted by the environmental regulations pertaining to ozone layer protection and particulate matter emissions, while the relationship was not significant with the environmental regulations pertaining to the emissions of sulfur dioxide (SO2). Overall, there was a significantly negative correlation between the environmental regulation and the productivity. In a multi-country study of the aquaculture industry, Abate et al. (Citation2016) found that the industry positively affected the GDP, but negatively correlated with the intensity of environmental regulation by the each study country. Especially in the developed countries, environmental regulations led to the lower economic growth.
It is undeniable that the environmental regulation inevitably increases the production cost of a firm. However, in order to maximise the profits, a firm constantly pursues and adopts new technology to lower the increased costs. Technological innovation can not only overcome the law of diminishing marginal returns, but also lead to technology diffusion among organisations and structural upgrading in the industry, which can eventually promote economic growth and improve the environmental quality simultaneously. Earlier studies about how environmental regulation promoted technological innovation and productivity can be traced back to Hick (Citation1932), who proposed that an increase in the cost of certain factors led to innovation of that factor. Porter and Linde (Citation1995) further extended this research and proposed the Porter hypothesis that a reasonable environmental regulation policy can encourage firms to innovation, and technological innovation and efficiency can further enhance the productivity and competitiveness of a firm, which eventually offset the increase in costs caused by the environmental regulation. Following the Porter hypothesis, many empirical studies provided evidences for the Porter hypothesis. Lanjouw and Mody (Citation1996) found that technological innovation had a certain time lag with the implementation of environmental regulations, but there was a significantly positive correlation between them. Van der Vlist (Citation2007)'s study on the agricultural sector in the Nederland and Jaraite and Maria (Citation2012)'s study of the European public utilities sector identified positive effects of stricter environmental regulations on technical efficiency. Using the enterprise-level data, the empirical studies of Lanoie et al. (Citation2011) and Jorge et al. (Citation2015) indicated that there was a significantly positive relationship between environmental regulation and corporate competitiveness.
However, not all empirical findings supported the Porter hypothesis. Fleishman et al. (Citation2009) found that the air pollution regulations had different effects in the power industry in the United Sates, while the impact to different firms can be positive, negative, or not at all. Hamamoto (Citation2006) revealed a positive impact on R&D spending in the early stages of environmental regulation in Japan, but the impact on productivity declined over time. Domazlicky and Weber (Citation2004) determined that the environmental regulation has no significant relationship with productivity growth for the chemical industry in the United States. Alpay et al. (Citation2002), through a comparative study of food manufacturing in the United States and Mexico, found that the environmental regulations in the United States did not significantly impact the profit of food manufacturing industry, but had a significantly negative impact on its productivity, while the environmental regulations in Mexico had a positive impact of productivity and negative impact on profitability.
Scholars in the study of the relevant issues in China generally agreed that more stringent environmental regulations were conducive to the improvement of the industrial economy and can speed up the process of the green industrial transition. However, there was no simple linear relationship between the environmental regulation and industrial growth. The effect of environmental regulation on the growth of industrial economy had a threshold effect. The Porter Hypothesis can exist only when the intensity of environmental regulations exceed a certain threshold (Li et al., Citation2013; Li and Tao, Citation2012; Yuan and Xie, Citation2014).
The overall objective of this article is to examine the nonlinear relationship between environmental regulation and the green transition of China’s industrial development mode, and to empirically test the existence of the threshold effect, in order to provide more reasonable environmental regulation policies for policymakers.
The contribution of this study is twofold. First, most of the existing literatures adopted G.T.F.P. as a direct measurement of industrial green transformation and did not determine the improvement of production mode. This study introduces the contribution of G.T.F.P. to the industrial economic growth to measure the transformation of industrial production mode, which is an improved approach to define the contribution to the industrial green transformation of the productivity by traditional production factors and green production factors and can accurately evaluate the process of industrial green transformation. Second, there is a threshold effect between environmental regulation and industrial green transformation. Accurate calculation of threshold can provide a foundation for the determination of the appropriate environmental regulation intensity. Therefore, this article constructs a nonlinear relationship between environmental regulation and industrial green transformation, and identifies the thresholds for environmental regulation and industrial green transformation of different sectors by adopting the panel threshold model.
2. Methodology
2.1. Calculation of green total factor productivity (G.T.F.P.)
Numerous studies have attempted to estimate G.T.F.P. in order to better characterise the environmental footprint of industries. G.T.F.P. is an indicator of sustainability of production processes. Unlike a regular T.F.P. measure, it accounts for undesirable outputs, such as environmental pollutants. Higher or increasing G.T.F.P. value is an indication that the technology in the production process or the system is in transition to a more sustainable mode. Chung et al. (Citation1997) estimated the G.T.F.P. by using a directional distance function (D.D.F.) approach, while Fukuyama and Weber (Citation2009) extended the study in this area by adopting a directional slacks-based measure (S.B.M.) to estimate the technical inefficiency through a data envelopment analysis (D.E.A.) approach. This article combines the S.B.M. D.D.F. approach considering the undesirable output and the Global Malmquist–Luenberger (G.M.L.) productivity index approach (Fukuyama & Weber, Citation2009) to estimate the G.T.F.P. The detailed calculation methods can be found in Li et al. (Citation2018).
2.2. Dynamics of production mode of industrial sectors
Implementation of the production technology in this study uses Solow’s Cobb Douglas functional form by including energy consumption as a third input (Solow, Citation1957):
(1)
(1)
where,
,
,
,
, and
represent gross industrial output, G.T.F.P. (accounting for undesirable outputs), capital input, labour input, and energy input, respectively. By taking the logarithms and time differentiating, the equation above can be transformed into:
(2)
(2)
The right hand side of the equation above represents the contribution of G.T.F.P., capital investment, labour input, and energy consumption, respectively to the rate of total industrial economic growth. Let represent the contribution of G.T.F.P. to industrial economic growth in sector i at time period t and can be express as:
(3)
(3)
Based on EquationEquation (3)(3)
(3) , the magnitude of
directly depends on the relative contributions of G.T.F.P. and the other factors of production. When
, and
, if
, it indicates that the growth rate of G.T.F.P. is greater than the weighted average growth rate of all other factors of production and the growth of this industry trends to be green-intensive. If
, it indicates that the growth rate of G.T.F.P. is less than the weighted average growth rate of all other factors of production and the growth of this industry trends to be extensive. If
, it indicates that the growth rate of G.T.F.P. is equal to the weighted average growth rate of all other factors of production and this industry is defined as intermediate.
In the empirical estimations presented in the next section, the time trend of values for each industrial sector is used to classify all sectors into three different groups to reflect their production modes: green-intensive, intermediate, and extensive. A hierarchical clustering procedure is performed by using S.T.A.T.A. Version 14 to group all industrial sectors into three clusters.
2.3. The panel threshold model of environment regulation
The ultimate goal of environmental regulation is to achieve a win–win situation of economic growth and environmental quality simultaneously. Therefore, government environmental policy needs flexibility by combining the different mechanisms to achieve the optimal environmental regulation intensity on the basis of the actual production situation of the firms and the overall economic situation. Hence, this article selects industrial waste-water discharge compliance rate, industrial sulfur dioxide removal rate, and industrial solid waste comprehensive utilisation rate to build a proxy that serves as the composite index of China’s industrial environmental regulatory strength:
(4)
(4)
Meanwhile, the panel threshold model of environmental regulation and green transition of industrial economic growth is built based on the following equation:
(5)
(5)
where, i represents the individual sector, j represents the environmental pollution indicator, and t represents time. is the discharge of environmental pollution j in sector i at time period t, and
is the total environmental pollution discharge of all sectors at time period t.
represents the industrial output value of sector
at time period
, and
is the gross industrial output value of all sectors at time period
.
is the contribution rate of G.T.F.P. to industrial economic growth in sector
at time period
, and is used as the major measure of the degree of green transition of the industrial economy.
stands for the intensity of environmental regulation as well as the threshold variable.
is the indicator function, and
is the threshold value.
are three control variables and represent the share of industrial added value by industrial GDP, full labour productivity, and energy productivity, respectively, in which labour productivity is the ratio of industrial added value divided by the total industrial population, and energy productivity is the ratio of industrial added value by the total energy consumption.
is the random disturbance term.
3. Data sources and variable description
Data for this study were obtained for the 2001–2011 period from China Statistical Yearbook, China Industrial Economics Statistical Yearbook, China Energy Statistical Yearbook, and China Environmental Statistical Yearbook. In order to ensure consistency and completeness of the data, ‘other mining industry’, ‘handicrafts and other products’, and ‘waste resources and waste materials processing industry’ were removed from the data set prior to the estimation due to the large amount of missing data associated with those sectors. The remaining 36 industrial sectors were used to calculate the G.T.F.P. of China’s industrial economy. The selection of indicators and data sources of input and output in the G.T.F.P. measurement are as follows.
For the input variables, in addition to the two traditional production factors of capital and labour, this article follows the practice of relevant empirical research (Cao, Citation2008; Chen, Citation2015; Chen & Golley, Citation2014; Krugman, Citation2006; Li & Lin, Citation2015; Picazo-Tadeo and Prior, Citation2009; Wang et al., Citation2010, Citation2018; Watanabe & Tanaka, Citation2007; Zhou & Ang, Citation2008) by incorporating energy as a proxy variable for natural resources. For the input variable of capital, this article refers to Li et al. (Citation2013) and selects the annual average balance of net fixed assets of the sub-industry as the approximate estimate of the capital stock, and converts data to the constant 1991 price with the fixed asset investment price index. For the input variable of labour, given the difficulty in measuring and obtaining the labour-quality data, the annual average number of employees in the sub-industry is used. The total energy consumption index of the sub-industry was obtained as a measurement of energy input.
The output variables include desirable outputs and undesirable outputs. For the desirable output variable, the gross value of industrial output was used after adjusting by the producer price index. For the undesirable output variable, most of the existing literatures used one or more pollutant emission indicator(s) directly into the production accounting process (Cao, Citation2008; Chen, Citation2015; Chen & Golley, Citation2014; Krugman, Citation2006; Li & Lin, Citation2015; Picazo-Tadeo and Prior, Citation2009; Wang et al., Citation2010, Citation2018; Watanabe & Tanaka, Citation2007; Zhou & Ang, Citation2008). The choices of indicators in these previous studies were subjective and did not reflect the difference in the exact impact of different pollutant emissions on economic growth. Therefore, this study follows the entropy method by combining data from industrial wastewater, waste gas, solid waste, and industrial carbon dioxide to construct a comprehensive environmental pollution index (Li et al., Citation2018). Since carbon dioxide data is not available from the existing statistics, this study estimates industrial carbon emissions by using the Intergovernmental Panel on Climate Change's Greenhouse Gas Inventory Guide (IPCC, 2017) based on the following equation:
(6)
(6)
where,
represents the industrial carbon dioxide emissions;
stands for the total consumption of industrial coal industrial crude oil, and industrial natural gas by sector;
is the average low calorific value of the three energy sources; and
represents the carbon emission coefficient. Referring to the previous studies (Energy Foundation, Citation2017; Li et al., Citation2013), this study adopts the following carbon emission coefficients in tons of carbon equivalent (tce): 2.64t CO2/tce for coal, 2.08t CO2/tce for crude oil, and 1.63t CO2/tce for natural gas, respectively.
represents the carbon oxidation factor, which is 0.99 for coal, and 1.00 for both crude oil and natural gas. The molecular weights of carbon dioxide (44) and carbon (12) are applied here to convert to CO2 equivalence. The descriptive statistics of major variables can be found in .
Table 1. The descriptive statistics of major variables in 2001–2011.
4. Empirical results and analysis
4.1. Empirical analysis of G.T.F.P. in china’s industrial economy
Results of the empirical estimations of the G.M.L. indices for the 36 industrial sectors are presented in , where Column 1 displays the industrial sector, columns 2, 3, and 4 are the G.T.F.P., efficiency index, and technical progress index, respectively. Recall that G.T.F.P. is the product of the efficiency index and the technical progress index. However, the numbers in the table represent averages across the 11-year study period. Hence, the data in column 2 is not the product of the corresponding numbers in columns 3 and 4. Column 5 shows the contribution of G.T.F.P. to the rate of total industrial economic growth. And column 6 indicates the degree of regulation intensity in different sectors.
Table 2. Empirical results of G.T.F.P. and green transition of China’s industrial economy in 2001–2011.
The results in are organised in three separate sections: green-intensive group, intermediate group, and extensive group. The last row shows average values across all industrial sectors, which indicates that overall, China’s industrial economy experienced a slightly increase in G.T.F.P., with an average annual value of about 6% per year ([1.06–1]*100%). The corresponding average annual growth rates of technological progress and technical efficiency are 4% and 3%, respectively, indicating that both sources of growth contributed significantly to the improvement in China’s industrial G.T.F.P. These findings demonstrate that China’s industrial sector moved slowly towards greener production systems in 2001–2011 with technological progress being a more important driving force (57%) than efficiency gains (43%). However, given the modest average annual growth rate of G.T.F.P., the degree of green transition of China’s industrial economy deserves further study.
It can be seen in that a positive growth rate of G.T.F.P. for all industrial sectors, except the ferrous metal mining sector, which has an average annual decrease of 6% ([0.94 − 1]*100%). There are a few sectors with higher G.T.F.P., such as coal mining and processing, petroleum and natural gas extraction, papermaking and paper products, petroleum proc. and coking products, smelting and pressing of ferrous metals, and electric power, steam, hot water. A few other sectors have relatively smaller but positive G.T.F.P. growth rates, such as furniture manufacturing, and stationery, education, and sports goods with 0.93% and 0.04%, respectively. Unlike some of the existing literatures, this study discovered that the higher the growth rate of G.T.F.P. associated with traditional pollution-intensive sectors, the lower the green production efficiency is, while the lower the growth rate of G.T.F.P. associated more with light industrial sectors.
There is anecdotal evidence in support of these results. In recent years, China are facing more international and domestic pressure to improve the environmental quality. Frequent pollution incidents further show the increasing constraints of resources and the environment on the sustainable development of China’s industrial economy. Therefore, the Chinese government has accelerated the pace of industrial green transition, that is, transition to greener technologies. The heavy industrial sectors have become the preferred target to reform due to their environmentally pollution-intensive characteristics. Through the introduction of high-tech processes, policy changes, structural upgrades, and other reforms, heavy industrial sectors, such as coal mining and processing, have shown a potential of improvement towards the production frontier. On the contrary, sectors such as electronic and telecommunication equipment, which are very close to the best production frontier, have relatively limited room for improvement, which result in a lower growth rate of G.T.F.P.
4.2. Empirical analysis on green transition of China’s industrial economy
The results in also show that the average annual contribution of G.T.F.P. to the industrial growth from 2001 to 2011 is 31.4%, indicating that China’s rapid industrial growth largely relies on the massive investment of traditional resources with an extensive development mode. The contribution of G.T.F.P. to industrial economic growth varies widely among sectors. Consequently, a hierarchical clustering analysis is performed to divide the 36 sectors into three major groups based on the dynamics of the contribution of G.T.F.P., namely, green-intensive group, intermediate group, and extensive group.
The sectors clustered into the green-intensive group are high-tech industries, such as electronic and telecommunications equipment, and these sectors with certain technological innovation advantages and producing high proportions of value-added products. Other sectors in the green-intensive group are clean sectors with relatively low energy consumption and environmental pollution, such as stationery, education, and sports goods. The average contribution of G.T.F.P. to the rate of China’s industrial economic growth in the green-intensive group is 53.9%, revealing an environmentally friendly development mode in this group. Furthermore, it is worthy of note that the average value of G.T.F.P. itself in the green-intensive group is relatively high at 7.2%, which implies that as the green transition process of the industrial economy continues to accelerate and these green-intensive sectors will continue to play an important role through both technological progress and improvements of efficiency to enhance the contribution of G.T.F.P. to China’s industrial economic growth.
The extensive group includes resource-intensive sectors associated with serious environmental pollution emissions. The average contribution of G.T.F.P. to the rate of industrial economic growth in this group is 19.6%, which demonstrates that the sectors in this group still depend heavily on the massive investment of traditional resources, such as capital, labour, and energy, instead of G.T.F.P. Leather-, furs-, down-related products even have negative G.T.F.P. growth rate of 5.6%. Therefore, this high-energy consumption, high-volume resource, and high-pollution production mode has slowed down the green transition process of China’s industrial economy.
The intermediate cluster consists primarily of traditional industrial sectors, and the contribution of G.T.F.P. to industrial economic growth is 21.5%. The value of G.T.F.P. among these sectors varies with 45.5% in instruments, meters, etc., and −13.1% for nonmetal mineral products. The range of green contribution rates among sectors reveals the uncertainty of green transition exists in this group.
Overall, China’s industrial economy still maintains the extensive development mode in the current economic development period, in which economic growth largely depends on massive investment of capital, labour, energy, and other traditional resources, and G.T.F.P. has not yet become the main factor of driving economic growth. As land and labour costs are rising sharply in recent years, coupled with the challenge of an aging population, the industrial sector would face an unsustainable future, if the industrial economic growth is unable to transition from extensive to green-intensive development mode.
4.3. Empirical analysis of threshold panel model on environmental regulation and green transition of China’s industrial economy
depicts the trend of environmental regulation intensity by three clusters of industrial sectors from 2001 to 2011, which can be seen that the intensity of environmental regulation decreased significantly from 2004 to 2006, followed by a fluctuating upward trend. From the grouping results, the average intensity of environmental regulation in the extensive group is higher than the other two groups, which can be explained by the fact that the government takes corresponding environmental regulation measurements, generating corresponding intensity based on various production and pollution characteristics of different sectors. Therefore, it is necessary to test the threshold effect of environmental regulation of three groups, discover the relationship between environmental regulation and green transition of each group, and identify their unique threshold values. The parameter estimation results of grouping threshold mode are presented in .
Figure 1. Trend of environmental regulation intensity by clusters of industrial sectors from 2001 to 2011.
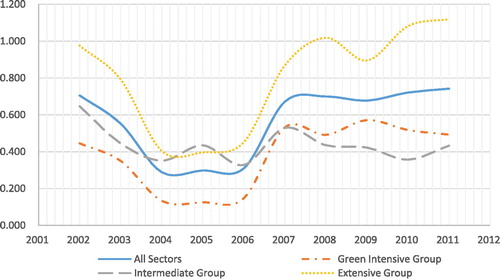
Table 3. Parameter estimation results of grouping threshold panel data model.
In the green-intensive group, there is one threshold value of 0.03 based on the empirical results. Based on the significance level of coefficient, it can be found that environmental regulation can effectively promote the green transition of China’s industrial economy when the environmental regulation intensity is greater than 0.03. According to the sample, most of the sectors have reached the turning point, where environmental regulation can effectively improve the environmental quality as well as economic growth. At the same time, government needs to strengthen current environmental regulation to accelerate the green transition process in the stationery, education, and sports goods.
There are two threshold values of 0.51 and 0.92 in the intermediate group, demonstrating the non-linear relationship between environmental regulation intensity and green transition of China’s industrial economy. And the results indicate that only when the intensity of environmental regulation is between 0.51 and 0.92, strengthening environmental regulation can effectively promote the green transition pace. When the environmental regulation intensity is higher than 0.92, Further strengthening the environmental regulation can negatively affect the green transition. Therefore, for some sectors, such as mining and processing of nonmetal ores with the environmental regulation intensity of 0.98, the government should develop more flexible environmental regulation mechanism as well as reduce its current environmental regulation intensity to promote the green transition of this sector. For other sectors, like garment and other fiber products; furniture manufacturing; and instruments, meters, etc. the government should continue to strengthen environmental regulation until it breaks the threshold value, in order to more effectively promote the industrial green transition.
For the extensive group, there is one threshold value of 1.04 and a direct correlation relationship between environmental regulation and green transition. The environmental regulation effect is greater when the intensity is lower than 1.04. Therefore, government can lower the environmental regulation intensity while enriching the environmental regulation mechanism in some sectors, such as coal mining and processing; nonferrous metals mining and processing; papermaking and paper products in order to better promote the green production as well as reduce the environmental pollution. As expected, the energy productivity and green transition in the extensive group are negatively correlated, which reveals that the sectors in extensive group generally have high-energy consumption, high-pollution and high-output characteristics. Therefore, the extensive production mode is not conductive to the green transition of China’s industrial economy.
5. Conclusions and policy implications
The current development of the industrial economy in China is facing a dilemma when encountering the challenges of rapid economic growth and better environmental quality. A solution for green transition in achieving sustainable economic growth requires the government to make reasonable environmental regulations to encourage firms to continuously improve the contribution of G.T.F.P. to the economic growth.
This article combines S.B.M. D.D.F. and G.M.L. production index to calculate the G.T.F.P. in the industrial economy in China with the consideration of energy consumption and environmental pollution. Furthermore, the contribution of G.T.F.P. to industrial economic growth is used as the major measurement of the degree of green transition of the industrial economy and is further divided into three groups based on the dynamics of green transition. Based on these results, this article constructs the threshold panel data model of environmental regulation and green transition of the industrial economy and identifies their nonlinear relationship.
The results show that G.T.F.P. increases at an annual rate of 5.7% during the 2001–2011 study period and contributes an average of 31.4% to the industrial economic growth. This finding indicates that the current economic growth mode still relies mainly on massive investment of traditional resources, while the extensive development mode has not been effectively adopted. In the empirical analysis of the panel threshold model, the results show that environmental regulation can effectively promote the green transformation of the industrial growth, and the Porter hypothesis can be appropriate applied in the industrial sector in China. There is no simply linear relationship between the intensity of environmental regulation and green transition of industrial economy. When the environmental regulation intensity is less than the threshold value of 1.01, an increase in environmental regulation is more conducive to the industrial green transformation. When the environmental regulation intensity is greater than the threshold of 1.01, an increase in environmental regulation would negatively affect the green technology innovation and G.T.F.P. The regression results of the green-intensive group show that only when the environmental regulation intensity is higher than the threshold of 0.03, the improvement of environmental regulation intensity has a significant positive impact on the industrial green transformation. There are two thresholds for the intermediate group. When the environmental regulation intensity is between 0.51 and 0.92, the improvement of environmental regulation intensity can significantly promote the industrial green transformation. When the environmental regulation intensity exceeds 0.92, continue to improve the environmental regulation intensity will have a significant negative impact on the green transformation. There is only one threshold (1.04) in the extensive group. When the environmental regulation intensity larger or smaller than this threshold, environmental regulation has a significant positive impact on industrial green transformation. When the environmental regulation intensity is smaller than 1.04, the positive impact of environmental regulation on industrial green transformation is more intense.
Therefore, government policy should not focus only on the environmental regulation intensity, which cannot efficiently improve the G.T.F.P., or accelerate the green transition process. Instead, government should adopt different environmental policies in different industrial sectors. Especially, the policymakers in China need to gradually change the process of environmental regulation from the traditional command-control to market-driven, and continuously develop more market-friendly environmental regulations to provide incentive for the firms to continue green production technology innovation and improve G.T.F.P., which can eventually achieve the improvement of environmental quality and economic growth simultaneously.
Disclosure statement
No potential conflict of interest was reported by the authors.
References
- Abate, T. G., Nielson, R., & Tveteras, R. (2016). Stringency of environmental regulation and aquaculture growth: A cross-country analysis. Aquaculture Economics & Management, 20, 201–221. doi:10.1080/13657305.2016.1156191
- Alpay, E., Buccola, S., & Kerkvliet, J. (2002). Productivity growth and environmental regulation in Mexican and U.S. food Manufacturing. American Journal of Agricultural Economics, 84(4), 887–901. doi:10.1111/1467-8276.00041
- Arrow, K., Bolin, B., Costanza, R., Dasgupta, P., Folke, C., Holling, C. S., … Pimentel, D. (1995). Economic growth, carrying capacity, and the environment. Science, 268(5210), 520–521. doi:10.1126/science.268.5210.520
- Barbera, A., & McConnell, V. D. (1990). The impact of environmental regulations on industry productivity: Direct and indirect effects. Journal of Environmental Economics and Management, 18(1), 50–65. doi:10.1016/0095-0696(90)90051-Y
- Bhattarai, M., & Hammig, M. (2001). Institution and the environmental Kuznets Curve for deforestation: A cross country analysis of Latin America, Africa and Asia. World Development, 29(6), 995–1010. doi:10.1016/S0305-750X(01)00019-5
- Cao, J. (2008). Measuring green productivity growth for China’s manufacturing sectors: 1991–2000. Asian Economic Journal, 21(4), 425–451. doi:10.1111/j.1467-8381.2007.00265.x
- Chen, S. (2015). The evaluation indicator of ecological development transition in China’s regional economy. Ecological Indicators, 51, 42–52. doi:10.1016/j.ecolind.2014.08.011
- Chen, S., & Golley, J. (2014). Green’ productivity growth in China’s industrial economy. Energy Economics, 44, 89–98. doi:10.1016/j.eneco.2014.04.002
- Chintrakarn, P. (2008). Environmental regulation and U.S. states’ technical inefficiency. Economics Letters, 100(3), 363–365. doi:10.1016/j.econlet.2008.02.030
- Chung, Y. H., Färe, R., & Grosskopf, S. (1997). Productivity and undesirable outputs: A directional distance function approach. Journal of Environmental Management, 51(3), 229–240. doi:10.1006/jema.1997.0146
- Dension, E. F. (1981). Accounting for slower economic growth: The United States in the 1970’s. Southern Economic Journal, 47, 1191–1193.
- Domazlicky, B. R., & Weber, W. L. (2004). Does environmental protection lead to slower productivity growth in the Chemical Industry?. Environmental and Resource Economics, 28(3), 301–324. doi:10.1023/B:EARE.0000031056.93333.3a
- Energy Foundation. (2017). Interim measure for the promotion and administration of energy-saving and low-carbon technologies. Retrieved from http://www.efchina.org/Reports-zh/reports-20140110-zh
- Fleishman, R., Alexander, R., Bretschneider, S., & Popp, D. (2009). Does regulation stimulate productivity? The effect of air quality policies on the efficiency of US power plants. Energy Policy, 37(11), 4574–4582. doi:10.1016/j.enpol.2009.06.012
- Fukuyama, H., & Weber, W. (2009). A directional slacks-based measure of technical efficiency. Socio-Economic Planning Science, 43(4), 274–287.
- Gollop, F. M., & Roberts, M. J. (1983). Environmental regulations and productivity growth: The case of fossil-fueled electric power generation. Journal of Political Economy, 91(4), 654–674. doi:10.1086/261170
- Gray, W. B. (1987). The cost of regulation: OSHA, EPA, and the productivity slowdown. American Economic Review, 77, 998–1006.
- Greenstone, M., List, J., & Syverson, C. (2012, February). The effects of environmental regulation on the competitiveness of U.S. manufacturing. US Census Bureau Center for Economic Studies Paper No. CES-WP-11-03.
- Hamamoto, M. (2006). Environmental regulation and the productivity of Japanese manufacturing industries. Resource and Energy Economics, 28(4), 299–312. doi:10.1016/j.reseneeco.2005.11.001
- Hettige, H., Mani, M., & Wheeler, D. (2000). Industrial pollution in economic development: Kuznets revisited. Journal of Development Economics, 2, 445–476. doi:10.1016/S0304-3878(00)00092-4
- Hick, J. R. (1932). The theory of wages. London: Palgrave Macmillan UK.
- IEA (International Energy Agency). (2015). Energy and climate change (world energy outlook special report). Retrieved from http://www.iea.org/publications/freepublications/publication/weo-2015-special-report-energy-climate-change.html
- IPCC (Intergovernmental Panel on Climate Change. (2017). Tracking greenhouse gases: an inventory manual. Retrieved from http://climate.emb.gov.ph/wp-content/uploads/2016/06/GHG-Manual.pdf
- Jaffe, A. B., & Palmer, K. (1997). Environmental regulation and innovation: A panel data study. Review of Economics and Statistics, 79(4), 610–619. doi:10.1162/003465397557196
- Jaraite, J., & Maria, C. D. (2012). Efficiency, productivity and environmental policy: A case study of power generation in the EU. Energy Economics, 34, 1557–1568.
- Jorge, M. L., Madueno, J. H., Martinez-Martinez, D., & Sancho, M. P. L. (2015). Competitiveness and environmental performance in Spanish small and medium enterprises: Is there a direct link?. Journal of Cleaner Production, 101, 26–37.
- Jorgenson, D. J., & Wilcoxen, P. J. (1990). Environmental regulation and U.S. economic growth. The RAND Journal of Economics, 21(2), 314–340. doi:10.2307/2555426
- Kanada, M., Fujita, T., Fujii, M., & Ohnishi, S. (2013). The long-term impacts of air pollution control policy: Historical links between municipal actions and industrial energy efficiency in Kawasaki city, Japan. Journal of Cleaner Production, 58, 92–101. doi:10.1016/j.jclepro.2013.04.015
- Krugman, P. (2006). Environmentally sensitive productivity growth: A global analysis using Malmquist-Luenberger index. Ecological Economics, 56, 280–293.
- Lanjouw, J. O., & Mody, A. (1996). A Innovation and the international diffusion of environmentally responsive technology. Research Policy, 25(4), 549–571. doi:10.1016/0048-7333(95)00853-5
- Lanoie, P., Laurent-Luccheti, J., Johnstone, N., & Ambec, S. (2011). Environmental policy, innovation and performance: New insights on the Porter hypothesis. Journal of Economics and Management Strategy, 20, 802–822.
- Li, K., & Lin, B. (2015). Measuring green productivity growth of Chinese industrial sectors during 1998–2011. China Economic Review, 36, 279–295. doi:10.1016/j.chieco.2015.09.008
- Li, B., Peng, X., & Ou-Yang, M. (2013). Environmental regulation, green total factor productivity and the transformation of China’s industrial development mode: Analysis based on data of China’s 36 industries. China Industrial Economics, 4, 56–68.
- Li, L., & Tao, F. (2012). The choice of the optimum environmental regulation intensity of China's manufacturing industry: based on the perspective of green total factor productivity. China Industrial Economics, 5, 70–82.
- Li, H., Zhang, J., Osei, E., & Yu, M. (2018). Sustainable development of China’s industrial economy: An empirical study of the period 2001–2011. Sustainability, 10(3), 764. doi:10.3390/su10030764
- Picazo-Tadeo, A. J., & Prior, D. (2009). Environmental externalities and efficiency measurement. Journal of Environmental Management, 90(11), 3332–3339. doi:10.1016/j.jenvman.2009.05.015
- Pontus, C., & Karlson, L. (2002). Business incentives for sustainability: A property rights approach. Ecological Economics, 40, 13–22. doi:10.1016/S0921-8009(01)00275-0
- Porter, M. E., & Linde, C. V D. (1995). Toward new conception of the environmental-competitiveness relationship. Journal of Economic Perspectives, 9(4), 97–118. doi:10.1257/jep.9.4.97
- Rassier, D. G., & Earnhart, D. (2010). The effect of clean water regulation on profitability: Testing the Porter Hypothesis. Land Economics, 86(2), 329–344. doi:10.3368/le.86.2.329
- Solow, M. R. (1957). Technical change and the aggregate production function. The Review of Economics and Statistics, 39(3), 312–320. doi:10.2307/1926047
- Spangenberg, J. H. (2002). The changing contribution of unpaid work to the local standard of living in sustainable development scenarios. International Journal of Sustainable Development, 5, 461–475. doi:10.1504/IJSD.2002.003764
- Tang, E., Liu, F., Zhang, J., & Yu, J. (2014). A model to analyze the environmental policy of resource reallocation and pollution control based on firms’ heterogeneity. Resources Policy, 39, 88–91. doi:10.1016/j.resourpol.2013.12.001
- Van der Vlist, A. J., Withagen, C., & Folmer, H. (2007). Technical efficiency under alternative environmental regulatory regimes: The case of Dutch horticulture. Ecological Economics, 63(1), 165–173. doi:10.1016/j.ecolecon.2006.10.013
- Wang, B., Wu, Y., & Yan, P. (2010). Environmental efficiency and environmental total factor productivity growth in China’s regional economies. Economic Research Journal, 5, 95–109.
- Wang, K., Yu, S., & Zhang, W. (2018). China’s regional energy and environmental efficiency: A DEA window analysis based dynamic evaluation. Mathematical and Computer Modelling, 58, 1117–1127. doi:10.1016/j.mcm.2011.11.067
- Watanabe, M., & Tanaka, K. (2007). Efficiency analysis of Chinese industry: A directional distance function approach. Energy Policy, 35(12), 6323–6331. doi:10.1016/j.enpol.2007.07.013
- Yuan, Y., & Xie, R. (2014). Environmental Regulation and the ‘green’ productivity growth of China's industry. China Soft Science, 7, 144–154.
- Zhou, P., & Ang, B. (2008). Linear programming models for measuring economy-wide energy efficiency performance. Energy Policy, 36(8), 2911–2916. doi:10.1016/j.enpol.2008.03.041