
Abstract
The paper explores the existence of differences in local economic outcomes between local government units with and without entrepreneurial zone in Croatia. The analysis is based on the data related to the business results of entrepreneurs, local government budgets and local development during 2004–2016 period. Bivariate statistic methods have been used to analyse whether the differences in business results of entrepreneurs, fiscal performance and level of development at the local level have been determinate by the existence of entrepreneurial zone in the local government unit. The results of this research reveal that entrepreneurial zones are important for the local economic outcomes. The results of empirical analysis confirm that local self-government units with entrepreneurial zones are more successful than units that do not have an entrepreneurial zone. The differences are particularly pronounced when looking at fiscal performance of local government units and business results of entrepreneurs. Investment in establishment of entrepreneurial infrastructure is also positively correlated with the level of local development and level of unemployment.
1. Introduction
The goal of this paper is to analyse the existence of differences in local economic outcomes between local government units with and without entrepreneurial zone in Croatia. The literature confirms that entrepreneurship and local development are interconnected (OECD, Citation2003; Toma, Grigore, & Marinescu, Citation2014; Fritsch and Wyrwich, Citation2017). Therefore, countries encourage entrepreneurship and stimulate creation of new enterprises in various ways to achieve social and economic development. Investments in entrepreneurial infrastructure should stimulate equal economic development within the country. In theory, entrepreneurial zones can contribute to the removal of developmental differences between local government units through their impact on job creation, export competitiveness of entrepreneurs, attracting of foreign investors and improving the productivity of business entities. These effects should have an impact on strengthening economic activity and improving living standards in local self-government units in which they are located.
The process of establishing entrepreneurial zones in the Republic of Croatia started in the 1980s, but peaked its intensity in the period 2004–2013 when more than HRK 3 billion of local and regional self-government units’ funds were invested in development of entrepreneurial zones.
The main motivation of this paper is to investigate the effects of entrepreneurial zones in the Republic of Croatia through grants awarded from the state budget from 2004 to 2013 through the ministry responsible for entrepreneurial infrastructure on the local economic outcomes of local self-government units with entrepreneurial zones compared to economic results in local self-government units without entrepreneurial zones. In this case, the term local economic outcome implies fiscal success of local government units, socio-economic performance and business results of entrepreneurs. The paper also examines the impact of entrepreneurial zones on business results of entrepreneurs. Bivariate statistic methods have been used to analyse whether the variation in fiscal performance, socio-economic performance and development of the entrepreneurial sector have been determinate by the existence of entrepreneurial zone in the county.
The paper consists from the five parts. Next part discusses the determinants of local government success. Third part of the paper explains methodology and data used in the analysis. Empirical findings are presented in the fourth part of the paper, while part fifth brings conclusions.
2. Literature review
The question of how to stimulate local development has become one of the key issues that occupy experts in the recent years. Spatial inequalities in many countries has been increasing (OECD, Citation2016). Increasing awareness about growing spatial inequalities between local units in many European countries has led to greater desire to boost local competitiveness and development. Literature points to a number of factors that are important for stimulating local development. Sienkiewicz (Citation2014) divides them into quantitative and qualitative factors. The quantitative factors, according to Sienkiewicz (Citation2014), include increase in employment, share of local taxes in local budgets, revenues from enterprises, gross domestic product (GDP), investments, production, consumption, while qualitative factors are related to competitiveness of economy, participation of small and medium-sized enterprises (SMEs) in GDP, level of innovation and others. Williams and Vorley (Citation2014) stress the importance of entrepreneurship for economic resilience, competitiveness and growth. Resilient local economy implies ability to adapt and to respond to changes, challenges and threats to the stability from the outside (Malecki, Citation1993). Williams and Vorley (Citation2014) research show that entrepreneurship is important for achieving more resilient economies through larger diversification and capacity building. Countries with larger levels of entrepreneurship are considered to be less exposed to exogenous shocks, as entrepreneurial environments are generally regarded as more creative and flexible than the public sector (Williams & Vorley, Citation2014). In addition, local competitiveness depends on the capability to attract and maintain firms (Huggins & Williams, Citation2011). Establishment of entrepreneurial zones should in this sense have positive effects on local development.
Local development as important outcome is influenced by many factors. The size and structure of revenues in the city budget, including the level of fiscal autonomy, is one of the factors that have an impact on local development. Local fiscal autonomy has many definitions. Definition given by Wolman and Goldsmith (Citation1990) consider fiscal autonomy as the capacity of the sub-national government to have an independent power on the prosperity of the residents in the local community. Chapman’s (Citation1999) definition of fiscal autonomy relates to the capacity of the local authority in increasing adequate revenues and decision on spending those revenues. Other researchers, Pierre (Citation1990) and Pratchett (Citation2004), highlight the importance and type of financial resources for autonomy of local authorities. There are several researches that measure and compare local autonomy among European countries. For example, Ladner, Keuffer, and Baldersheim (Citation2015) found four groups of countries with different level of fiscal autonomy. The first group is a cluster of countries with a high degree of autonomy (Denmark, Finland, Sweden, Norway and Iceland); the second group consist of countries with a medium-high degree of autonomy (Switzerland, Germany, Poland, Liechtenstein, Italy, Serbia, France, Bulgaria, Lithuania, Czech Republic, Austria and Estonia); the third group is a cluster of countries with a medium degree of local autonomy (Slovak Republic, Portugal, Belgium, Netherlands, Macedonia, Romania, Croatia, Luxembourg, Latvia and Spain) and the fourth group of countries consist of countries with a medium-low degree of autonomy (Hungary, Albania, Slovenia, Ukraine, Greece and the United Kingdom). All of four groups of countries differ in the level of fiscal autonomy. Jurlina Alibegović, Hodžić, and Bečić (Citation2019) measure the level of fiscal autonomy of cities that have been identified as conductors of local development activities in Croatia, Serbia and Bosnia and Herzegovina. Their research results indicate that the current structure of large cities’ budgets with income tax as the main revenue source of large cities in Croatia and Serbia and indirect taxes are the main sources of revenue for large cities in Bosnia and Herzegovina is a constraint for making decisions about local development projects in these countries.
Sosnovskikh (Citation2017) analyse the government activities in entrepreneurial zones in Russia to develop and diversify exports, create jobs and launch technology and knowledge sharing. The Russian government activities include various greenfield and brownfield projects in entrepreneurial zones, including an established communal infrastructure and low taxes. Stojčić (Citation2012) analyses relationship between export intensity and the firms’ location in small urban areas or free trade zones in Croatia. His research shows positive results on the development of export-targeting policies that may have produced beneficiary effects on the competitiveness of exporters. Entrepreneurial activities and the competitive profiles of exporters can stimulate economic growth (Lall, Citation2000). Cini and Varga (Citation2009) believe that the basic objective of establishing entrepreneurial zones is the economic development of the county, attracting capital and potential investors, building business facilities, which is evident in increasing the number of employees, increasing exports, increasing GDP and the standards of people in the county, bringing new technologies and the introduction of European and world standards in the process of production, bringing fresh capital to counties, penetration into the world (global) market, and the risk of full business is exclusively for zone users without any guarantees from the state or local self-government units.
Šmaguc and Vuković (Citation2018) have made research on investment efficiency of municipalities and towns in two Croatian counties (Varaždin and Međimurje). They used data envelopment analysis and output variables were number of active entrepreneurs in entrepreneurial zones and number of employees in entrepreneurial zones. Research results have shown that limited number of local self-government units in the analysed area is relatively efficient.
Fritsch and Wyrwich (Citation2017) presented that the number of self-employed people represents one of entrepreneurial role models. They used data on the number of self-employed people as an instrument to measure the effect of start-up activity on regional growth. The results of their research showed statistically significant and strong relationship between historical self-employment and the start-up rate.
The theoretical literature lacks research on determinants of local government outcomes. It is generally assumed that one of the key conditions for stimulating economic growth is to increase entrepreneurial activity. Entrepreneurial zones represent an often used way to encourage local development. It is assumed that the establishment of entrepreneurial zones has positive effects on the development of local units, both in terms of strengthening fiscal capacity and in terms of overall social and economic development. Active entrepreneurial zones should contribute to the development of local potentials by creating investment opportunities, development of small and medium entrepreneurship, and the overall development of the local community and society.
3. Methodology and sample
Entrepreneurial infrastructure includes entrepreneurial zones and business support institutions in Croatia (Act on Improving Entrepreneurial Infrastructure, Official Gazette 93/2013, 114/2013, 41/2014, 57/2018). Entrepreneurial zones are defined as infrastructural equipped areas defined by spatial plans, intended for performing certain types of entrepreneurial or economic activities. The basic characteristic of entrepreneurial zones is the shared use of infrastructure and organised area by entrepreneurs whose location within the entrepreneurial zone enables the rationalisation of the business costs and the use of the available resources of the entrepreneurial zone together with other users of the entrepreneurial zone. Entrepreneurial zones are defined on the basis of following criteria: (i) the size of the total area of the entrepreneurial zone, (ii) the type of activity within the entrepreneurial zone and (iii) the intensity of activation of the available area of the entrepreneurial zone. The Register of entrepreneurial zones is part of the Unified Register of Entrepreneurial Infrastructure, which is an integrated database consisting of the Register of entrepreneurial zones and the Register of entrepreneurial support institutions.
The establishment of entrepreneurial zones in the Republic of Croatia started in the 1980s. A more serious consideration of the importance of entrepreneurial zones for the development of local units has occurred only since 2004. According to spatial planning documentation, it was planned to establish 1,308 entrepreneurial zones in Croatia. But a much smaller number was really established. There are 532 entrepreneurial zones within the Unified Register of Entrepreneurial Infrastructure. Nevertheless, it should be noted that all units of local self-government in the Republic of Croatia have undertaken activities of greater or lesser intensity for the establishment of entrepreneurial zones by the end of 2013.
From the 532 entrepreneurial zones, for only 195 entrepreneurial zones data have been verified, meaning that all data and documentation have been submitted and checked. However, the analysis in the next part of the paper have been conducted for all 532 entrepreneurial zones.
According to the intensity of activation of the available area of the entrepreneurial zone, out of a total of 532 entrepreneurial zones, 28 percent of them are medium active, meaning that the degree of activation of the zone ranges from 33 percent to less than 66 percent of the available area of the zone, expressed in hectares of area entrepreneurial zones. Furthermore, 23 percent of the entrepreneurial zones are inactive, meaning that there were no active entrepreneurs in the zone after one year from the establishment of the entrepreneurial zone. A further 20 percent of the entrepreneurial zones are categorised as zones in initial activation, i.e., the degree of zone activation is less than 33 percent of the available area of the zone. Only 16 percent of entrepreneurial zones in the Unified Register of Entrepreneurial Infrastructure belong to the category of fully active zones, i.e., entrepreneurial zones in which the degree of activation is greater than 66 percent of the available area of the zone.
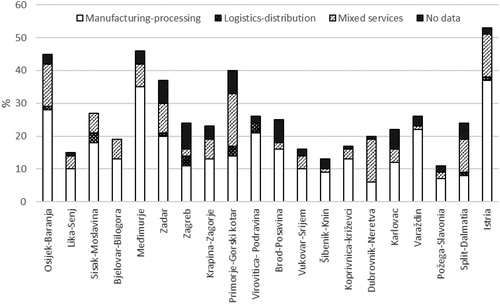
Looking at the type of activity, entrepreneurial zones are mostly used by manufacturing and manufacturing entrepreneurs, and 61 percent of the zones are manufacturing-processing zones. Another 23 percent of the zones are mixed-service zones. Three percent of entrepreneurial zones are logistics-distribution zones. For 13 percent of entrepreneurial zones there are no data on the type of activity in the Unified Register of Entrepreneurial Infrastructure.
In the other hand, the most entrepreneurial zones belong to the micro (43.6 percent) and small zone groups (41.4 percent). The rest of zones belong to medium and large group of zones. There are no data for 0.4 percent of zones (see ).
Figure 1. Entrepreneurial zones by the size and regional location.
Source: Unified Register of Entrepreneurial Infrastructure.
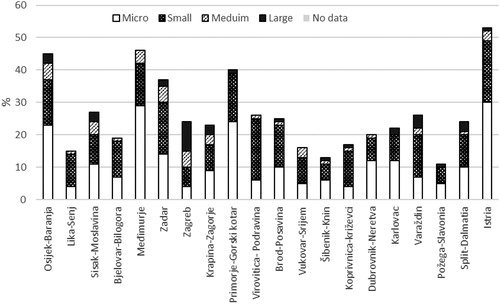
Observed by the size of the total area, entrepreneurial zones in the Republic of Croatia are mainly micro or small-sized entrepreneurial zones. Thus, around 85 percent of entrepreneurial zones have a size smaller than 50 hectares (see ).
Figure 2. Entrepreneurial zones by the intensity of activation of the available area of the entrepreneurial zone and regional location.
Source: Unified Register of Entrepreneurial Infrastructure.
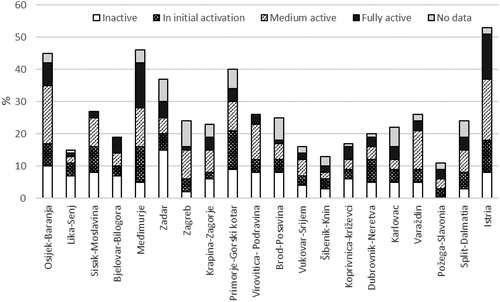
The structure of entrepreneurial zones by counties varies considerably (see ). In Međimurje and Istria County more than 30 percent of the entrepreneurial zones are fully active, while on the other hand 47 percent of the entrepreneurial zones in Lika-Senj County are inactive.
Figure 3. Entrepreneurial zones by the type of activity and regional location.
Source: Unified Register of Entrepreneurial Infrastructure.
The goal of the paper is to examine the differences in developmental performance between local governments which have entrepreneurial zones in their area and those without such zones. In the context of this analysis, under developmental performance, it is considered the fiscal performance and socioeconomic performance of local self-government units, as well as business performance of entrepreneurs operating within the local unit (data sources are given in Appendix, .). As shown in , developmental performance of the two categories of local self-government unit is measured by 16 variables. Thereby, 6 variables are generated from fiscal data, 7 variables refer to the measurement of socioeconomic performance, while 3 variables relate to business performance of entrepreneurs in local self-government units. The empirical analysis is divided into three segments. In the first segment we test the differences in mean values of variables representing several aspects of fiscal performance between two groups of local units. In the second segment the variation of socioeconomic outcomes in towns and municipalities which may stem from the fact that there is or is no entrepreneurial zone in the local unit area. The third segment of the analysis investigates the differences between business performance of entrepreneurs operating in the observed groups of local units. In order to test our assumptions, the independent sample t-test is used.
Table 1. Sample, n = 532.
Fiscal performance of local units is measured by the level of achieved revenue at the local budgets, tax income, income from communal fees and tax on company expenditure, and by expenditures for capital works. The average annual values for the period from 2008 to 2016 were used. As a measure of socioeconomic development of local self-government units, the development index and its selected components are used (period 2014–2016): average income per capita, unemployment rate, population change, ageing index and rate of education. For measuring differences in business performance of entrepreneurs as to whether they come from local self-government units with entrepreneurial zones or those units without such zones following variables are used: number of registered entrepreneurs, annual yearly revenue for entrepreneurs and average annual number of persons employed by the entrepreneur. The average annual values for the period from 2008 to 2016 were used. It should be noted that the City of Zagreb has been left out of the analysis because there are no entrepreneurial zones in its area.
4. Results
4.1. Fiscal performance
The first segment of the analysis tests the differences in fiscal performance between local governments which have entrepreneurial zones in their area and those without such zones. The difference in fiscal performance of the two observed groups of local self-government units is shown in . The results of the analysis indicate a statistically significant difference in the level of achieved revenue for local budgets, tax income and expenditure for capital works, which are in favour of local governments with entrepreneurial zones. Although the local self-government units with entrepreneurial zones on average achieve higher income from communal fees and tax on company, the differences are not statistically significant.
Table 3. Comparison of mean values of fiscal performance indicators for local self-government units, t-test.
Hence, local self-government units with entrepreneurial zones, achieved in the observed period from 2008 to 2016 on average 60 percent more total revenue for their budgets than local self-government units without entrepreneurial zones (HRK 25.3 million compared to HRK 15.8 million, p < 0.05). At the same time, local governments with entrepreneurial zones also recorded a tax income which was greater by 64.6 percent, tax on company greater by 37.2 percent and revenue from communal services greater by 6 percent (p < 0.1). In addition, the analysis comparing capital works indicates a significantly greater average amount of yearly funds which towns and municipalities with zones invest in non-financial assets (HRK 6.1 million) compared to local self-government units without zones and which during the same period recorded on average capital works amounting to HRK 3.6 million (p < 0.01). On the other hand, when comparing these two local government groups based on levels of own-source income per capita, it becomes evident that local governments which do not have entrepreneurial zones achieved in this category greater budget revenue, i.e., HRK 2,520 per capita (the average from 2014 to 2016), whereas own-source income per capital in towns and municipalities with entrepreneurial zones amounted to HRK 2,267. However, these differences are not statistically significant.
4.2. Socioeconomic performance
In the second segment, analyses examine differences between the socioeconomic performances of the two categories of local self-government units. Generally, local self-government units with entrepreneurial zones are larger not only in terms of the number of inhabitants (on average, 7,489 persons) (p < 0.01), but also in terms of area (154.8 km2) (p < 0.1). On the other hand, towns and municipalities in which there are no entrepreneurial zones have on average only 4,080 inhabitants and cover an average area of 76.5 km2. Results from the statistical analysis relating to the socioeconomic performance of the two categories of local self-government units indicate statistically significant differences in the age structure of the populations, the achieved average personal income per capita and the number of inhabitants (). Differences are also present in the educational structure of the population and unemployment rate. However, these differences are not statistically significant.
Table 4. Comparison of mean values of socioeconomic performance indicators of local self-government units, t-test.
Analysis results for average values of selected demographic variables relating to these two groups of local self-government units suggest the existence of statistically significant differences for the ageing index, whereas the values for the general population mobility index does not indicate significant differences. Interpreting these average values for the ageing index requires consideration of the fact that this index generally assumes unfavourable values and indicates an unfavourable population age structure in almost all local self-government units in the Republic of Croatia (persons in the age group of 60 years of age and older). Nonetheless, local self-government units with entrepreneurial zones recorded the lowest (more favourable) average value for the ageing index, i.e., 124.1 percent, whereas self-government units without zones recorded an average value of 149.7 percent (p < 0.01) for the ageing index. Therefore, the conclusion that towns and municipalities with entrepreneurial zones generally exhibit a more favourable population age structure in comparison to towns and municipalities with no zones. Accordingly, when considering changes in the number of inhabitants in the period from 2006 to 2016, clearly shows almost no difference, meaning local self-government units with entrepreneurial zones recorded on average a decrease in their population by 6.9%, whereas that figure is 7% for towns and municipalities without zones. Furthermore, when considering the issue of the quality of human resources measured as the proportion of persons belonging to the age group of 20 to 64 years of age and possessing a tertiary education and when compared to the total number of inhabitants of that age group, there is no difference between these two local self-government units. Hence, for towns and municipalities that have entrepreneurial zones on their territory, on average 12.6% of their population come from the age group of 20 to 64 years of age and also possess the described level of education.
Table 2. Descriptive statistics.
Another interesting comparison is the difference between local self-government units with and without zone entrepreneurial zones in terms of the average unemployment rate. The unemployment rate is a useful indicator, not only in that it measures imbalance between labour demand and supply, but can also be used as an indirect measure of the economic strength of the local economy, local poverty and social inclusion of the local population. The results of the statistical analysis indicate that there is a difference between the two categories of local self-government units in terms of the average unemployment rate which specifically favours local self-government units with entrepreneurial zones. Hence, for the period from 2014 to 2016, these units on average recorded a lower unemployment rate, i.e., at 17.4 percent, whereas towns and municipalities without zones recorded an average unemployment rate of 18.5 percent.
The statistically significant differences between the observed two groups of local self-government units have been determined on the basis of average personal income per capita, which on average is 7 percent more in local self-government units with zones compared to those without zones (HRK 25,025.10 compared to HRK 23,402.80, p < 0.01).
Differences also exist in terms of the average value for the development index which has been introduced to obtain an optimally objective measure of the level of development in all local and regional self-government units in the Republic of Croatia. While local self-government units without zones exhibit below-average development (98.6 percent), the value of the development index for local self-government units with entrepreneurial zones is on average 100 percent, i.e., at the national average level. These differences, however, are not statistically significant.
4.3. Level of development of the entrepreneurial sector
This segment involves testing differences in business performance of entrepreneurs as to whether they come from local self-government units with entrepreneurial zones or those units without such zones. The results shown in lead to the conclusion that there is statistically significant difference between those local self-government units with and those without entrepreneurial zones in terms of the average number of registered entrepreneurs, annual yearly revenue for entrepreneurs and average annual number of persons employed by the entrepreneurs.
Table 5. Comparison of mean values of business performance indicators for entrepreneurs in local self-government units, t test.
Towns and municipalities with entrepreneurial zones recorded a significantly greater number of registered entrepreneurs, on average 168 entrepreneurs a year, whereas the number of registered entrepreneurs was 66 (2008–2016) (p < 0.1) in local self-government units without zones. Furthermore, the average annual revenue for entrepreneurs registered in towns and municipalities with entrepreneurial zones amounted to HRK 655.9 million, which was more than twice (111.9 percent) the average annual revenue in local self-government units without entrepreneurial zones (HRK 309.6 million) (p < 0.05). Based on the number of employed by entrepreneurs, local self-government units with entrepreneurial zones are also leading the way. Hence, towns and municipalities with entrepreneurial zones recorded twice as many employed by entrepreneurs (1,225 workers), whereas entrepreneurs in local self-government units without zones employed overall an average of 611 workers (p < 0.05).
5. Conclusion
The underlying premise of investing in entrepreneurial infrastructure is the expectation that the construction of the infrastructure and investment in entrepreneurial zones can stimulate equal local development and decrease the regional differences. Basic mechanisms for achieving this goal in Croatia are strengthening of small and medium-sized enterprises, increasing the share of production-processing activities in the economy structure and creation of new jobs. Croatian government over the period 2004–2013 tried to stimulate entrepreneurship by giving grants for the establishment of entrepreneurial zones. In a significant number of municipalities and cities, these investments were also supported by the investment of local self-government units and resulted in the adoption of measures for the establishment of entrepreneurial zones and attracting investors. This paper puts more light on the importance of investing in the development of entrepreneurial zones. Over the past period, investment in the entrepreneurial infrastructure have resulted in the active entrepreneurial zones only in a number of cases, and the process of establishing entrepreneurial zones has proceeded with uneven intensity. Prior to further investment, it is necessary to further identify the factors that have led to the successful activation or absence of activation of some entrepreneurial zones. Certainly, the transfer of experience and knowledge increases the likelihood of successful activation of entrepreneurial zones. By 2016, less than one third of all entrepreneurial zones were fully active.
The results of this research suggest that entrepreneurial zones are important for the local economic outcomes. The results of empirical analysis confirm that local self-government units with entrepreneurial zones are more successful than units that do not have an entrepreneurial zone. The differences are particularly pronounced when looking at fiscal performance of local government units and business results of entrepreneurs. The analysis confirms the existence of positive and statistically significant differences in fiscal success between local government units with and without entrepreneurial zones. This suggest that investment of local government units in establishment of entrepreneurial zones partly returns to local units back through increased budgetary revenues. On average, local units with entrepreneurial zones have younger and more educated population, higher average income and lower unemployment rate and this is very important also for further development of the entrepreneurial sector.
This research identifies differences between local units with and without entrepreneurial zones, which is the first step in the study of the impact of entrepreneurial zones on local economic development. The results confirm that there are statistically significant differences in successfulness of local government units which have entrepreneurial zone compared to those which do not have it. Having in mind that literature show that there are increasing special inequalities between local government units in many European countries including Croatia, and confirm the positive effects of the entrepreneurship on local competitiveness and resilience, results of our research show that encouraging the creation of entrepreneurial zones could have the positive effects on the business results of entrepreneurs, fiscal performance of local government units, but also some wider spatial implications. Interactions between businesses could lead to spill-over effects in neighbouring cities and municipalities, thus generating wider positive effects on productivity, revenue from the sale of goods and services, and job creation. However, based on the results obtained, conclusions could not be drawn on clear causal-effect relationship between establishment of entrepreneurial zones and the local economic outcomes, which is also the main limitation of this study. Future investigations are therefore necessary to investigate the causal relationship between those variables.
Disclosure statement
No potential conflict of interest was reported by the author(s).
References
- Act on improving entrepreneurial infrastructure, official gazette 93/2013, 114/2013, 41/2014, 57/2018.
- Chapman, J. I. (1999). Local government. Fiscal autonomy and fiscal stress: The case of California (Lincoln Institute of Land Policy Working Paper 99JC1). Cambridge, MA: Lincoln Institute of Land Policy.
- Cini, V., & Varga, D. (2009). Poslovne zone – bitni elementi gospodarskog razvoja Varaždinske županije. Ekonomski Vjesnik: Review of Contemporary Entrepreneurship, Business, and Economic Issues, 22(1), 63–76.
- Croatian Bureau of Statistics. Census 2011. Retrieved from https://www.dzs.hr/Hrv_Eng/publication/2012/SI-468.pdf
- Financial Agency. (2017). Annual financial report of entrepreneurs for 2004–2016 period, database. Zagreb.
- Fritsch, M., & Wyrwich, M. (2017). The effect of entrepreneurship on economic development—an empirical analysis using regional entrepreneurship culture. Journal of Economic Geography, 17(1), 157–189. doi:10.1093/jeg/lbv049
- Huggins, R., & Williams, N. (2011). Entrepreneurship and regional competitiveness: The role and progression of policy. Entrepreneurship & Regional Development, 23(9–10), 907–932. doi:10.1080/08985626.2011.577818
- Jurlina Alibegović, D., Hodžić, S., & Bečić, E. (2019). The level of fiscal autonomy: Evidence from Croatia, Serbia and Bosnia and Herzegovina. NISPAcee Journal of Public Administration and Policy, 12(1), 91–112. doi:10.2478/nispa-2019-0004
- Ladner, A., Keuffer, N., & Baldersheim, H. (2015). Local autonomy index for European countries (1990 –2014). Release 1.0. Brussels: European Commission.
- Lall, S. (2000). The technological structure and performance of developing country manufactured exports. Oxford Development Studies, 28(3), 337–369. doi:10.1080/713688318
- Malecki, E. J. (1993). Entrepreneurship in regional and local development. International Regional Science Review, 16(1–2), 119–153. doi:10.1177/016001769401600107
- Ministry of Finance. (2018). Local and regional budgets for the 2014–2016 period, database. Retrieved from http://www.mfin.hr/hr/ostvarenje-proracuna-jlprs-za-period-2014-2017
- Ministry of Regional Development and EU Funds. (2018a). Decision on classification of local and regional self-government units according to the level of development, Official Gazette 132/2017, Zagreb.
- Ministry of Regional Development and EU Funds. (2018b). Values of development index and indicators for calculation of development index according to new model of calculation at the local level (2014–2016 period). Zagreb.
- OECD. (2003). Entrepreneurship and local economic development: Programme and policy recommendations. Paris: Local Economic and Employment Development (LEED), OECD Publishing. doi:10.1787/9789264199798-en
- OECD. (2016). OECD regions at a glance 2016. Paris: OECD Publishing. doi:10.1787/reg_glance-2016-en
- Pierre, J. (1990). Assessing local autonomy. In King, D., S. King, & J. Pierre (Eds.), Challenges to local government (pp. 37–54). London: Sage Publications.
- Pratchett, L. (2004). Local autonomy, local democracy and the ‘new localism. Political Studies, 52(2), 358–375. doi:10.1111/j.1467-9248.2004.00484.x
- Sienkiewicz, M. W. (2014). Local economic development policy in Poland: Determinants and outcomes. Zbornik radova Ekonomskog fakulteta u Rijeci: časopis za ekonomsku teoriju i praksu, 32(2), 405–427.
- Šmaguc, T., & Vuković, K. (2018). Assessment of the efficiency of investment in entrepreneurial zones in Croatia using data envelopment analysis. IISES Annual Conference, Sevilla. doi:10.20472/IAC.2018.035.040
- Sosnovskikh, S. (2017). Industrial clusters in Russia: The development of special economic zones and industrial parks. Russian Journal of Economics, 3(2), 174–199. doi:10.1016/j.ruje.2017.06.004
- Stojčić, N. (2012). The competitiveness of exporters from Croatian manufacturing industry. Ekonomski Pregled, 63(7–8), 424–445.
- Toma, S.-G., Grigore, A.-M., & Marinescu, P. (2014). Economic development and entrepreneurship. Procedia Economics and Finance, 6, 436–443. doi:10.1016/S2212-5671(14)00111-7
- Williams, N., & Vorley, T. (2014). Economic resilience and entrepreneurship: Lessons from the Sheffield City Region. Entrepreneurship & Regional Development, 26(3–4), 257–281. doi:10.1080/08985626.2014.894129
- Wolman, H., & Goldsmith, M. (1990). Local autonomy as a meaningful analytic concept. Comparing local government in the United States and in the United Kingdom. Urban Affairs Quarterly, 26(1), 3–27. doi:10.1177/004208169002600101