
 ?Mathematical formulae have been encoded as MathML and are displayed in this HTML version using MathJax in order to improve their display. Uncheck the box to turn MathJax off. This feature requires Javascript. Click on a formula to zoom.
Abstract
This paper proposes a statistical model for identifying which contexts favour the growth of populism in European democracies by analysing the relationship between the Human Development Index (HDI) and the Corruption Perception Index (CPI). With the aid of United Nations (UN), Transparency International Organization and Institute for Global Change data for the years 2013-2017, and after applying statistical convergence, our study identifies different clusters of European democracies where populism has grown after serious episodes of social conflict in the wake of one of the most important financial and economic crises in recent history. The study’s findings provide new insights which help to identify weaknesses in democracies where populist parties could grow.
Keywords:
1. Introduction
One of the strengths of the European Union is its dimension: 550 million people in 28 member-states covering over 4 million square kilometres and sharing monetary, economic and political synergies. One of its weakness is the consequence of the domino effect: the impacts and threats to one of the EU’s members are to the loss of all as the recent international crisis demonstrates.
The leaders of the Harvard University-European Parliament Project, Mark Esposito and Jorgo Chatzimarkakis, defined the crisis as “the subsequent massive build-up of debt” (2014, p. 3). In 2013, “the total debt represented a percentage of annual economic output had risen above 300% for France, Italy, and Spain and above 250% for Greece. Even in fiscally conservative Germany, total debt as a percentage of annual economic output was approximately 240%”. A major crisis hit Europe and governments had to face different social conflicts as a consequence of despair (unemployment) and mistrust (political corruption). This environment of social conflicts is one of the most congenial to the rise of populism (understood as extremist ideologies from left to right).
This paper was motivated by an interest in the rise of populism in European democracies as a result of their very weaknesses. Our first step was to establish a frame for the pre- and post-crisis (2013–2017) periods using tried and tested international indicators like the Human Development Index and the Corruption Perception Index.
The Human Development Index (HDI) includes variables such as a country’s life expectancy and health, knowledge, decent standard of living, environmental sustainability, human security and rights and gender equality (Human Development Report Office, 2015). The Corruption Perception Index (PCI) captures perceptions of the extent to which public power is exercised for private gain, including both small- and large-scale corruption, as well as the “hijacking” of the state by elites and private interests.
Exploring the relationship between both indicators was the second step in our research. We identified risk scenarios during the crisis where social conflict could trigger political populism in European democracies.
Dittrich (Citation2017) has explained how “in the case of Germany, a particularly strong rise in interaction with “AfD” is connected to the refugee crisis of 2015. The Italian anti-establishment Five-Star Movement saw large gains linked to their mobilization against the Italian constitutional referendum in December 2016.”
The data examined by Dittrich (Citation2017) measured growth in Facebook fan numbers and interaction rates among populist parties and movements in France, Germany, Italy and Spain between 2015 and March 2017.
Dittrich (Citation2017) and Casero-Ripollés, (Citation2017) have identified the development of social networks as the key factor in the emergence of populist parties after a social conflict.
Virality and the speed at which social networks transmit the political messages of populist parties have been identified as an important factor in their growth. As Dittrich (Citation2017) puts it, “in the case of France, Marine Le Pen and Jean-Luc Mélencthon have been dominating social networks for the last two years and are relying on them heavily in the 2017 presidential campaign. In Spain, on the other hand, the mobilization of Podemos on social networks seems to have reached its peak and is now in steady decline” (Dittrich, Citation2017, p. 1).
The previous literature points out that populist governments actively reduce economic freedom and legal security, and tighten economic regulation (Rode & Revuelta, Citation2015), while their growth is triggered by social conflicts which can be observed through unemployment and debt ratio indicators, the first alarm signals of falling competitiveness.
After taking the raw data of the European Regional Competitiveness Index for the years 2013-2017 and applying statistical convergence, our study identified different clusters of European democracies where populism grew after serious episodes of social conflict in the wake of one of the severest financial and economic crises in recent history (Esposito, et al., Citation2014).
The paper proceeds as follows: we begin by discussing earlier work on different definitions of human development and its relationship to corruption and populism; we then set out the data and the method used for estimation; next, we present and discuss our results; and finally, we draw some conclusions and explain the limitations of our research.
2. Literature review
At time of writing, there is no generally accepted definition of populism. Aslanidis (Citation2016) has identified as one of the most cited definitions Cas Mudde’s of fifteen years ago (Mudde, Citation2004, p. 543). Mudde argued that populism is ‘an ideology that considers society to be ultimately separated into two homogeneous and antagonistic groups, “the pure people” versus “the corrupt elite”, and which argues that politics should be an expression of the volonté générale (general will) of the people’.
Rode and Revuelta (Citation2015) have explored different definitions –of an economic, structural, political-institutional or discursive nature—in the literature on populism, one of the most conclusive of which was put forward by Edwards (Citation2010), who recognized that populism is not the monopoly of the left but exists on the right as well. That means that extremist ideologies appear in democracies which have been weakened as a result of economic crisis–unemployment, uncontrolled immigration or any other social conflict.
Disciplines such as political science, human development, marketing and communication, economics and big data (which studies the impact of social networks around the world) have found in populism a fruitful field for research. Aslanidis (Citation2016) has proposed the building of an interdisciplinary analytical framework to stimulate quantitative work. This approach is interesting in its identification of populism as a complex phenomenon requiring interdisciplinary study. The impact of populism is clear, but the means by which it expands or is restricted in democracies, especially European ones, have yet to be explored.
Recent research has shown that phenomena like social networks are a means of expanding populism, which can grow in societies where the presence of social networks is significant (Dittrich, Citation2017, Casero-Ripollés, Citation2017).
In a similar direction, other studies have examined the media’s impact on support for the agents of populism. These studies have generally found a link (in some countries) between the prominence of anti-immigration issues in the news and support for anti-immigration parties, even when controlling for other factors (Boomgaarden & Vliegenthart, Citation2007, Citation2009; Gerstlé, Citation2003).
That said, the growth of populism in Europe is a key fact in democracies in the early decades of this century. The recent major financial crisis in Europe (2013–2017) propitiated an environment which strengthened emotions like despair in the face of unemployment and mistrust due to political corruption, one of the main weapons populisms (extremist ideology) wields in its campaigns against traditional parties. This paper studies the European environment before and after the crisis with the aid of two variables which are acknowledged and measurable in all of them: Human Development and Corruption.
2.1. Why were these variables selected?
Human development encompasses health, nutrition and basic education as ends in themselves and as a means to achieving that development (Anand & Sen, Citation1994). The Human Development Index is the starting point for any attempt to understand how a country responds to different economic and social challenges. In this connection, Ul Haq (Citation1995) provides an interesting review of the concept and introduced other variables in the index with a view to tightening the fit between concept and reality. One such variable was corruption, which can help to explain radical changes in a democracy, even when there are high values for the Human Development Index.
For that reason, this paper studies the relationship between human development and corruption as providing the framework within which populism might grow in cases of social conflict.
3. Model and methodology
This paper proposes a model for analysing the relationship between human development and corruption in Europe (EU-28) during the economic, social and financial crisis of 2013-2017. The impact of this crisis on the EU citizens was to erode their optimism and hope in the wake of various social conflicts which emerged on account of such variables as unemployment, immigration and political corruption and led to increased lack of confidence in their democracies (see ).
Figure 1. The proposed model (author’s design).
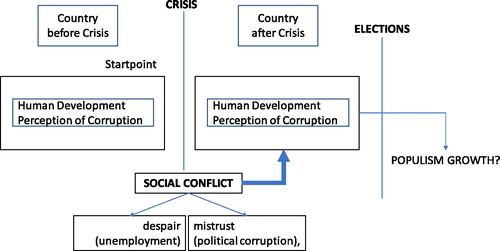
Our model is based on our two hypotheses:
H1: A higher HDI value correlates to lower levels of corruption in a region.
H2: There is a direct relationship between vote swings in favour of populist parties and an increased value for a country’s CPI. There is an indirect relationship between vote swings in favour of populist parties and an increased value for a country’s HDI.
We obtained the variables from the United Nations (UN) Human Development Index (HDI), available at http://hdr.undp.org/en. This index includes information on three basic dimensions that measure a region’s level of development: life expectancy at birth (health), expected years of schooling (education) and gross national income per capita (wealth). We have used the composite index to make comparisons over time since the methodological criteria for measuring these variables tend to change every year. In addition, in a ranking of the different countries analysed we provide information which complements the index’s values.
The Corruption Perception Index (CPI) is published by the Transparency International Organization (https://www.transparency.org/). The scale of the index is from zero points (highest level of corruption) to one hundred points (lowest level of corruption) in the public sector. According to its publishers, the index is based on the opinion of a panel of experts and executives and covers different types of administrative and political corruption like bribes, embezzlement of public funds, etc. Since the method for collecting data changed after 2012, the data sequence available corresponds to the period 2013–2017.
We also used the populism database of the University of Melbourne (reproduced by the Institute for Global Change – https://institute.global/) to obtain information about election results and the percentages achieved by populist parties (of the extreme right and left). This database classifies political parties as populist as a function of their opposition to the current political system or to financial institutions and their heavy dependence on one leader. The database further presents the evolution of the percentage of votes won by populist parties in the period 2008–2018. For the purposes of this paper, we consider a country to have a high degree of populism in two circumstances: (a) when populist party votes exceed 25% of the total number of votes, thereby implying considerable capacity to influence governments, or when populist parties have grown more than 25% in the analysed period.
Finally, we used variables associated with the unemployment rate (for example, the ratio of total unemployment with respect to the active population) as well as the percentage of immigrants over the total population obtained from the Eurostat database (https://ec.europa.eu/eurostat/). For our purposes, the concept of immigrant refers to people who have lived in a country for at least twelve months but were born in another.
In short, the variables are as follows: CPI (Corruption Perception Index), HDI (Human Development Index), Vot (percentage of votes of parties considered populist), Unem (unemployment population), Imm (percentage of immigrants with respect to the total population). The abbreviation “Var” stands for the measure of the variation rate (see ). A convergence analysis was performed for the different countries with respect to CPI and HDI in order to derive a variable which relativized the position of each country among the total studied.
Table 1. Database from EU-28 (2013–2017) (source: the author).
In view of our methodology, we present a descriptive analysis based on the evolution of the different variables and focusing on the relationship between the CPI and the HDI of the 28 EU countries. In this connection, we used a matrix of regional convergence with respect to the evolution of the two main variables in relative average terms for the 2013–2017 period.
The behaviour of the different variables—more than proportional growth of decrease with respect to the other countries—allowed us to determine whether there had been real convergence or divergence among the European countries. To be more precise, the matrix analysed four types of regions: those that diverge negatively in both variables, those that diverge positively, those that converge positively in both variables and those that converge negatively. This technique is common in regional economic studies (Quah, Citation1996; Barro & Sala-i-Martín; 1992; Daveri, Citation2002).
We also devised a regression model to determine the effects of these variables on the increase of populism in European regions. The dependent variable is the variation in the percentage of votes obtained by the populist parties, while the independent variables are variation in CPI, HDI, unemployment rate and percentage of immigration. The data studied all belongs to the period 2013–2017 except for election results, which start in 2008 in order to include the birth of populist parties in Europe. Countries were classified according to the variation in populism over time.
The first model presented analysed variation in votes as a function of the rest of the variables, thereby avoiding any collinearity. However, the HDI variable was excluded when analysing the voting process of 2007 in order to avoid possible collinearities.
4. Discussion and results
With the aid of descriptive linear regression, we obtained EU-28 data for 2013-2017 and the variation rate. The only exception, due to the available data, was the populist vote percentage and the immigration percentage variables, which were considered for the year 2010 and 2017, respectively.
Although there was disparate behaviour across the countries, on average CPI improved everywhere except Hungary and Cyprus, whose positions in the ranking fell. The reverse was true of Czech Republic and Romania where, despite starting from low positions in the ranking, perception of public institution management improved considerably. As for HDI, there was barely any improvement in the period considered, with an average growth of just over one percentage point. The sole exception was Denmark, the only country where HDI fell. The greatest variations were to be observed in the variable indicating the percentage of votes won by populist parties in their respective legislative elections.
shows the values of the variables for the studied period and their variation over the time. It also indicates the average value and the standard deviation for the sample of countries.
The average trend indicates that in just ten years the electorate achieved by these parties doubled, especially in countries such as Spain, Italy, Croatia and Romania. As for the percentage of unemployed population, it fell in all EU countries, while the percentage of the immigrant population increased considerably. Both variables could explain the emergence and expansion of populist parties, due initially to the policies for restructuring labour implemented during the crisis and later to immigration policies.
If we analyse the model, a direct relationship can be observed between the HDI and the level of corruption (). This becomes more solid and closer over time in line with the high results for R squared. In this connection, the position of the country in the ranking improves with respect to higher HDI.
Figure 2. Relationship between HDI CPI (source: the author).
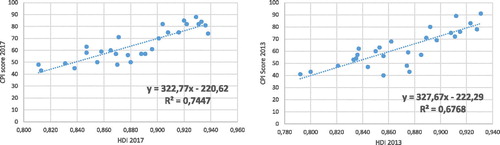
However, it is interesting to observe the behaviour and evolution of both variables for different countries. Our analysis considered the relative position of each region compared with the average for the group of countries. Thus, for the year 2013, in the set of European countries considered average HDI was 0.87 and the average position in the CPI ranking was 63.29. These values changed to 0.88 and 64.64 respectively at year-end 2017. These positions determine the relative positioning of the countries.
At the same time, there was high correlation between the indices since for both periods those countries with a higher than average HDI corresponded to those with an above average position in the CPI. The only exceptions were Slovenia, Italy and Spain with above average HDI but below average CPI. If we analyse the evolution of these two variables over time, four categories of countries can be observed (see ):
Figure 3. Relationship between HDI CPI (source: the author).
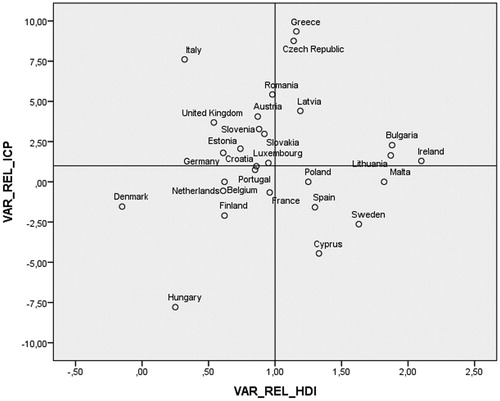
Countries with a positive, above EU-average variation rate in HDI and CPI: Bulgaria, Czech Republic, Greece, Ireland, Latvia and Lithuania. It is noteworthy that all these countries, except Ireland, were able to reduce the perception of corruption in their regions. The case of Greece was significant because it rose more than eight positions in the ranking in the period analysed. This improvement in perception was accompanied by an increase in its HDI which was more than proportional to the EU average. Notwithstanding these improvements, these countries started from positions below the EU average and continued to maintain lower relative positions at the end of the period.
Countries with lower HDI growth in comparison with the group of EU countries but with an improvement in CPI which was more than proportional to the rest of EU countries: Luxembourg, Germany, United Kingdom, Italy, Estonia, Romania, Slovakia and Slovenia. The first three countries diverged completely from other countries to achieve better CPI positions despite slower HDI growth, which was justifiable considering their high HDI values. The other countries were still in lower positions than the European average, despite obtaining better positions in the ranking during the 2013-17 period.
Countries whose HDI improved but whose CPI worsened with respect to the EU average: Cyprus, Malta, Poland, Spain and Sweden. In these countries, the increase in their citizens’ CPI is remarkable considering their above EU-average growth in HDI. The causes producing this phenomenon might have to be looked for beyond the variables that compose the HDI.
Countries with lower HDI and CPI growth with respect to other countries: Belgium, Croatia, Denmark, Finland, France, Hungary, Netherlands and Portugal. The position of these countries in the CPI ranking fell and in the HDI increased at a much lower rate than the other EU countries. However, except for Portugal and Hungary, these countries started from relative above EU-average positions. This negative convergence indicates that these countries had already reached reasonable positions on emergence from the crisis, which would have to be consolidated over time.
As far as our second hypothesis is concerned, we verified it as being a derivation of the first by incorporating the variable relating to the consolidation of populist parties within EU economies. To be more precise, the hypothesis sought to establish whether the percentage of votes obtained by the populist parties in the different government elections of 2017 could be explained in terms of CPI, HDI, unemployment rates and immigration levels in the existing regions at year-end 2017 (). That said, as a high correlation between HDI and CPI was observed in the previous analysis, and after studying the correlation matrix, it was necessary to eliminate one of the indexes to explain the percentage of votes in 2017.
Linear regression using a backwards estimation indicated that the only statistically significant and negative variable was the CPI. Falling positions in the corruption ranking correlated with higher percentages of votes obtained by populist parties (see ). However, the other variables were not considered statistically significant.
Table 2. Statistical results (source: the author). Vot. 2017.
As for the unemployment rate, the first model shows a non-significant positive relationship, while its relationship with the immigration rate is non-significant and negative. These last two variables, which are very important for the measurement of social conflict, suggest that the fear of unemployment and rising immigration could be important in the early, formative years of these parties, above all if those coincide with the middle of an economic recession, but that they are not decisive nowadays. However, during the stage of progressive economic recovery, when the labour market is more dynamic and there is controlled, legal immigration, the factors explaining the rise of populist parties are to be found elsewhere. Many may be local factors (as in the case of Spain) or the result of economic pressure imposed by the EU in order to fulfil its criteria for continued membership (the cases of Greece or Italy). Other variables such as new technologies or the generalized use of them could explain this percentage of votes.
shows variations over the studied period avoiding multicollinearity (see ).
Table 3. Bilateral correlation between variable variation rates.
We replicated the same model to analyse whether the evolution of the populist party vote over the 2008–2018 period could be explained by the evolution of the same variables over time. However, no variation rate was found to be statistically significant considering the different behavioural patterns of EU countries. Only the 10% variation in CPI could be considered significant (sig. 0.077).
Although the value for CPI was the only significant variable in both proposed models, we found interesting results in the average behaviour of three sets of countries based on the variation in the populist party vote. Three types of countries were considered. Firstly, those countries where the populist parties’ vote share was minimized; secondly, those countries where that share increased by less than 100% with respect to the starting-point of the studied period; and finally, those countries where that share increased by more than 100% during the same decade.
shows the average value for each variable in line with the previous classification. It will be seen, for instance, that the average of the studied countries improved their position in the corruption ranking by 3% during the period 2008–2018. However, those countries where the populist parties’ share of the vote increased showed an increase of 1.11 percent in CPI. As for those countries whose CPI fell, their position in the corruption ranking improved above the average.
Table 4. Statistical results (source: the author).
Countries where the vote share fell during the period 2008-2018: Austria, Belgium, Latvia, Netherlands and United Kingdom. These countries, in addition to being in the highest part of the CPI, improved their position above the average over the period. Likewise, they had the highest average HDI value. As for unemployment rates, these were the regions with the lowest percentage of unemployed, despite being the regions with least variation in unemployment during the period. As for immigration rates, these regions had the sharpest average decrease in the number of immigrants.
Countries where the vote share doubled during the 2008–2018 period: Croatia, Czech Republic, Finland, France, Germany, Greece, Hungary, Ireland, Italy, Slovakia, Spain and Sweden. These regions’ behaviour was very similar to that of the countries where the vote share had fallen. To be more precise, they occupied the lowest positions within the CPI, had the highest percentages for unemployment and the lowest average percentage for immigration.
Countries where the vote share increased during the period 2008-2018, but not to the point of doubling its value: Bulgaria, Cyprus, Denmark, Estonia, Lithuania, Luxembourg, Malta, Poland, Portugal and Slovenia. These countries occupied intermediate positions in the set of variables analysed.
5. Conclusions and limitations
Our results show that there is a high correlation between the Human Development Index and the level of corruption. This was due to the impact of the crisis on EU citizens. It eroded their optimism and undermined their hopes, and consequently various social conflicts arose as citizens lost confidence in their democracies due to variables like unemployment, immigration and political corruption.
We found similarities in behaviour among the EU-28 and were able to differentiate four categories of countries in terms of selected variables which explain the social conflict that arose during one of European history’s gravest economic crises. The model we propose is a first approach to understanding populism in Europe and it has some limitations owing to the similarity of behaviour in the countries analysed. For that reason, future research should be directed to exploring heterogeneous countries around the world where the action and reaction between countries cannot be explained by the domino effect, as it can in Europe.
Our study’s findings provide new insights which help to identify weaknesses in democracies propitious to the growth of populist parties.
Disclosure statement
No potential conflict of interest was reported by the authors.
References
- Anand, S., & Sen, A. (1994). Human Development Index: Methodology and measurement. Oxford, United Kingdom: Human Development Report Office.
- Aslanidis, P. (2016). Is populism an ideology? A refutation and a new perspective. Political Studies, 64(1_suppl), 88–104. doi:10.1111/1467-9248.12224
- Boomgaarden, H. J., & Vliegenthart, R. (2007). Exploring the rise of anti-immigrant parties: The role of news media content. Electoral Studies, 26(2), 404–417. doi:10.1016/j.electstud.2006.10.018
- Boomgaarden, H. J., & Vliegenthart, R. (2009). How news content influences anti-immigration attitudes: Germany, 1993–2005. European Journal of Political Research, 48(4), 516–542. doi:10.1111/j.1475-6765.2009.01831.x
- Casero-Ripollés, A. (2017). The populist political communication style in action: Podemos’s issues and functions on Twitter during the 2016 Spanish General Election. American Behavioral Scientist, 619, 986– 1001. doi:10.1177/0002764217707624
- Daveri, F. (2002). The new economy in Europe, 1992–2001. Oxford Review of Economic Policy, 18(3), 345–362. doi:10.1093/oxrep/18.3.345
- Dittrich, P.-J. (2017). Social networks and populism in the EU. Four things you should know. Policy Paper. Jacques Delors Institut – Berlin.
- Edwards, S. (2010). Leftbehind. Latin America and the false promise of populism. Chicago: The University of Chicago Press.
- Esposito, M., Chatzimarkakis, J., Tse, T., Dimitriou, G., Akiyoshi, R., Balusu, E., … Valezano, A. (2014). The European financial crisis: analysis and a novel intervention. Cambridge: Harvard University.
- Gerstlé, J. (2003). Une fenetre d’opportunité électorale. In P. Perrineau (Ed.), Le vote de tous les refus (pp. 27–52). Paris: Presses de Sciences Po.
- Ul Haq, M. (1995). Reflections on human development. Oxford: Oxford University Press.
- Mudde, C. (2004). The Populist Zeitgeist. Government and Opposition, 39(4), 541–563. doi:10.1111/j.1477-7053.2004.00135.x
- Quah, D. (1996). Twin peaks: Growth and convergence in models or distribution dynamics. The Economic Journal, 106(437), 1045–1055. doi:10.2307/2235377
- Rode, M., & Revuelta, J. (2015). The Wild Bunch! An empirical note on populism and economic institutions. Economics of Governance, 16(1), 73–96. doi:10.1007/s10101-014-0154-5