
 ?Mathematical formulae have been encoded as MathML and are displayed in this HTML version using MathJax in order to improve their display. Uncheck the box to turn MathJax off. This feature requires Javascript. Click on a formula to zoom.
Abstract
This study investigates the efficiencies of the exchange markets for four major currencies—the euro (EUR), the pound (GBP), the Canadian dollar (CAD) and the Japanese yen (JPY)—from 2005 to 2019 by using multifractal detrended fluctuation analysis (MF-DFA). This study also investigates the causes of these efficiencies. Significant multifractal properties are demonstrated by the four markets, and long-range correlation and fat-tail distribution properties are the main causes. We calculate and compare the multifractal degrees in three subsamples, which are classified based on their temporal relation to two economic events: the 2008 financial crisis and the announcement by the Federal Reserve of its withdrawal from the quantitative easing policy in 2014. Empirical results suggest that multifractal properties exist at different levels in the subsamples, thus showing that these events affect foreign exchange market efficiencies in terms of statistics and the fractal market. The JPY exchange market has the fewest multifractal properties, thus indicating that this exchange market has the highest market efficiency among these four exchange markets. The empirical results have implications for the nonlinear mechanism and efficiency in foreign exchange markets, which may help investors effectively manage market risks and benefit a stable global economy.
1. Introduction
The foreign exchange market, which is a part of the global financial market, is important in regulating international capital flows and promoting the sustainable development of international economy and trade This exchange market is an important mechanism that regulates the relationship between the supply and demand of foreign exchange and that determines exchange rates in the market This market is the microfoundation for effective macroeconomic policies and exchange-rate risk management in an open economy. Some recent studies have explicitly suggested that a well-functioning foreign exchange market can very efficiently utilize international capitals and allocate these resources to nations or sectors.
Modern financial theory is theoretically based on the efficient-market hypothesis (EMH) and the random walk hypothesis (RWH), which both constitute the foundation of financial studies. Providing an important analytical method for understanding price changes in the market, the EMH holds that market price always contains all possible information and that changes in prices follow a random walk when the market has weak-form efficiency. The RWH holds that there is a random fluctuation of prices; therefore, foreign exchange rates cannot be effectively predicted. Nevertheless, the EMH has recently been challenged by some studies and the apparent properties displayed by exchange market activities since the 1980s. Recent studies on fractal markets have challenged the basis of the traditional linear model; for example, some studies have challenged the random walk hypothesis and the assumption of a normal distribution. However, the question whether the efficiencies of different foreign exchange markets remain unchanged is vital for risk management and investment decisions concerning foreign exchange markets. However, this question has been rarely investigated in previous studies.
On one hand, foreign exchange markets around the world experienced large fluctuations caused by the global financial crisis that erupted in September 2008 and triggered the global economic crisis. Due to the crisis, the price of financial assets has sharply decreased, and the currency value has been considerably depreciated. Additionally, economic growth has been greatly hindered. The financial crisis resulted in great shocks, which negatively affected the stability of the foreign exchange market. The financial crisis also caused large fluctuations in exchange returns, huge losses by investors and less sustainability of global economic growth. On the other hand, the Federal Reserve announced its withdrawal from quantitative easing (QE) policy in 2014. Due to the close ties of some major countries to the United States (U.S.) and the international influence of the United States dollar (USD), the exchange rates of certain major currencies greatly fluctuated. Affected by these market factors, the nonlinearity and efficiency of the foreign exchange market exhibited certain changes during this period. Although these events are infrequent, the events greatly affect relevant economies and exert influences on relevant currencies. In this study, we are concerned with the effects of these economic events on nonlinear dynamics and efficiency in foreign exchange markets. Our empirical results can be obtained through an overall comparative analysis based on the whole sample and subsamples classified based on their temporal relation to economic events. The results may contribute to the understanding of the dynamic effects of these events and of the efficiency of different foreign exchange markets. The findings of our study confirm that the different multifractal properties in the foreign exchange markets have challenged the traditional assumptions of the linear system applied in previous studies. These implications can help policymakers and investors manage the risks and make useful inferences.
Considering the nonlinear properties in the foreign exchange market (Wang, Liu, & Gu, Citation2009), this study investigates the exchange rate return fluctuations and analyzes the causes of these fluctuations based on multifractal detrended fluctuation analysis (MF-DFA). This paper examines the daily returns from 2005 to 2019 of the respective exchange rates of four major currencies—the euro (EUR), the pound (GBP), the Canadian dollar (CAD) and the Japanese yen (JPY)—against the USD. The exchange rates between these currencies and the USD are conducive to learning the return of the international foreign exchange market. Therefore, this study focuses on the multifractal degrees and the evolutions of the daily returns of four major currencies in the international foreign exchange market from January 2005 to March 2019.
Certain studies have investigated the multifractal properties of the foreign exchange market of main currencies in the world. However, only a few studies have comprehensively compared the multifractal levels of the foreign exchange markets and the effects of financial crises on the nonlinearity and efficiency of foreign exchange markets. Unlike past studies, this paper examines the property and efficiency of foreign exchange markets from a multifractal and dynamic perspective. First, this paper uses MF-DFA to analyze the nonlinear characteristics of the returns of the EUR, GBP, CAD and JPY exchange markets and conducts comparative research to analyze the dynamic evolution of multifractal properties exhibited by the return series. Second, this study is also the first attempt in the literature to empirically examine the efficiencies of the EUR, GBP, CAD and JPY exchange markets. We conduct our research by using key events analysis. To test the effects of certain extreme events, i.e., the 2008 global financial crisis and the announcement by the Federal Reserve of its withdrawal from QE in 2014, on the nonlinearity and efficiency of the EUR, GBP, CAD and JPY exchange markets, we specially design a quantitative analysis of the time-varying degree of multifractality and separate the whole sample into three subsamples according to which of the following periods the sample was taken: before the crisis, between the crisis and the Federal Reserve’s announcement, and after the announcement. In this paper, we study the different effects of the 2008 financial crisis and the Federal Reserve’s policy on nonlinearity and efficiency in the EUR, GBP, CAD and JPY exchange markets for the whole sample and different subsamples. Third, in the empirical analysis section, we apply the two-dimension comparison of time and market efficiency to more comprehensively study the dynamics of the multifractality and efficiency of the exchange markets. In this paper, the empirical results on nonlinearity and efficiency imply that the foreign exchange market is a complex, nonlinear, and dynamic system; thus these results provide a new insight and theory for investors and regulators to make decisions in foreign exchange markets. Hence, this study has a certain theoretical reference value and practical significance for the optimization of asset allocation, hedging strategy design, financial derivative pricing, and market supervision policy formulation.
The rest of this paper is organized as follows. Section 2 is a brief literature review of the multifractal analysis and market efficiency. Section 3 gives the basic methodology of the MF-DFA. Section 4 presents the sample and corresponding descriptive statistics. Section 5 provides empirical results. Section 6 demonstrates further explanations for the results. Section 7 proposes some conclusions and discussions of this paper.
2. Literature review
Studies have been concerned with efficiencies in foreign exchange markets and have shown that the inefficiency of the foreign exchange market is closely related to the nonlinearity of the market. Li and Miller (Citation2015) investigated foreign exchange market inefficiency from a nonlinear perspective and showed that foreign exchange market inefficiency accords with many puzzling facts about the foreign exchange market. Kitamura (Citation2017) proposed measures of efficiency for foreign exchange markets and noted the efficiency of these markets. Levich, Conlon, and Potì (Citation2019) studied the evolution of exchange markets’ efficiency and showed that these markets exhibited excess-predictability and inefficiency in some specific periods, such as the global financial crisis. Yang, Shao, Shao, and Stanley (Citation2019) investigated the weak-form efficiency of the euro-to-Swiss franc (EUR/CHF) exchange rate market from 2002 to 2017; the authors suggested that the market exhibits a strong antipersistence for the whole sample and a weak antipersistence for five fixed subsamples.
Some studies have investigated the effects of certain economic events on the foreign exchange market over the past decade and have discussed the relationship between exchange rates and certain influencing factors. Mitra (Citation2017) focused on the relationship between the real effective exchange rate and the total value of stock transactions in South Africa during the post-Bretton Woods period of 1979–2014 by using dynamic cointegration; the author showed a significantly positive long-run correlation between the real effective exchange rate and the total value of stock transactions in South Africa. Delgado, Delgado, and Saucedo (Citation2018) studied mainly the correlation between the exchange rate and stock market index and how they interact in the Mexican economy; the authors showed that the exchange rate has a statistically significant and negative effect on the stock market index and that an appreciation of the exchange rate is relevant to a rise in the stock market index. Liu, Han, and Yin (Citation2019) studied the impacts of news uncertainty on long-term exchange rate volatility and showed that news uncertainty has a significantly positive and long-run spillover effect on currency volatility. These studies have shown that the foreign exchange market can be a complex system and will be affected by a variety of factors in a complex external environment, thus indicating time-varying features of the foreign exchange market.
A complex system usually exhibits multifractal properties and other complex time-varying features. MF-DFA and multifractal spectrum analysis have been widely applied to investigate the multifractal nature of time series. Hasan and Mohammad (Citation2015) studied and compared the multifractal properties of the U.S. stock market and those of the seven Asian stock markets during the crisis by using MF-DFA. The results indicated that these markets exhibited increasing long-range correlations in the return series. Gu and Huang (Citation2019) investigated the multifractal properties of Shenzhen Stock Exchange (SZSE) 5-minute high-frequency stock data from 2017/06/15 to 2018/04/11 by using MF-DFA; the authors showed that fluctuations in the high-frequency time series exhibit multifractality and that the sources of the multifractality are long-range correlation and the broadness of the probability density function. The authors also found that the multifractal spectrum of the series is bell shaped and thus helps one to explore the forecasting of financial markets. Thompson and Wilson (Citation2016) used generalized Hurst exponents and the multifractal spectrum method to study the multifractality in the financial time series and showed the significant multifractality in the series and that the accuracy of the multifractal spectrum estimates can be verified through simulation tests based on MF-DFA. Chen and Wang (Citation2017) studied the multifractal behavior in stock and portfolio returns by using MF-DFA and showed that the portfolio returns exhibit significant multifractality and that the multifractal property is mainly due to long-range correlation. Zhu and Zhang (Citation2018) investigated the multifractal property of the Chinese stock market through MF-DFA and showed that the return series in the stock market displayed multifractal properties. It was also proved that important parameters, such as the shape and width of the multifractal spectrum, are highly dependent on the q-order Hurst exponent, which determines the q-order weighing of the local fluctuation.
However, these studies do not link multifractal analysis, market efficiency, and extreme events and do not systematically study these issues. Although certain studies have examined the foreign exchange market and exchange rate by using multifractal methodology, these studies rarely investigated the impacts of such events on the multifractality and efficiency of the foreign exchange market from a multifractal perspective. Our study has two main objectives: The first objective is to use MF-DFA methodology to study the multifractal properties of the return series of four main exchange rates in the foreign exchange market; the currencies on which these exchange rates are based represent the main economies of the world. This analysis may contribute to understanding the impacts of extreme events on exchange rates and the global economy. The second objective is to use the whole sample and subsamples to explore the effects of the financial crisis and the Federal Reserve’s announcement on both the daily exchange rate returns and market efficiency from a multifractal perspective.
3. Methodology
3.1. MF-DFA methodology
According to Kantelhardt, Zschiegner, and Koscielny (Citation2002), MF-DFA is an important method for quantitatively studying the multifractal behaviors of time series. Some recent studies applied this method in exploring the multifractal structures of different time series, such as the time series of stock prices (Anagnostidis, Varsakelis, & Emmanouilides, Citation2016; Barro & Ursúa, Citation2017; Chauhan, Kumar, & Pathak, Citation2017), foreign exchange rates (Norouzzadeh & Rahmani, Citation2006; Wang, Wu, & Pan, Citation2011), crude oil prices (Alvarez-Ramirez, Cisneros, Ibarra-Valdez, & Soriano, Citation2002; He & Chen, Citation2010) and international capital flows (Ning, Wang, Yang, & Geng, Citation2017). The multifractal properties in financial markets are usually caused by the long-range correlation or fat-tail distribution of the series of main market variables (Cao, Cao, & Xu, Citation2013; Deng, Hung, & Qiao, Citation2018; Du & Ning, Citation2008; Lu, Tian, Zhou, & Li, Citation2013; Onali & Goddard, Citation2009; Wang & Wang, Citation2018; Yeung & Lento, Citation2018). According to Kantelhardt et al. (Citation2002), denotes a time series with length N, and MF-DFA can be conducted by following five steps.
Step 1: Compute the profile value
(1)
(1)
where
(2)
(2)
Step 2: Split the profile {y(k)} into several nonoverlapping segments. The lengths of these segments, e.g., time scale s, are equal. Then, the total number of segments is Ns = int(N/s). Then, we repeat the same processes from the end of the sample. When N is not a multiple of the time scale s, we can cover the whole sample by repeating these processes. Thus, we can obtain 2Ns segments altogether after each segment has been divided into two.
Step 3: Within each segment, we use OLS (Ordinary Least Square) to properly fit the series data. We acquire the local trend value for each segment. In this paper, denotes the fitting polynomial for segment v.
(3)
(3)
where i = 1,2,…,s; k = 1,2,…
We use the following method to calculate the variance in the model.
(4)
(4)
In the empirical study, the order of the fitting polynomial can be set to quadratic, cubic, or an even higher order. In this paper, we define m as the fitting polynomial order, which cannot be too high. Selecting a proper m value can avoid overfitting the series. The optimal order m value can be chosen in this model based on the fitting results.
Step 4: Compute the fluctuation function of order q Fq(s) for the whole segments by:
(5)
(5)
For q = 0, the fluctuation function F0(s)
(6)
(6)
For different time scales s, repeat step 2 to 4 successively to compare various fluctuation functions Fq(s) for different order value q.
Step 5: Study the log-log plots versus s for different order q. The generalized Hurst exponent H(q) for large values of s can be defined by EquationEquation (7)
(7)
(7) when the long-range power-law correlations exist in the time series.
(7)
(7)
According to MF-DFA method, the fractal structural property of the time series is defined by the Hurst exponent. Increasing scale s indicates the speed at which the function of local fluctuations grows. If the series is multifractal, e.g., the different large and small fluctuations scale, we can utilize the parameters we have set to calculate the significant dependence of H(q) on q. If the series exhibits monofractal characteristics, H(q) will be constant on the time scale regardless of different q values. Multifractal structural characteristics in a time series can be usually related to smaller H(q) values when q is positive. △H, the range of H(q), represents the multifractal degree of the series and can be calculated by qmin-qmax. A higher △H value shows stronger multifractality.
Moreover, scaling exponent is defined by:
(8)
(8)
By using a Legendre transform, we can calculate the singularity strength and the singularity spectrum
for MF-DFA. These results can be obtained by the following equations:
(9)
(9)
(10)
(10)
In this model, multifractal spectrum describes the multifractal dimension. Multifractal dimension
displays a shape of a single-peaked bell. The width of the multifractal spectrum can be represented by the difference between h(q)max and h(q)min, i.e., the difference between the maximum and the minimum probability distribution, respectively. According to Zunino et al. (Citation2008), we calculate the MD values via the width of the multifractal spectrum (the difference between h(q)max and h(q)min) to quantitatively study the multifractal degree. This nonlinear feature in the market is negatively correlated with the efficiency in the market (Cajueiro, Gogas, & Tabak, Citation2009). Therefore, a higher MD value indicates a higher inefficiency of the market.
3.2. Causes of multifractality
The main causes of multifractal properties in time series are long-range correlations and the fat-tailed distribution of the series. We can test the causes of the multifractality in the time series by shuffling or phase randomizing the original series.
On the one hand, shuffling the original series can distort the correlation in the original series. However, this process cannot change the distribution of the original series fluctuations. If the long-range correlation is the sole contributor to the multifractal property, the shuffled series will have no multifractal property. For the shuffling test, there are three steps to test the cause of the multifractality: (1) generate random integer number pairs (p, r), where p, r < N; (2) exchange p and r in pairs for the same series; and (3) repeat steps (1) and (2) for 20 N times to wholly reorder and shuffle the original series.
On the other hand, the non-Gaussian distribution property of the original series can be weakened by phase randomization. Similarly, if the fat-tailed distribution is the sole contributor to the multifractal property, the phase-randomized series will not display multifractality. According to Zhou (Citation2009), a phase-randomization test is composed of three steps: (1) the use of a discrete Fourier transform, (2) a random selection of a phase angle, and (3) the use of an inverse Fourier transform.
However, for both the shuffled and the phase-randomized series, having multifractal properties indicates the existence of both the long-range correlations and fat-tail properties of the original series. Currently, both properties may be the causes of the multifractality in the original series.
3.3. MF-DFA model settings
To employ MF-DFA, we first need to set the basic model parameters, which include m, q, and the scale values of the model. Usually, we set the value of m to between 1 and 3, while the smallest segment sizes contain from at least 10 to 20 samples (Timmermann & Granger, Citation2004). We can set the polynomial fitting order m to 1, 2, 3. According to Lashermes, Abry, and Chainais (Citation2004), we select m = 1 for two purposes: to avoid overfitting of polynomial trend and to facilitate calculation. Additionally, we select the order value of q between −5 and 5 based on experiences according to the results in the study of Lashermes et al. (Citation2004). In this paper, the q value is in the interval [−5,5] and takes 1 as the tolerance of the arithmetical series. Moreover, according to the study of Lashermes et al. (Citation2004), we select 1/10 of the total sample size as the increment of the interval size and ensure that the length of the segmentation interval is no more than 1/10 of the whole sample capacity. Therefore, in this paper, we set the minimum segment size to 8, the maximum segment size to 16, and the total number of segment sizes to 10.
4. Data
In this study, we select five major currencies: the USD, EUR, GBP, CAD and JPY, which are included in the world’s nine most traded currencies by value according to BIS. Four currency pairs—EUR/USD, GBP/USD, CAD/USD and JPY/USD—are examined in this paper. The exchange rates between these currencies and the USD are highly significant data in the study of the international foreign exchange market. The trend of the USD, which is the main currency reserve of the central banks in many countries, has a significant effect on foreign exchange markets. This paper also investigates the impacts of certain extreme global economic events and the U.S. Federal Reserve’s monetary policy. Furthermore, the four currencies selected in this study are representative currencies used in international transactions, thus displaying their importance and roles in the international trade and financial system. These currencies are widely used for trading in major foreign exchange markets in the world. The EUR and GBP are the chief non-U.S. currencies, thus showing the trend of the international foreign exchange market, especially for the non-U.S. market. Canada has close political and economic connections to the U.S., and Canada is greatly affected by U.S. political and economic policies. Therefore, the trend of the CAD is closely related to that of the USD and is greatly influenced by the USD. The JPY is one of the safe-haven currencies in the world and has relatively small fluctuations. Studying the dynamic features of hedging currencies, such as the JPY, under the impacts of extreme events or policies can contribute to a more comprehensive understanding of the effects of these events on the foreign exchange market. We collect daily exchange rates data from the RESSET database (www.resset.cn. ).
To study the effects of the 2008 financial crisis and the announcement by the Federal Reserve of its withdrawal from quantitative easing (QE) policy in 2014 and include sufficient samples, we select the sample period from January 3, 2005 to March 29, 2019. The selection of this sample based on a structural change test can help in studying the structural changes in the foreign exchange markets before and after the 2008 financial crisis and before and after the Federal Reserve’s announcement. The sample selected from 2005 to 2019 can fully reflect the changes in the foreign exchange market before and after these two significant events. This empirical study is conducted by using the daily log returns of the four exchange markets. The sample is shown in .
Table 1. Descriptive statistics for the returns of exchange rates in major exchange markets.
shows the descriptive statistics of the daily returns of the four main world currencies examined in this study. The average return of the CAD slightly exceeds zero, while the average returns of the EUR, GBP, and JPY are less than zero. Among those currencies having a negative average return, the GBP has the lowest average return, thus reflecting the underperformance of the GBP exchange market and suggesting that the pound may have been challenged over the past decade and may have a low overall return in the exchange market. Overall, the average returns of the four currencies are close to zero. The JPY has the highest standard deviation, and the EUR has the second highest. The skewness values of the GBP and CAD are less than 0; thus, the distributions of the returns of the GBP and CAD are indicated by the longer tail on the left side of the curve. However, compared to the average returns of the four currencies in the GBP exchange market, the opposite occurs in the EUR and JPY exchange market. As shows, the kurtosis values of all four currencies are greater than 0; therefore, the distributions of the series deviate significantly from the normal distribution. Furthermore, the kurtosis values of these currencies are greater than 3, thus suggesting that the fat-tailed distributions peaked with extreme values. Accordingly, the daily return series of the four currencies can deviate from normal distribution, thus showing that the return series can have multifractal properties resulting from the non-Gaussian distribution property (Kantelhardt et al., Citation2002).
The daily returns of the EUR, GBP, CAD, and JPY in the sample are shown in , respectively. The horizontal axis is the time axis, and the vertical axis represents the daily return levels. As shown in , the trends of the four return series are relatively close, thus indicating the basic consistency and correlations among these four major exchange markets. The exchange rate returns fluctuated remarkably from 2008 to 2010 and from 2014 to 2016, while the daily returns fluctuated less at other times, thus apparently showing the impacts of the 2008 global financial crisis and the announcement by the Federal Reserve of its withdrawal from quantitative easing policy in 2014. Moreover, these four return series experienced relatively small fluctuations from 2005 to 2008. The returns of the exchange rate of the euro and the Canadian dollar also exhibited relatively larger fluctuations, caused by the financial crisis in 2008, from 2008 to 2012. Furthermore, show that fluctuation persists in the four exchange rates return series; the persistence of this fluctuation can be an important factor of multifractality. The multifractal properties can be caused by certain extreme events and extreme volatility. The volatility in these exchange rate return series may display time-scale persistence, which may cause long-range correlations in the series; long-range correlations are another significant cause of multifractality.
Figure 1. The daily return series of EUR. Source: Author calculations.
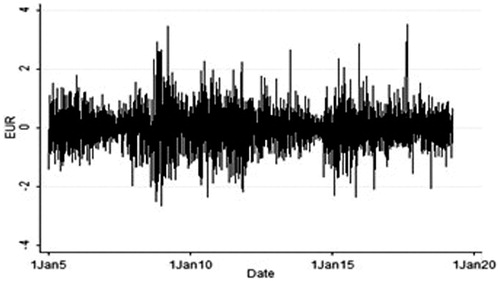
Figure 2. The daily return series of GBP. Source: Author calculations.
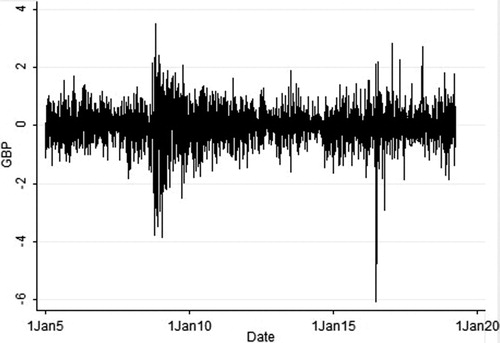
Figure 3. The daily return series of CAD. Source: Author calculations.
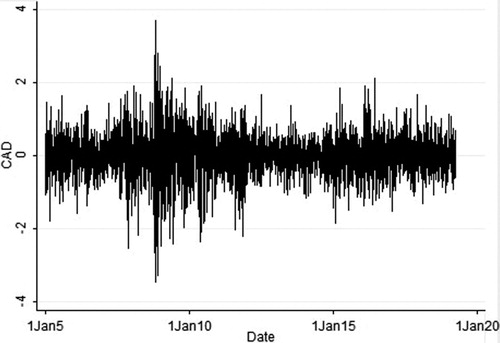
Figure 4. The daily return series of JPY. Source: Author calculations.
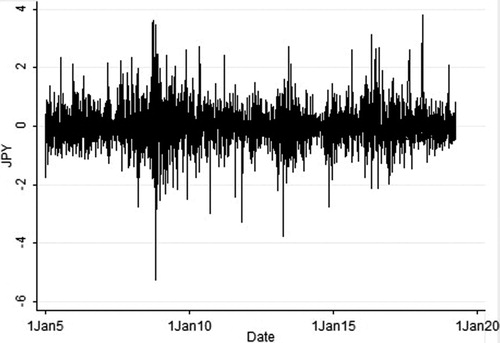
As shown in , the trends of the EUR, GBP, CAD, and JPY exchange market returns are similar, thus showing the consistency and correlations of changes and volatilities in the main currency exchange markets. The returns of these four exchange markets fluctuated most considerably around 2008 and around 2015, while the daily returns exhibited relatively smaller fluctuations at other times, thereby illustrating the effects of the global financial crisis in 2008, the program of quantitative easing (QE) by the Federal Reserve in 2014, and a series of sequent monetary policies. Specifically, as shown in , the pound fluctuated considerably between 2015 and 2016; the euro fluctuated less than the pound but more than the other two currencies during this period. As a safe-haven currency, the yen fluctuates more evenly in the sample but more sharply in 2008, 2014 and 2016 than in other times. In this paper, we discuss the different multifractal properties of the return series of main currency exchange markets and the causes of multifractality. By comparing the multifractal properties of the four return series, we study the level of exchange market efficiency of major currencies in the world.
5. Empirical results
5.1. Multifractal structure of foeign exchange return series
The q-order generalized Hurst exponent and the multifractal spectrum of the returns of the EUR, GBP, CAD and JPY exchange rates and of their test series are shown in .
Figure 5. The Hurst exponent and multifractal spectrum of the daily returns of four exchange rates. (Notes: describes the Hurst exponent and multifractal spectrum of EUR, GBP, CAD and JPY, respectively. H(q), hq and Dq denote order value, q-order Hurst exponent, singularity strength and singularity spectrum, respectively.). Source: Author calculations.
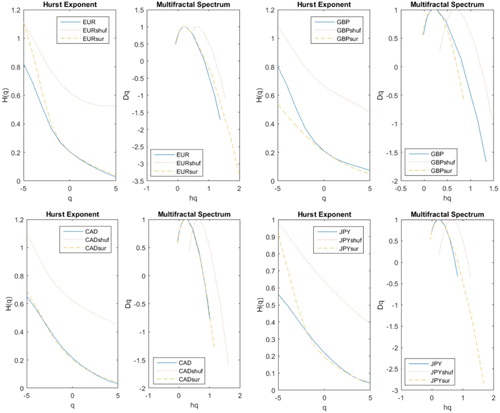
As shows, the generalized Hurst exponent H(q) of order q of the EUR, GBP, CAD and JPY exchange rates returns and their test series are apparently correlated to order value q and decrease smoothly with the increase in order value q. H(q) smoothly decreases, thereby indicating that the EUR, GBP, CAD and JPY exchange rate return series exhibit significant multifractal properties. Moreover, H (q) is not a constant but a function of q, thus showing that the daily return series of the four exchange rates exhibit significant multifractal properties. According to Kantelhardt et al. (Citation2002), when q = 2, h (q) is the classical Hurst index H. The classical Hurst index H between 0 and 0.5 shows a negative long-range correlation in the time series. In , H (q) shows a downward trend on the interval [−5, 5]. When q = 2, the classical Hurst exponent H (q) of the original sequence is 0.1172, 0.1342, 0.1177, and 0.1215, thus indicating a relatively strong negative long-range correlation. For these four return series, when q = −5, H(q) is lower than 0.5. H(q) decreases smoothly with an increasing q value between −5 and 5. Therefore, the return series have considerably persistent properties of relatively smaller fluctuations. The H (q) values show that the changes in these exchange rate returns are the opposite from those in the past.
The multifractal spectra of the four exchange rate return series are also shown in . The spectra of the series exhibit a single peak function, which further confirms that the daily return series of each exchange rate display multifractal properties.
5.2. Multifractal degree of foreign exchange return series
As shows, the multifractal spectrum f(α) and the q-order singularity exponent α display relationships that have a single-peak bell shape. The major parameters of the multifractal spectrum are shown in .
Table 2. Multifractal properties of four exchange rate returns.
As shows, the Δα value of the EUR is the highest among the Δα values of the four return series and that the Δα value of the JPY is the lowest, thus indicating that the local fluctuations in the EUR exchange rate return series are the most uneven and that the local fluctuations in the JPY exchange rate return series are the most even. Therefore, among the four return series, the EUR exchange rate series has the highest multifractal degree, and the JPY exchange rate series has the lowest multifractal degree. For the EUR, GBP, CAD and JPY, the chance of the daily returns being maximized is greater than the chance of the returns being at a minimum because Δf > 0, which shows large fluctuations in the four original series of the exchange rate return. The Δf value of GBP is the highest among the Δf values of the four currencies and that of the JPY is the lowest, thus indicating the largest fluctuations in the original series of the GBP exchange rate returns and the smallest fluctuations in the original series of the JPY exchange rate returns.
For the EUR, GBP, CAD and JPY, the asymmetric exponent R < 0 shows that the shape of the multifractal spectrum of the four currencies is a left-skewed distribution and that the multifractal spectra show an inverted bell of a left-skewed distribution. Therefore, the relatively low fractal exponents dominate. The asymmetric exponent R < 0 also shows that the right half of the daily return ΔαR has a larger range of values and that events with a lower daily return of the four currencies have an advantage over those with a higher daily return. The events with a lower daily return take a more dominant position in the sample selected.
For these four exchange rate return series, the widths of the multifractal spectra of the phase-randomized series of the GBP and CAD are less than those of their shuffled series; this difference in widths can be interpreted as the impact of extremely large Gaussian events on the multifractal structural properties of the time series, thus showing that the fat-tail distributions of volatility for the original exchange rate return series of the GBP and CAD have greater effects than the long-range correlations of the series on the multifractal properties of the original series. Conversely, for the EUR and JPY exchange rate return series, the long-range correlations of the series have a greater effect than the fat-tailed distribution of the exchange rate return series on the multifractal properties of the original series. In the EUR and JPY exchange market, the inefficiency is correlated with long-range correlations in the exchange rate return series; this correlation may have certain effects on the asset price and investor expectations. However, in the GBP and CAD exchange market, extreme events, such as a financial crisis, may have more influence on market inefficiency because of the distributions of the return series. The long-range correlations in the return series indicate that the returns exhibit long memory and can be predicated. The fat-tailed distribution of the return series shows the non-Gaussian distribution property of the series. These empirical results based on the four currencies have apparently shown certain contradictions with the EMH, which states that the market remains efficient and the price trend is random and cannot be effectively predicted (Arshad, Rizvi, Ghani, & Duasa, Citation2016; Titan, Citation2015).
5.3. Causes of multifractal properties of foreign exchange return series
According to multifractal analysis theory (Kantelhardt et al., Citation2002), there are two main sources of multifractality within a time series: long-range correlations of small and large fluctuations and fat-tailed probability distributions of volatilities (Norouzzadeh & Rahmani, Citation2006). In this study, the shuffled series and the phase-randomized series are named shuf and sur, respectively. As shows, the Hurst exponents of shuf and sur display different structural properties.
For the daily return of the GBP exchange rate, the width of the multifractal spectrum of the test series, especially the phase-randomized series, is slightly less than that of the multifractal spectrum of the original series. The generalized Hurst exponent H(q) of order q of the GBP exchange rate return series and its test series, including its shuffled series and phase-randomized series, are correlated to the order number q. The generalized Hurst exponent H(q) drops when order q rises, showing that the original series of GBP exchange rate return and its shuffled and phase-randomized series exhibit multifractal properties. The slight difference between the H(q) of the original series of the GBP exchange rate return and the H(q) of the shuffled series shows that the distribution of the original series is well preserved by the shuffled process results.
For the daily return of the JPY exchange rate, the width of the multifractal spectrum of the test series is slightly different from that of the multifractal spectrum of the original series. Specifically, the width of the multifractal spectrum of the phase-randomized series of the JPY exchange rate is slightly greater than that of the multifractal spectrum of the original series, and the width of the multifractal spectrum of its shuffled series is slightly less than that of the multifractal spectrum of the original series. For the daily return of the EUR and CAD exchange rate, the width of the multifractal spectrum of the test series is approximately equal to that of the multifractal spectrum of the original series, thus indicating that the multifractal properties and their degrees of the test series are slightly weakened. That the EUR, GBP, CAD and JPY exchange returns have multifractal properties confirms the results on the hypothesis that the foreign exchange market is not always efficient and that the inefficiency is caused by the nonlinearity of the market.
6. Empirical results in sub-samples
To further study the multifractality and efficiency of the exchange market, we apply MD (multifractality degree) values in the sample. Empirically, we use the MD values to measure the multifractal degree by computing αmax-αmin for each exchange rate return series. A relatively high MD value indicates a high multifractality degree and correspondingly low market efficiency (Wang et al., Citation2009). In this section, we specifically study the effects of certain extreme events, such as the 2008 financial crisis and the Federal Reserve’s policies, on the multifractal properties of exchange markets from a dynamic perspective. In this research, we use a structure change test to study the event effects and to divide the whole sample into three subsamples taken during the following periods in reference to the 2008 financial crisis and the announcement by the Federal Reserve of its withdrawal from quantitative easing (QE) policy in 2014: before the 2008 financial crisis, between the crisis and the announcement, and after the announcement.
Thus, we can acquire the multifractality degree and efficiency the of EUR, GBP, CAD and JPY exchange market for the three periods. The multifractality degree of the market is related to market efficiency and risk level. A higher multifractality degree indicates greater risk and less efficiency in the market (Anagnostidis et al., Citation2016; Chauhan et al., Citation2017; Kantelhardt et al., Citation2002).
The MD values of the four exchange rate return series in the three subsamples and the whole sample are shown in . From the different perspectives of the subsamples and the whole sample, we find different multifractal degrees and different effects of the financial crisis and the Federal Reserve’s policies on the market multifractality and efficiency. The EUR exchange rate return series has the highest MD value in the whole sample, while the MD values of the return series are lower in the subsamples. Therefore, the crisis and the policies have greater effects on the multifractal properties and inefficiency of the EUR exchange market than on the multifractal properties and inefficiency of the other markets.
Table 3. MD values of four exchange rate returns in different periods.
As shows, for the whole sample, the EUR exchange market return exhibits the highest multifractality degree, and the JPY exchange market return exhibits the lowest. Therefore, from the whole sample perspective, the JPY exchange market shows the highest market efficiency. However, for the subsamples, the results are different. Among the MD values of the four series, the MD value of the CAD is the highest during Period I, the lowest during Period II, and the highest during Period III. Therefore, the return series of the CAD exhibits the largest fluctuations in the sample, thus indicating the greatest impacts of the extreme events-the 2008 financial crisis and the announcement by the Federal Reserve of its withdrawal from QE policy in 2014-on multifractal properties and exchange market efficiency.
shows the Hurst exponents and multifractal spectra of the daily return series of the EUR, GBP, CAD, and JPY exchange rate for the three subsamples for Periods I, II, and III. For each period, the solid line represents the EUR and CAD exchange market return, and the dashed line represents the GBP and JPY exchange market return. As shows, during Period I, the H(q) of the EUR decreases from approximately 0.4036 to 0.0112 and at a speed faster than that of the GBP, whose H(q) decreases from approximately 0.3225 to 0.0069. The MD values are 0.7069 and 0.5650 for the EUR and GBP, respectively. Meanwhile, as shows, the width of the multifractal spectrum of the EUR is greater than that of the multifractal spectrum of the GBP, thus indicating that both the EUR and GBP return series during Period I have multifractal structural features and that the EUR return series exhibits a slightly higher multifractal level than does the GBP return series. The comparison results show that the EUR exchange market is slightly less efficient than the GBP exchange market during Period I. The return series of the CAD and JPY during period I are similarly compared. The H(q) of the CAD decreases from approximately 0.5918 to 0.0366 and at a faster speed than the H(q) of the JPY, whose H(q) decreases from approximately 0.2352 to 0.0009. The MD values are 1.0410 and 0.4681 for the CAD and JPY, respectively. Additionally, as shows, the width of the multifractal spectrum of the CAD is greater than that of the multifractal spectrum of the JPY, thus indicating that both the CAD and JPY return series during Period I have multifractal structural features and that the multifractal level of the CAD is higher than that of the JPY. The comparison results show that the CAD exchange market is slightly less efficient than the JPY exchange market during Period I.
Figure 6. The Hurst Exponent and Multifractal Spectrum of exchange rate return series during Period I, II, III. Source: Author calculations.
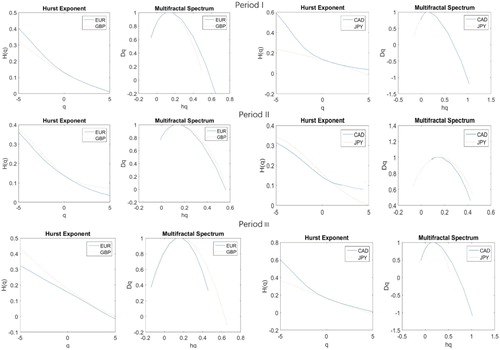
For Periods II and III, we also similarly compare and analyze exchange market efficiency. Moreover, the multifractal level of the EUR is also higher than that of the GBP, thus showing that the EUR exchange market is also less efficient than the GBP exchange market, to a lesser degree, during Period II. The multifractal degree of the JPY is slightly higher than that of the CAD, thus showing that the JPY exchange market is less efficient than the CAD exchange market during Period II. However, the GBP exchange market is slightly less efficient than the EUR exchange market, and the CAD exchange market is less efficient than the JPY exchange market during Period III.
The empirical result that the MD values of the EUR, GBP, CAD and JPY exchange markets fluctuated over time supports the results of Levich, Conlon, and Potì (Citation2019) that the efficiency of foreign exchange markets is dynamically nonlinear, and the inefficiency of these markets may be related to specific times, such as the global financial crisis. Based on the comparison of the MD values of the return series of the four exchange rates in the subsamples and the whole sample, we can draw three main conclusions: First, the MD values of the four return series in the exchange markets were highly volatile during different periods in the sample. Second, the fluctuation trends of the MD values of the four return series are not exactly the same. Third, the financial crisis and the Federal Reserve’s announcement have different effects on exchange market efficiency. This study analyzes the foreign exchange markets from the perspective of time-varying and multifractal properties. The results provide a certain theoretical basis for investors to carry out effective investment and risk control activities in the international foreign exchange market, especially when facing the effects of extreme events.
7. Conclusions
This study focuses on the multifractality and inefficiency of different exchange markets. This inefficiency may be caused by government intervention, investor structure, and other market behaviors during or after extreme events, such as the 2008 financial crisis and the announcement by the Federal Reserve of its withdrawal from QE policy in 2014. The multifractality of the four return series in these exchange markets is caused by both the long-range correlation and the fat-tail distribution of the series. The fat-tail distribution of the original series of the GBP has a greater effect than the long-range correlation on the multifractal properties of the original series of the currency. However, for the EUR, CAD and JPY return series, these effects may be opposite. The randomness, nonlinearity and inefficiency of the foreign exchange markets make the foreign exchange market a complex nonlinear system. For the sample of from 2005 to 2019, compared to the other three exchange markets, the EUR exchange market return has a relatively stronger multifractal structure, thus indicating that the EUR exchange market is less efficient than the other markets. From the subsample perspective, the multifractality and efficiency of the CAD return series have been most affected by the financial crisis and the Federal Reserve’s announcement, thus showing the great impacts of the global financial crisis on Canadian economy and the close relationship between the Canadian and the U.S. economy.
The efficiency of the foreign exchange market is related to the effectiveness of resource allocation and the implementation of monetary policy. Only in an efficient foreign exchange market can funds be rationally allocated and can investors engage in rational and fair transactions with controllable risks. However, due to the asymmetry of information and the irrationality of investors, it is difficult for the market to spontaneously achieve efficiency. Monetary authorities in various countries have adopted measures, such as system construction and mechanism reform, to achieve the above goals and improve market efficiency. Considering the imperfection of the global foreign exchange market and the contributors to market inefficiency, the relevant authorities can promote the sustainable development of the foreign exchange market and maintain the equilibrium of the global economy by (1) effectively managing the internal risks in the foreign exchange market to maintain a health and stable market, (2) appropriately using exchange rate instruments and other regulations to reduce the effects of external shocks on the efficiency of the foreign exchange market, (3) optimizing the investor structure in the foreign exchange market and promoting effective international capital flow, and (4) improving the efficiency of the foreign exchange market and promoting the orderly environment of the international foreign exchange market. These measures will eventually help to create a stable and sustainable foreign exchange market environment, which can benefit the growth of the foreign exchange market and global economy. In summary, when making investment decisions, investors in the foreign exchange market should comprehensively consider the relationships among different correlated markets; for regulators in the foreign exchange market, it is necessary to reduce the asymmetry of information, improve the efficiency of the market operation, and promote the healthy development of the international foreign exchange market.
The foreign exchange market has a multifractal structure and exhibits inefficiency. From a technical perspective, it is possible to predict and analyze exchange rate fluctuations, and this possibility enables arbitrage in the market. The chance of arbitrage can attract international speculative capital, thereby increasing international exchange rate risks. As the foreign exchange market is multifractal, it is assumed that the exchange rate obeys the geometric fractional Brownian motion. Investors in the foreign exchange market construct a portfolio model based on the Hurst index and the width of the multifractal spectrum. Through this model, investors design hedging strategies with the EUR, GBP, CAD and JPY by using the stochastic differential equation and quasimartingale pricing to effectively manage the risks in the foreign exchange market.
Although this study comprehensively investigates the multifractal properties of the foreign exchange markets, the mechanism of the multifractal characteristics of the foreign exchange markets and of the market risk need further research and explanation. Problems to be solved next are explaining how the foreign exchange markets affect each other and the world economy and more accurately quantifying the fluctuations in the foreign exchange market.
Disclosure statement
No potential conflict of interest was reported by the author(s).
Additional information
Funding
References
- Alvarez-Ramirez, J., Cisneros, M., Ibarra-Valdez, C., & Soriano, A. (2002). Multifractal Hurst analysis of crude oil prices. Physica A: Statistical Mechanics and Its Applications, 313(3-4), 651–670. doi:10.1016/S0378-4371(02)00985-8
- Anagnostidis, P., Varsakelis, C., & Emmanouilides, C. J. (2016). Has the 2008 financial crisis affected stock market efficiency? The case of Eurozone. Physica A: Statistical Mechanics and Its Applications, 447, 116–128.
- Arshad, S., Rizvi, S. A. R., Ghani, G. M., & Duasa, J. (2016). Investigating stock market efficiency: A look at OIC member countries. Research in International Business and Finance, 36, 402–413. doi:10.1016/j.ribaf.2015.09.026
- Barro, R. J., & Ursúa, J. (2017). Stock-market crashes and depressions. Research in Economics, 71(3), 384–398. doi:10.1016/j.rie.2017.04.001
- Cajueiro, D. O., Gogas, P., & Tabak, B. M. (2009). Does financial market liberalization increase the degree of market efficiency? The case of the Athens stock exchange. International Review of Financial Analysis, 18(1-2), 50–57. doi:10.1016/j.irfa.2008.11.004
- Cao, G., Cao, J., & Xu, L. (2013). Asymmetric multifractal scaling behavior in the Chinese stock market: Based on asymmetric MF-DFA. Physica A: Statistical Mechanics and Its Applications, 392(4), 797–807. doi:10.1016/j.physa.2012.10.042
- Chauhan, Y., Kumar, S., & Pathak, R. (2017). Stock liquidity and stock prices crash-risk: Evidence from India. The North American Journal of Economics and Finance, 41, 70–81. doi:10.1016/j.najef.2017.04.003
- Chen, C., & Wang, Y. (2017). Understanding the multifractality in portfolio excess returns. Physica A: Statistical Mechanics and Its Applications, 466, 346–355. doi:10.1016/j.physa.2016.09.026
- Delgado, N. A. B., Delgado, E. B., & Saucedo, E. (2018). The relationship between oil prices, the stock market and the exchange rate: Evidence from Mexico. The North American Journal of Economics and Finance, 45, 266–275. doi:10.1016/j.najef.2018.03.006
- Deng, X., Hung, S., & Qiao, Z. (2018). Mutual fund herding and stock price crashes. Journal of Banking & Finance, 94, 166–184. doi:10.1016/j.jbankfin.2018.07.014
- Du, G., & Ning, X. (2008). Multifractal properties of Chinese stock market in Shanghai. Physica A: Statistical Mechanics and Its Applications, 387(1), 261–269. doi:10.1016/j.physa.2007.08.024
- Gu, D., & Huang, J. (2019). Multifractal detrended fluctuation analysis on high-frequency SZSE in Chinese stock market. Physica A: Statistical Mechanics and Its Applications, 521, 225–235. doi:10.1016/j.physa.2019.01.040
- Hasan, R., & Mohammad, S. M. (2015). Multifractal analysis of Asian markets during 2007–2008 financial crisis. Physica A: Statistical Mechanics and Its Applications, 419, 746–761. doi:10.1016/j.physa.2014.10.030
- He, L. Y., & Chen, S. P. (2010). Are crude oil markets multifractal? Evidence from MF-DFA and MF-SSA perspectives. Physica A: Statistical Mechanics and Its Applications, 389(16), 3218–3229. doi:10.1016/j.physa.2010.04.007
- Kantelhardt, J. W., Zschiegner, S. A., & Koscielny, B. E. (2002). Multifractal detrended fluctuation analysis of nonstationary time series. Physica A: Statistical Mechanics and Its Applications, 1, 87–114. doi:10.1016/S0378-4371(02)01383-3
- Kitamura, Y. (2017). Simple measures of market efficiency: A study in foreign exchange markets. Japan and the World Economy, 41, 1–16. doi:10.1016/j.japwor.2016.11.001
- Lashermes, B., Abry, P., & Chainais, P. (2004). New insights into the estimation of scaling exponents. International Journal of Wavelets, Multiresolution and Information Processing, 02(04), 497–523. doi:10.1142/S0219691304000597
- Levich, R., Conlon, T., & Potì, V. (2019). Measuring excess-predictability of asset returns and market efficiency over time. Economics Letters, 175, 92–96. doi:10.1016/j.econlet.2018.12.022
- Li, J., & Miller, N. C. (2015). Foreign exchange market inefficiency and exchange rate anomalies. Journal of International Financial Markets, Institutions and Money, 34, 311–320. doi:10.1016/j.intfin.2014.12.001
- Liu, Y., Han, L., & Yin, L. (2019). News implied volatility and long-term foreign exchange market volatility. International Review of Financial Analysis, 61, 126–142. doi:10.1016/j.irfa.2018.10.005
- Lu, X., Tian, J., Zhou, Y., & Li, Z. (2013). Multifractal detrended fluctuation analysis of the Chinese stock index futures market. Physica A: Statistical Mechanics and Its Applications, 392(6), 1452–1458. doi:10.1016/j.physa.2012.11.037
- Mitra, R. (2017). Stock market and foreign exchange market integration in South Africa. World Development Perspectives, 6, 32–34. doi:10.1016/j.wdp.2017.05.001
- Ning, Y., Wang, Y., Yang, Z., & Geng, Y. (2017). Measurement and multifractal properties of short-term international capital flows in China. Physica A: Statistical Mechanics and Its Applications, 468, 714–721. doi:10.1016/j.physa.2016.10.063
- Norouzzadeh, P., & Rahmani, B. (2006). A multifractal detrended fluctuation description of Iranian rial-US dollar exchange rate. Physica A: Statistical Mechanics and Its Applications, 367, 328–336. doi:10.1016/j.physa.2005.11.019
- Onali, E., & Goddard, J. (2009). Unifractality and multifractality in the Italian stock market. International Review of Financial Analysis, 18(4), 154–163. doi:10.1016/j.irfa.2009.05.001
- Thompson, J. R., & Wilson, J. R. (2016). Multifractal detrended fluctuation analysis: Practical applications to financial time series. Mathematics and Computers in Simulation, 126, 63–88. doi:10.1016/j.matcom.2016.03.003
- Timmermann, A., & Granger, C. W. J. (2004). Efficient market hypothesis and forecasting. International Journal of Forecasting, 20(1), 15–27. doi:10.1016/S0169-2070(03)00012-8
- Titan, A. G. (2015). The efficient market hypothesis: Review of specialized literature and empirical research. Procedia Economics and Finance, 32, 442–449.
- Wang, H., & Wang, T. (2018). Multifractal analysis of the Chinese stock, bond and fund markets. Physica A: Statistical Mechanics and Its Applications, 512, 280–292. doi:10.1016/j.physa.2018.08.067
- Wang, Y., Liu, L., & Gu, R. (2009). Analysis of efficiency for Shenzhen stock market based on multifractal detrended fluctuation analysis. International Review of Financial Analysis, 18(5), 271–276. doi:10.1016/j.irfa.2009.09.005
- Wang, Y., Wu, C., & Pan, Z. (2011). Multifractal detrending moving average analysis on the US Dollar exchange rates. Physica A: Statistical Mechanics and Its Applications, 20, 3512–3523. doi:10.1016/j.physa.2011.05.023
- Yang, Y. H., Shao, Y. H., Shao, H. L., & Stanley, H. E. (2019). Revisiting the weak-form efficiency of the EUR/CHF exchange rate market: Evidence from episodes of different Swiss franc regimes. Physica A: Statistical Mechanics and Its Applications, 523, 734–746. doi:10.1016/j.physa.2019.02.056
- Yeung, W. H., & Lento, C. (2018). Ownership structure, audit quality, board structure, and stock price crash risk: Evidence from China. Global Finance Journal, 37, 1–24. doi:10.1016/j.gfj.2018.04.002
- Zhou, W. X. (2009). The components of empirical multifractality in financial returns. Europhysics Letters, 88(2), 28004. doi:10.1209/0295-5075/88/28004
- Zhu, H., & Zhang, W. (2018). Multifractal property of Chinese stock market in the CSI 800 index based on MF-DFA approach. Physica A: Statistical Mechanics and Its Applications, 490, 497–503. doi:10.1016/j.physa.2017.08.060
- Zunino, L., Tabak, B. M., Figliola, A., Pérez, D. G., Garavaglia, M., & Rosso, O. A. (2008). Multifractal approach for stock market inefficiency. Physica A: Statistical Mechanics and Its Applications, 387(26), 6558–6566. doi:10.1016/j.physa.2008.08.028