
 ?Mathematical formulae have been encoded as MathML and are displayed in this HTML version using MathJax in order to improve their display. Uncheck the box to turn MathJax off. This feature requires Javascript. Click on a formula to zoom.
Abstract
Poverty is a global problem, and fighting it is a historical task faced by humanity. The outbreak of poverty crises has a certain cyclicality, and the development of economic research may react to poverty cycles. To validate this view, we take the United States as an empirical example and establish a quantitative research architecture based on the bibliometrics and econometrics. In the first place, we conduct a bibliometric analysis of selected search terms relevant to poverty cycles. After that, the time-series data in the actual economy are collected for reflecting the trends and fluctuations in economic activity affected by poverty cycles. Meanwhile, with both bibliometric and economic data, a detrending measure via the band-pass (BP) filter is performed to estimate cycles. Finally, the Granger causality tests are implemented to explore the interaction between poverty cycles and economic research directly. As a supplement, this paper also provides a quantitative evaluation analysis, namely impulse-response functions, to investigate the influence of economic variables on bibliometric ones. The final results show there indeed exists an impact of poverty cycles in economic activity on relevant discussions in the scientific literature.
1. Introduction
A growing body of literature is interested in studying business cycles, especially about its relationship and comovement with other actual events, including financial cycles (Yan & Huang, Citation2020), stock market cycles (Si et al., Citation2019) and CO2 emissions (Gozgor et al., Citation2019). However, another critical economic phenomenon (i.e., poverty cycles) has rarely been mentioned and noticed. Like business cycles, as a cyclical phenomenon in economic growth, time dependence, asymmetry, and a clear pattern are the dominant features of poverty cycles (Škare et al., Citation2018). Currently, how to break poverty cycles seem to be the central thesis of discussion. For instance, a micro-finance architecture could be developed to fight poverty cycles (Garrity & Martin, Citation2018; Khan et al., Citation2017). Of course, the identification and measurement of poverty cycles are also a significant research perspective (Niu et al., Citation2020; Škare et al., Citation2018). Also, there exists a tremendous amount of literature attempting to detect causality or connection between poverty crises and other events. Rakotondramaro and Andriamasy (Citation2016) investigated the causal links amongst economic growth, tourism development and poverty in Madagascar on the Granger trivariate framework. Their study showed that tourism and economic growth are not enough to reduce local poverty. Dhrifi et al. (Citation2020) inspected the causal relationship amongst environmental degradation, foreign direct investment and poverty. Surprisingly, only the poverty status of Asian and Latin American regions could be improved through foreign direct investment. Ayyagari et al. (Citation2020) argued that there is a significant negative correlation between financial depth and rural poverty in India.
Compared with previous qualitative social surveys, most of the existing studies have introduced the framework and thought of quantitative analysis, which makes the final results more practical and attractive. In general, poverty is considered as the product of economic activity. Amongst the many quantitative methods for analysing economic phenomena, econometrics has occupied a prominent position, especially in macroeconomics in recent years. It aimed to study the relationship amongst economic variables with random characteristics quantitatively (Välilä, Citation2020). Based on such a technique, many related studies have been successively carried out. Simultaneously, the emergence of bibliometrics allowed many documents to be quantified and visualised (Martínez-López et al., Citation2020). Therefore, some studies have attempted to research the comovement between economic activity and the development of literature based on econometrics and bibliometrics. The most classic case came from the research of Geiger and Kufenko (Citation2016), they confirmed that business cycles have a significant impact on the development of relevant scientific literature. Since it was reported in 2015, related studies have been attracting significant interest. As aforementioned, poverty cycles are the ‘twins’ of business cycles, and whether it also interacts with discussions in the scientific literature. To date, far too little attention has been paid to this, and it is meaningful to research such a question. Therefore, this study seeks to obtain evidence that will help address this research gap and puts forward a similar issue immediately, namely, is there a causal relationship or connection between the development of economic literature and poverty cycles?
This paper took a study of the United States (US) and employed the resemblant quantitative methods followed by Geiger and Kufenko (Citation2016). After determining bibliometric search terms related to poverty cycles, a bibliometric analysis from 1900 to 2019 in Journal Storage (JSTOR) literature database was conducted. As a result, the development and trends of scientific literature were identified and discussed. Afterwards, we determined the economic indicators, i.e., time-series of real GDP per capita, consumption price index, unemployment rate, industrial production index, real per capita disposable income, 10-year term government bond yields and consumer confidence index in the US. Furthermore, the bibliometric and economic series were detrended via the BP filter to estimate cycles. Finally, under the framework of the vector autoregressive (VAR) model, we utilised the Granger causality tests to examine the causal links between poverty cycles in the economic activity and the development of academic literature.
The paper is organised in the following way. Section 2 begins with an overview of the theoretical background and relevant literature. Section 3 goes on to introduce the materials and methods used in this paper. Section 4 concerns the results and discussions for this study. Some conclusions are summarised in section 5.
2. Background and related literature
The progress of human society has always accompanied the poverty problem. Ending all forms of poverty around the world is the primary goal of the United Nations 2030 Agenda for the 17 sustainable development goals (SDGs) (Wang & Zhou, Citation2020). However, to date, there is no uniform definition of poverty in academia due to its complexity and extensive historicity. As a socio-economic phenomenon, poverty is not unique to a country or region, but rather a ubiquitous event. In general, it is understood that the income of an individual or family cannot reach a socially acceptable level. Since the actual situation in each country or region is different, the level is naturally different. The scope and intension of poverty are constantly expanding and enriching in recent years, and thereby different types of poverty have been proposed (Liu & Xu, Citation2016).
The existing literature on poverty has been extensive and focuses particularly on examining the transition of poverty (Bane & Ellwood, Citation1986; Muyanga et al., Citation2013). However, there is a relatively small body of literature concerned with poverty cycles. Driven by business cycles, the emergence of poverty is also apparently cyclical. This was confirmed in a study by Škare et al. (Citation2018). Once poverty cycles occur, it tends to have an impact on many aspects of social development, like economic crises, insufficient public services and social exclusion (Bourguignon & Chakravarty, Citation2003; Zhou & Liu, Citation2019) . Under such a flagging social context, it will significantly stimulate fierce discussions amongst economists. Meanwhile, to eliminate its adverse effects, a series of corresponding policies are formulated. The generation of policies cannot do without the support of scientific works. Consequently, many concepts related to poverty cycles are likely to be re-proposed, and generally, new ideas and theories are also derived from them. For instance, during the economic crisis after World War II, the vicious circle of poverty was put forward (Bauer, Citation1965). It pointed out that chronic poverty in developing countries is due to several interconnected and interacting ‘vicious circle’ series in the economy. To some extent, this shows that the development of scientific literature is also cyclical and affected by the actual economy.
Up to now, various publications have studied the interplay between poverty and other relevant events. According to Marinho et al. (Citation2017), a significant inverse relationship between public investment in infrastructure and poverty was confirmed. Information and communication technologies can effectively boost financial inclusion and help poverty reduction (Mushtaq & Bruneau, Citation2019). Also, Cruz and Ahmed (Citation2018) argued that the poorest countries are going through age-structure changes that maybe generate development, and the increase in the proportion of the working-age population plays a crucial role in promoting poverty reduction. What is more, poverty alleviation policy would largely promote economic growth (Breunig & Majeed, Citation2020). We can easily find that even in the more prosperous era, people are still interested in the research of poverty cycles. During poverty crises, there may be an increase in reflection on poverty cycles and crises. Therefore, the inference of this paper needs further investigation and data support.
In the last few decades, the bibliometrics has become a powerful tool for exploring the potential cyclicality in the literature. Ertz and Leblanc-Proulx (Citation2018) provided new insight into the development of collaborative economic research via conducting bibliometrics and network analysis concerning Scopus and web of science. In the circular economy study of the European Union and China, with the help of the bibliometric analysis from 2006 to 2016, Türkeli et al. (Citation2018) pointed out that the research on consumer acceptance, social innovation and alternative economies still has major defects that need to be overcome. In addition, the 20 future research questions about corruption in banks were identified based on a bibliometric review (Bahoo, Citation2020). Indeed, the growing discipline of bibliometrics drives scientific research traceable.
Collectively, these studies outline a critical role for our interest. So far, no one has yet examined the links between poverty cycles in actual economic activity and the economic literature on poverty cycles. However, a similar study was performed by Geiger and Kufenko (Citation2016). Their research showed that business cycles and crises in economic variables have an impact on discussions in the literature. They conducted a bibliometric analysis based on the JSTOR database, in which, once the search terms used in the text, the documents were counted. After that, under the framework of the VAR model, the interaction between business cycles and scientific works was quantitatively explored.
The above research undoubtedly provides an excellent thought for the survey of this paper, but an important issue is of particular concern. In their study, it is counted as long as the search term appears in the document. It is unreliable to some extent because the search term does not mean the core research topic. Maybe it is a simple switch in introductions to economic texts, whatever their specific topic (Geiger & Kufenko, Citation2016). Hence, we apply topic word retrieval to gather documents in this paper, which will effectively reduce the counting error.
3. Materials and methods
To estimate the impact of poverty cycles in the economy on economic research, we employ the econometric approaches with time-series data following Geiger and Kufenko (Citation2016). Therefore, the materials and methods are described in this section. First, the literature database and related search terms about bibliometrics are determined. What is more, the economic variables that characterise actual economic activity are outlined. Finally, we introduce the econometric approaches applied in this paper.
3.1. Bibliometrics
Bibliometrics is a methodical technique to quantitatively analyse all knowledge carriers via mathematical and statistical methods (Mourao & Martinho, Citation2020). As a sunrise topic or subject, nowadays, it has become a powerful tool to highlight the main outcomes and identify trends in the literature (Merigó et al., Citation2018). To a large extent, the choice of data determines the results of bibliometric analysis. Therefore, it is necessary to consider this issue seriously. Currently, there are all kinds of possible data sources for bibliometrics, including web of science, Elsevier, EBSCO and JSTOR, typically. Considering that JSTOR has shown clear superiority in similar problems (Geiger, 2014; Geiger & Kufenko, Citation2016), thus, the bibliometric time-series data are acquired from JSTOR.
JSTOR is a non-profit organisation that digitises outdated journals. It was established in 1995. The goal of JSTOR is to recruit outdated western journals, especially in the US, which coincides with the research area of this paper. So far, more than 700,000 academic periodicals are included in the ‘Economics’ subject category, and even more 1,077,000 in ‘Business & Economics’ subject group category (which includes the former). First of all, the literature type for bibliometric is limited to journals, i.e., book chapters, research reports and pamphlets are excluded. There are two reasons for this, (1) the literature in JSTOR is mainly composed of journals; (2) the latest research and most relevant work are often presented in journals. JSTOR includes many high-ranking journals (http://ideas.repec.org/top/top.journals.all.html), which further provides many valuable samples for the study of this paper.
According to the data source, the search terms in JSTOR can be selected and screened. We finally establish 12 key notions after reading a series of previous relevant studies (Meshelemiah, Citation2012; Panori et al., Citation2019). They are as follows: ‘poverty’, ‘food’, ‘income’, ‘households’, ‘crime’, ‘disease’, ‘traffic’, ‘environment’, ‘price’, ‘crisis’, ‘trade’ and ‘slum’. However, a new problem quietly emerges. In previous similar studies, the journal articles were counted as long as the terms appear once or more in the full text. This way seems to be unreasonable since the appearance of the search term in the journal articles does not mean that the research theme or topic is relating it. Therefore, we apply the manner of topic word retrieval to obtain data in this paper. The selected search terms undertake different implications at different scenarios are essential to highlight. If we take a closer look at such evolutions, an abundant systematic and complicated analysis must be performed. Nevertheless, this is another question worth studying and will not be explained and addressed in this paper.
The US was founded in 1776, and the period for retrieval should reasonably start from its vicinity. Given poverty cycles since the early 20th century in the US, this is the focus of this paper. The time frame is set to 1900–2019. With regards to the research question in this paper, it mainly focuses on the analysis of frequencies of documents containing core notions. That is to say, the data for bibliometrics are presented in numerical form. Here are two options for counting, i.e., absolute numbers and relative numbers. As the number of academic documents collected by JSTOR is not fixed and it increases and fluctuates annually, we employ the latter, namely the percentage of journals which contain a particular term to all journals in a certain group (‘Economics’ or comparison group ‘Business and Economics’). For instance, if the relative frequency of ‘poverty’ is 1.2% in a given year, then 1.2% of these journal articles are poverty-related in the corresponding category for that year.
The 12 search terms retrieved in the ‘Economics’ category are with an ‘E’ before the respective notion name, with a ‘B’ in the ‘Business and Economics’ category. For example, ‘poverty’ in ‘Economics’ denotes as ‘E-poverty’ and ‘food’ in ‘Business and Economics’ denotes as ‘B-food’.
3.2. Economic variables
To measure the actual economic activity affected by poverty cycles, quantitative economic indicators for the US need to be constructed. At this point, we face another challenge. Although we can ensure that all collected economic data are from the US, academic literature for economic research is not only for the US, maybe for any country or region in the world. It will lead to out-of-sample data doped in bibliometrics. However, it is a problem that cannot be avoided by any existing extensive literature database. Nevertheless, we can still believe that the US as the world’s largest economy is bound to have more economic problems studied by scholars from various countries, like poverty cycles in this paper. Also, we select literature written in English, and the US is undoubtedly our best choice.
According to the trader’s guide to key economic indicators by Yamarone (Citation2012), seven appropriate economic indicators were applied to measure economic development and activity in this paper. They are real GDP per capita, consumption price index (CPI), unemployment rate, industrial production index, real per capita disposable income, 10-year term government bond yields and consumer confidence index, respectively. In the research questions of economics, the variables generally need to be logarithmic, except for the ratio variables. Here, we choose the natural logarithm commonly used. As illustrated in , the symbols, description, time frames and their respective data sources of all variables are listed.
Table 1. Economic variables for the US.
3.3. Econometric methods
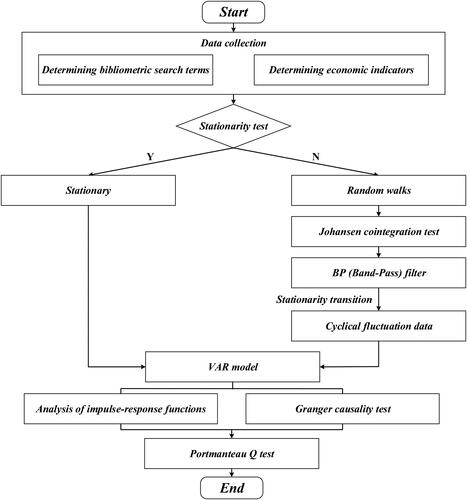
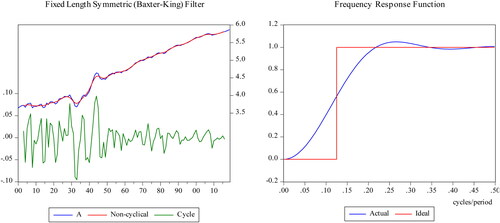
In this part, the study process and econometric approaches employed in this paper will be described in detail. As an implicit assumption, the time-series data in a classical econometric model must be stationary. Otherwise, it will cause spurious regression. Therefore, the unit root test for the stationarity of bibliometric and economic variables should be performed firstly. The DF (Dickey-Fuller test), ADF (Augmented Dickey-Fuller test) and DF-GLS (Dickey-Fuller with Generalised Least Squares test) are the three standard methods for unit root test. Considering that the test performance of DF-GLS is better than the former two (Elliott et al., Citation1996), we choose the DF-GLS test in this paper. If the bibliometric and economic variables are stationary, then we go straight to the VAR model for further analysis. If not, we utilise the Johansen co-integration test to detect whether there is a co-integration relationship amongst variables (Johansen, Citation1988). For random walk data, they need to be converted into stationary. Fortunately, with the help of the BP filter, we could achieve this transformation well. The BP filter generates cyclical fluctuation data, expressed as ‘c-variable’, namely with a ‘c’ before the corresponding variable. After that, in the same light, the VAR model is employed. Once the VAR model is performed, the impulse-response functions and Granger causality test are carried out (Granger, Citation1969). Finally, we use a Portmanteau Q test to check whether the model’s residuals in this paper are white noise (Ljung & Box, Citation1978). shows the entire flow chart of the study.
Figure 1. Flow chart of the econometric analysis. Source: Authors’ own model.
For a VAR (p) model with t () samples, the mathematical expression is
(1)
(1)
where
depicts the cyclical fluctuations in the economic variables;
refers to the cyclical fluctuations in the bibliometric variables;
represents the constant; A, B, C and D indicate different coefficients; p is the lag order and
is the disturbance vector. In general, the optimal lag order of VAR is determined through the parsimony principle of Akaike info criterion (AIC), Schwarz criterion (SC) and Hannan-Quinn (HQ) information criteria.
Granger causality is not causality in the usual sense, just ‘Granger causality’ in a statistical sense. Its results represent a prediction and cannot be used as a basis for affirming or negating causality. Of course, even if Granger causality is not equal to actual causality, its reference value will not be hindered. Generally, the null hypothesis of the Granger causality test is that there is no causality. Applied to our research, that is to say, the economic variable does not Granger cause bibliometric variable
and vice versa. If the null hypothesis is rejected, it indicates that there exists a Granger causality between the economic variables and the bibliometric ones. Consequently, the economic development in a certain period can well predict the future bibliometric trends and vice versa. For a comprehensive analysis, the Granger causality test in the opposite direction, namely from bibliometric variables to economic ones, is also conducted.
4. Results and discussion
In this section, the empirical results and some discussions are presented. As a result, a descriptive survey of bibliometric results is started first. Then, an investigation about the relationship between poverty cycles in the economy and economic research from the perspective of econometrics is given in Section 4.2. Finally, Section 4.3 illustrates some discussions.
4.1. Descriptive analysis of bibliometric results
In this part, we present the results of bibliometrics and perform the necessary analysis and interpretation. As shown in and , the relative frequencies of the 12 search terms are displayed for journal articles in JSTOR from 1900 to 2019, including the ‘Business and Economics’ category and ‘Economics’. Although the two bibliometrics are from different categories, there is not much difference in the trend, except for numerical values. In particular, terms ‘trade’, ‘price’ and ‘income’ always appear more frequently than others. Concurrently, almost all terms have a severe swing around 1945, especially ‘food’. A closer look at the ‘environment’ series, a continuous and rapid growth, has been from around the 1950s, standing out from all lines, until now. What is more, the frequency of ‘slum’ has always been low from beginning to end, and its value is far lower than other sequences.
Figure 2. The relative frequencies of bibliometric variables in ‘Business and Economics’ category. Source: Authors’ calculation.
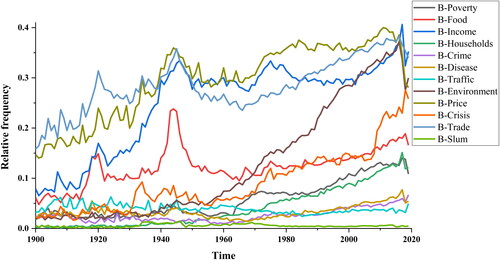
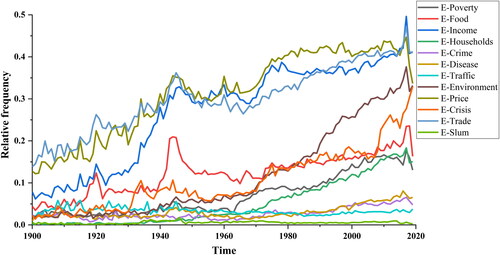
Figure 3. The relative frequencies of bibliometric variables in ‘Economics’ category. Source: Authors’ calculation.
In , the whole picture is divided into two areas, with ‘food’ as the line of demarcation. The top half of the figure shows the annual trends of the ‘trade’, ‘price’ and ‘income’, respectively. Interestingly, there exist three phases in their fluctuations. From 1900 until around 1945, the relative frequency of ‘trade’ is higher than ‘price’, and ‘price’ is higher than ‘income’. During 1945 to approximately 1985, ‘price’ is the strongest, followed by ‘income’ and ‘trade’. From 1985 until now, ‘price’, ‘trade’ and ‘income’ are shown in descending order. Together, all three series experience an evident decline synchronously from about 1945 until the 1970s, and then gradually climb to a higher point again. Later, we put insight into the middle part of the figure, the ‘food’ line stands out (plotted with red). Except for a shift in trends around 1945, and it also happens in the 1920s, even if the fluctuation is smaller. The relative frequency of ‘food’ grows in a steady trend from the 1970s and achieves similar level to the 1920s in around 2018. Finally, the bottom half of the figure nearly shows a consistent fluctuation trend for the remaining eight series. From 1900 to the 1960s, an almost stable wave is performed for all lines, except for ‘crisis’ and ‘slum’. The ‘crisis’ appears a violent increase first, and then a gradual decline in volatility between the 1930s and 1960s. Nevertheless, the ‘slum’ experiences a slight rise in the 1930s, and the rest of the time is at a low value. Conversely, from the 1960s to the present, although they are all in a rising state, the growth rates are different. The ‘environment’ takes the lead, followed by ‘crisis’, then ‘poverty’ and ‘households’, finally ‘disease’, ‘crime’ and ‘traffic’.
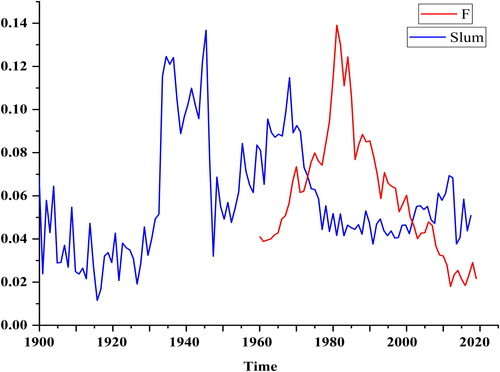
In , we find no significant differences in the distribution of trends compared to . The only event worthy of our attention is that the intensity of the fluctuations in is slightly weaker than that in , primarily caused by the differences in data sources, and ‘Economics’ category is more targeted. To sum up, poverty cycles in the economic literature are associated with movements in actual economic activity. In , the time trends for the F (i.e., 10-year term government bond yields) and the relative frequency of ‘slum’ in the ‘Business and Economics’ category are displayed together. A striking characteristic of these two lines immediately appears. The strict parallel relationship between peaks and troughs reveal that there exists a specific connection between them. Furthermore, there is an apparent lag in fluctuations and movements. However, what is not consistent with common sense is that the peaks of F appear after the bibliometric series. As to this point, further discussions are performed in Section 4.3.
Figure 4. F and the relative frequency of ‘slum’ in ‘Business and Economics’ category. Source: Authors’ calculation.
In the following, the econometric approach is adopted to carry out a more objective quantitative measurement.
4.2. The impact of poverty cycles in the economy on economic research
In this subsection, an econometric analysis is strictly implemented based on the study framework described in section 3.3. First of all, the unit root test for all variables is executed. The test results show that all time-series data are not stationary. Once identified as the time-series data of random walks, we need to conduct a Johansen co-integration test on them. The results state that there is no co-integration relationship between the bibliometric and economic variables, shown in .
Table 2. The Johansen co-integration test for all variables.
Then, we utilise BP filter to convert the original data into stationary cyclical fluctuation data. For example, as shown in , the cyclical fluctuations of A (i.e., real GDP per capita) are captured. Finally, the critical part of this paper is entered, that is, the application of the VAR model and analysis of its results. The variables in this paper do not use a uniform period, especially for economic variables, because some observations will be lost when we choose a consistent period.
Figure 5. The filtered result of A (left-hand side). Source: Authors’ calculation.
Under the architecture of established VAR model, the results of Granger causality test for the bibliometric and economic variables are obtained, shown in and , where is for ‘Business and Economics’ category and is for ‘Economics’. What is more, we employ the Portmanteau Q test for the white noise in residuals. If the residuals of the VAR model are not white noise, then the results of the Granger causality test are questionable and should be handled seriously. In this paper, the 10% significance level is adopted for all the tests. The results of the Q test indicate that nearly all the residuals are white noise, except for several, which are no impact for subsequent analysis. Meanwhile, we also distinguish amongst the general Granger causality (i.e., economic variables to bibliometric ones), Granger causality in the opposite direction and instantaneous Granger causality. As noted in and , there are two columns of data under each economic variable, and left are the results of Granger causality test from economic variables to bibliometric ones, right are bibliometric to economic.
Table 3. The results of Granger causality test in ‘Business and Economics’ category.
Table 4. The results of Granger causality test in ‘Economics’ category.
In , the p values reveal all test results for the economic and bibliometric variables. The cyclical fluctuations of real GDP per capita Granger cause bibliometric series on ‘poverty’, ‘food’ and ‘disease’; the cyclical fluctuations of CPI Granger cause the ‘poverty’, ‘food’, ‘income’, ‘crime’ and ‘disease’; the cyclical fluctuations of unemployment rate only Granger cause one bibliometric data, i.e., ‘trade’; the cyclical fluctuations of industrial production index Granger cause the most, namely ‘poverty’, ‘food’, ‘income’, ‘disease’, ‘traffic’, ‘price’, ‘crisis’ and ‘trade’ yet; the cyclical fluctuations of real per capita disposable income Granger cause ‘food’ and ‘crime’; unfortunately, the cyclical fluctuations of 10-year term government bond yields do not Granger cause any bibliometric variable; the cyclical fluctuations of consumer confidence index Granger cause bibliometric data on ‘traffic’ and ‘crisis’.
As the subset of ‘Business and Economics’ category, the experimental samples from the ‘Economics’ sphere can help us further verify the hypothesis of this paper. In , the cyclical fluctuations of real GDP per capita Granger cause only ‘food’; the cyclical fluctuations of CPI Granger cause the ‘food’ and ‘crime’; neither the cyclical fluctuations of unemployment rate nor 10-year term government bond yields Granger cause any bibliometric data; similarly, the cyclical fluctuations of industrial production index Granger cause the most, that is, ‘food’, ‘income’, ‘disease’, ‘traffic’, ‘environment’, ‘price’, ‘crisis’ and ‘trade’; the cyclical fluctuations of real per capita disposable income Granger cause fluctuations in economic literature related to the terms ‘food’ and ‘crisis’; the cyclical fluctuations of consumer confidence index Granger cause the ‘crime’. In summary, for the ‘Economics’ sphere, 14 events of general Granger causality are found; whereas, 21 events are discovered for the ‘Business and Economics’.
Also, there exist several instantaneous Granger causalities in this experiment. A note of caution is due here since the instantaneous occurrence is rare, in contrast with the single-track Granger causality between economic variables and bibliometric ones. For one thing, in , the instantaneous Granger causalities are as follows: CPI and ‘food’, ‘disease’; industrial production index and ‘crisis’. For another, in , there is only one instantaneous Granger causality, namely industrial production index and ‘environment’.
Meanwhile, the opposite direction of Granger causality test, namely the reverse Granger causality from bibliometric variables to economic ones, also has reference values for our conjecture. For ‘Business and Economics’ sphere, the cyclical fluctuations in real GDP per capita and ‘crime’, ‘traffic’, ‘price’ and ‘trade’; CPI and ‘price’, ‘slum’; unemployment rate and ‘crime’, ‘disease’, ‘traffic’ and ‘price’; industrial production index and ‘slum’; real per capita disposable income and ‘disease’; 10-year term government bond yields and ‘income’; consumer confidence index and ‘households’, ‘disease’ and ‘price’. For ‘Economics’ sphere, real GDP per capita and ‘poverty’, ‘crime’; CPI and ‘income’, ‘disease’, ‘price’ and ‘slum’; unemployment rate and ‘crime’, ‘traffic’; industrial production index and ‘slum’; real per capita disposable income and ‘disease’, ‘environment’; 10-year term government bond yields and ‘environment’.
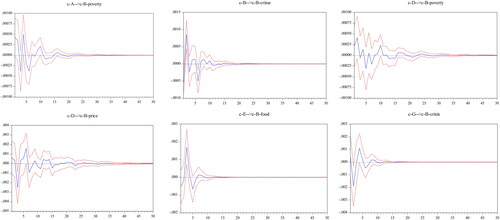
To further study the dynamic relationship between variables, a simulation experiment is displayed, that is, impulse-response functions. According to the research purpose of this paper, whether or not poverty cycles in the economy have a significant effect on the development of economic literature. Therefore, based on the results of the Granger causality test, we take the ‘Business and Economics’ category as an example, the simulations of how the bibliometric terms react on economic variables are performed. Before generating the impulse-response functions, the stability of the VAR model needs to be estimated. Due to space limitations, shows the selected impulse-response functions. It can be seen that the impacts of economic variables on literature ones always display a situation with some notable up and downs around zero. Although they all tend to converge eventually, the number of steps is varied. The impulses of real GDP per capita on ‘poverty’ and industrial production index on ‘poverty’, ‘price’ converge after around 30 steps; CPI on ‘crime’ converges after about 25 steps; whereas, real per capita disposable income on ‘food’ and consumer confidence index on ‘crisis’ converge after only approximately 15 steps.
Figure 6. The selected impulse-response functions for ‘Business and Economics’ category. Source: Authors’ calculation.
4.3. Discussions
An initial objective of the study is to identify whether poverty cycles in the economy affect economic research. No matter the notable trends in the scientific literature from 1900 to 2019, or the quantitative results of the Granger causality test, they both support the inference of this paper. In , the relative frequencies of most terms experience a notable fluctuation around the 1920s. An economic crisis broke out in the US around the 1920s, after World War I (1914–1918). At that time, conservative and autistic national policies were implemented by the US, thus bringing the economy of the US to the brink of collapse, and many poor people appeared in society (Mursa, Citation2012). As a matter of course, poverty cycles emerged as synchronisation with business cycles (Mudambi & Taylor, Citation1995). In this way, many related scientific works appeared at this stage. What is more, the relative frequencies of almost all terms present a huge fluctuation about 1945, undergoing a process of surging to decay. Combined with the significant events in the US at that moment, we can interpret this phenomenon well. In the 1930s, the Great Depression broke out in the US. As a ‘byproduct’, the poverty crises also extended to the 1940s. Together, the outbreak of World War II (1939–1945) provided an excellent opportunity for American economic development. With the continuous adjustment of economic policies (1941–1945), the US has successfully passed the most critical times. Therefore, we have reason to believe that under the context of poverty crises, and the urgent need for the US to formulate the right policies to lead it out of poverty cycles, it will attract the interest of many economists to tackle this issue. As an external manifestation, the economic literature related to poverty grows rapidly during this period. Moreover, econometric evidence of the Granger causality test, whether 14 events of general Granger causality in the ‘Economics’ sphere or 21 events in ‘Business and Economics’, is further towards the point of this paper.
In terms of specific values of relative frequencies for the search terms, there are some unique phenomena and compelling findings. In , the related scientific literature about ‘trade’ and ‘price’ occupy a larger proportion and continue to rise until about 1945. Through further observation, the frequency level of ‘income’ is close to ‘trade’ and ‘price’ in 1945, which is much lower than them at the beginning. Because the ‘income’ grows faster than other time-series during the period 1900–1945, despite there are some slight ups and downs along with its movement. The issue of income distribution has gradually become a hot topic at that time. Simultaneously, the timeline for ‘food’ peaks around 1945. Therefore, an appealing argument is put forward in this paper: poverty cycle theory evolved from business cycle theory, and just as business cycle theory evolved from crisis theory (Schiaffino et al., Citation2017). Škare et al. (Citation2018) also reported this finding, business cycles and poverty cycles are two faces of the same coin. Since then, the research on ‘income’ has remained high and always been in the top three ranks. It follows the poverty problem that has plagued the US to this day (Robles Aguilar & Sumner, Citation2020).
Furthermore, after approximately 1945, there is a steep decline in ‘food’, and the rest of the time-series also show varying degrees of reduction, however, much milder than ‘food’. After World War II, the economic development of the US has recovered well, which greatly reduced many social problems caused by business cycles and poverty cycles. For the transition brought by economic growth, this paper proposes a bold conjecture, that is, poverty cycles are weakening faster than business cycles. In addition, it is a tremendous increase in ‘crisis’ and ‘environment’ from the 1960s. The reason may be that after the entire poverty cycle, many scholars have become interested in the discussions on previous specific crisis events that happened in poverty cycles and a review of the complex economic environment. Another supporting finding is that the ‘crisis’ goes through an unprecedented increase around 2008, and this time point happened to be within the time frame of the global economic crisis (2007–2009). As for why the value of the ‘environment’ is always higher than the ‘crisis’ since the 1960s, it is probably because the ‘environment’ is a more widely applicable term that goes beyond the scope of the poverty cycle theory. In contrast, the ‘crisis’ is more related to economic phenomena.
Next, let us discuss another issue, namely the reverse and the instantaneous Granger causality. On the whole, compared to the general and reverse Granger causality, the number of instantaneous Granger causalities is much less, but its emergence lays the foundation for further research. For the reverse Granger causality, a possible explanation for this might be that the relevant research of economists will affect the formulation of national future policies and guidelines to a great extent (Moraru et al., Citation2018). Under such circumstances, a policy channel is established, and the economic literature related to poverty cycles can impact the economic data. Meanwhile, we can also further assume that economic literature may generate ‘poverty’ in the actual economic activity. illustrates this question commendably. The movement of 10-year term government bond yields is nearly parallel to ‘slum’. In contrast, the peaks in the bibliometric series appear before the 10-year term government bond yields. Finally, we have to admit that there may exist problems like statistical errors and missing variables that affect the test results.
For the instantaneous Granger causality, it is the strong evidence of the interaction between economic activity and scientific research. Nevertheless, we cannot rule out this result is due to the granularity of the collected data. In other words, the frequency of data can be divided into annual, quarterly, monthly or even smaller time slices, and the data of different frequencies sometimes affect the final test results (Götz et al., Citation2016). However, given that the availability of data, and the submission and review process of academic journals, only the annual data can be adopted, although the higher frequency data may generate more practical causality. Another explanation may be that some high-quality economic literature can considerably predict future economic trends and promptly analyse and dissect the patterns in the economic data thoroughly. Additionally, when poverty cycles occur, journal editors also try their best to recruit more journal articles related to the topic. If the scientific literature generated by poverty crises is from two adjacent times, then they are likely to be published in the same year. It naturally brings the biases in the annual data of the variables, which in turn leads to the appearance of the instantaneous Granger causality.
In summary, these results corroborate the findings of a great deal of the previous work. However, this paper provides a more powerful quantitative research framework base on the bibliometrics and econometrics. One example is shown in . The impact of economic variables on literature ones is quantitatively characterised. These actual numerical fluctuations allow us to draw more general results. Finally, an issue should be pointed out that the rationality of the selected bibliometric and economic variables. Although an ample preliminary investigation is carried out for the identification of variables, they still cannot fully reflect the actual situation of the economy and literature due to the long period. Of course, anyway, this paper has obtained satisfactory results from our data.
5. Conclusion
The study is designed to determine the effect of poverty cycles in the economy on economics. We utilise bibliometrics and econometric approaches to quantitatively examine the correlation between poverty cycles and the relevant scientific literature. The bibliometric results of the 12 search terms clarify the hypothesis of this paper intuitively. Meanwhile, the results of the econometric investigation show that there exist 14 Granger causalities from the economic variables to bibliometric ones in the ‘Economics’ sphere and 21 in the ‘Business and Economics’. It further validates our hypothesis after the scientific experimental scheme. Additionally, nearly the same amount of reverse Granger causalities, i.e., from the bibliometric variables to economic ones, is also found. What’s more remarkable is the appearance of instantaneous Granger causality, even if its share is minor. These findings indicate that there may be an interaction between literature variables and economic data, and the literature can predict poverty cycles in the economy. Another helpful finding is the impulse-response functions. They enable us to detect that the influence of economic variables on literature ones is up and down, and the intensity is gradually reduced to zero.
The work of this study makes several contributions to the current literature. For one thing, this paper provides a deeper insight into poverty cycles in economic research from the perspective of bibliometric visualisation. For another, we establish a quantitative framework for detecting the impact of poverty cycles in the economy on economic research. These will have many important implications for future practice. One source of weakness that could have affected the measurement of poverty cycles in economic research is the determination of search terms. An additional uncontrolled factor is the possibility of whether all journal articles are aimed at the US. More handling and steps on these would help us to establish a greater accuracy on this matter. Despite its limitations, the study certainly adds to our understanding of poverty cycles in the economy and economics, and it would be a fruitful area for further work.
Disclosure statement
No potential conflict of interest was reported by the author(s)
Additional information
Funding
References
- Yamarone, R. (2012). The trader’s guide to key economic indicators (3rd ed., pp. 1–304). Bloomberg Press.
- Ayyagari, M., Beck, T., & Hoseini, M. (2020). Finance, law and poverty: Evidence from India. Journal of Corporate Finance, 60, 101515. https://doi.org/https://doi.org/10.1016/j.jcorpfin.2019.101515
- Bahoo, S. (2020). Corruption in banks: A bibliometric review and agenda. Finance Research Letters, 35, 101499. https://doi.org/https://doi.org/10.1016/j.frl.2020.101499
- Bane, M. J., & Ellwood, D. T. (1986). Slipping into and out of poverty: The dynamics of spells. The Journal of Human Resources, 21(1), 1–23. https://doi.org/https://doi.org/10.2307/145955
- Bauer, P. T. (1965). The vicious circle of poverty. Weltwirtschaftliches Archiv, 95, 4–20.
- Bourguignon, F., & Chakravarty, S. R. (2003). The measurement of multidimensional poverty. The Journal of Economic Inequality, 1(1), 25–49. https://doi.org/https://doi.org/10.1023/A:1023913831342
- Breunig, R., & Majeed, O. (2020). Inequality, poverty and economic growth. International Economics, 161, 83–99. https://doi.org/https://doi.org/10.1016/j.inteco.2019.11.005
- Cruz, M., & Ahmed, S. A. (2018). On the impact of demographic change on economic growth and poverty. World Development, 105, 95–106. https://doi.org/https://doi.org/10.1016/j.worlddev.2017.12.018
- Dhrifi, A., Jaziri, R., & Alnahdi, S. (2020). Does foreign direct investment and environmental degradation matter for poverty? Evidence from developing countries. Structural Change and Economic Dynamics, 52, 13–21. https://doi.org/https://doi.org/10.1016/j.strueco.2019.09.008
- Elliott, G., Rothenberg, T. J., & Stock, J. H. (1996). Efficient tests for an autoregressive unit root. Econometrica, 64(4), 813. https://doi.org/https://doi.org/10.2307/2171846
- Ertz, M., & Leblanc-Proulx, S. (2018). Sustainability in the collaborative economy: A bibliometric analysis reveals emerging interest. Journal of Cleaner Production, 196, 1073–1085. https://doi.org/https://doi.org/10.1016/j.jclepro.2018.06.095
- Garrity, P., & Martin, C. (2018). Developing a microfinance model to break the cycle of poverty. Business Horizons, 61(6), 937–947. https://doi.org/https://doi.org/10.1016/j.bushor.2018.07.002
- Geiger, N., & Kufenko, V. (2016). Business cycles in the economy and in economics: An econometric analysis. Scientometrics, 107(1), 43–69. https://doi.org/https://doi.org/10.1007/s11192-016-1866-9
- Geiger, N. (2014, 29–31 May). The rise of behavioural economics: A quantitative assessment [Paper presentation]. The 18th Annual ESHET Conference on “Liberalisms: Perspectives and Debates in the History of Economic Thought, Lausanne, Switzerland.
- Götz, T. B., Hecq, A., & Smeekes, S. (2016). Testing for Granger causality in large mixed-frequency VARs. Journal of Econometrics, 193(2), 418–432. https://doi.org/https://doi.org/10.1016/j.jeconom.2016.04.015
- Gozgor, G., Tiwari, A. K., Khraief, N., & Shahbaz, M. (2019). Dependence structure between business cycles and CO2 emissions in the U.S.: Evidence from the time-varying Markov-Switching Copula models. Energy, 188, 115995. https://doi.org/https://doi.org/10.1016/j.energy.2019.115995
- Granger, C. W. J. (1969). Investigating causal relations by econometric models and cross-spectral methods. Econometrica, 37(3), 424–438. https://doi.org/https://doi.org/10.2307/1912791
- Johansen, S. (1988). Statistical analysis of cointegration vectors. Journal of Economic Dynamics and Control, 12(2–3), 231–254. https://doi.org/https://doi.org/10.1016/0165-1889(88)90041-3
- Khan, W., Shaorong, S., & Ullah, I. (2017). Doing business with the poor: The rules and impact of the microfinance institutions. Economic Research-Ekonomska Istraživanja, 30(1), 951–963. https://doi.org/https://doi.org/10.1080/1331677X.2017.1314790
- Liu, Y., & Xu, Y. (2016). A geographic identification of multidimensional poverty in rural China under the framework of sustainable livelihoods analysis. Applied Geography, 73, 62–76. https://doi.org/https://doi.org/10.1016/j.apgeog.2016.06.004
- Ljung, G. M., & Box, G. E. P. (1978). On a measure of lack of fit in time series models. Biometrika, 65(2), 297–303. https://doi.org/https://doi.org/10.1093/biomet/65.2.297
- Marinho, E., Campelo, G., França, J., & Araujo, J. (2017). Impact of infrastructure expenses in strategic sectors for Brazilian poverty. EconomiA, 18(2), 244–259. https://doi.org/https://doi.org/10.1016/j.econ.2017.01.002
- Martínez-López, F. J., Merigó, J. M., Gázquez-Abad, J. C., & Ruiz-Real, J. L. (2020). Industrial marketing management: Bibliometric overview since its foundation. Industrial Marketing Management, 84, 19–38. https://doi.org/https://doi.org/10.1016/j.indmarman.2019.07.014
- Merigó, J. M., Pedrycz, W., Weber, R., & de la Sotta, C. (2018). Fifty years of information sciences: A bibliometric overview. Information Sciences, 432, 245–268. https://doi.org/https://doi.org/10.1016/j.ins.2017.11.054
- Meshelemiah, J. C. A. (2012). The new jim crow: Mass incarceration in the age of colorblindness, by Michelle Alexander. Journal of Social Work Practice in the Addictions, 12(1), 107–108. https://doi.org/https://doi.org/10.1080/1533256X.2012.648890
- Moraru, A. D., Barbulescu, A., & Duhnea, C. (2018). Consumption and hysteresis: The new, the old, and the challenge. Economic Research-Ekonomska Istraživanja, 31(1), 1965–1980. https://doi.org/https://doi.org/10.1080/1331677X.2018.1498365
- Mourao, P. R., & Martinho, V. D. (2020). Forest entrepreneurship: A bibliometric analysis and a discussion about the co-authorship networks of an emerging scientific field. Journal of Cleaner Production, 256, 120413. https://doi.org/https://doi.org/10.1016/j.jclepro.2020.120413
- Mudambi, R., & Taylor, L. W. (1995). Some non-parametric tests for duration dependence: An application to UK business cycle data. Journal of Applied Statistics, 22(1), 163–177. https://doi.org/https://doi.org/10.1080/757584405
- Mursa, G. C. (2012). The world economic crisis. A non-conventional approach. Procedia – Social and Behavioral Sciences, 62, 1110–1114. https://doi.org/https://doi.org/10.1016/j.sbspro.2012.09.190
- Mushtaq, R., & Bruneau, C. (2019). Microfinance, financial inclusion and ICT: Implications for poverty and inequality. Technology in Society, 59, 101154. https://doi.org/https://doi.org/10.1016/j.techsoc.2019.101154
- Muyanga, M., Jayne, T. S., & Burke, W. J. (2013). Pathways into and out of poverty: A study of rural household wealth dynamics in Kenya. Journal of Development Studies, 49(10), 1358–1374. https://doi.org/https://doi.org/10.1080/00220388.2013.812197
- Niu, T., Chen, Y., & Yuan, Y. (2020). Measuring urban poverty using multi-source data and a random forest algorithm: A case study in Guangzhou. Sustainable Cities and Society, 54, 102014. https://doi.org/https://doi.org/10.1016/j.scs.2020.102014
- Panori, A., Mora, L., & Reid, A. (2019). Five decades of research on urban poverty: Main research communities, core knowledge producers, and emerging thematic areas. Journal of Cleaner Production, 237, 117850. https://doi.org/https://doi.org/10.1016/j.jclepro.2019.117850
- Rakotondramaro, H., & Andriamasy, L. (2016). Multivariate Granger causality among tourism, poverty and growth in Madagascar. Tourism Management Perspectives, 20, 109–111. https://doi.org/https://doi.org/10.1016/j.tmp.2016.08.005
- Robles Aguilar, G., & Sumner, A. (2020). Who are the world’s poor? A new profile of global multidimensional poverty. World Development, 126, 104716. https://doi.org/https://doi.org/10.1016/j.worlddev.2019.104716
- Schiaffino, P., Crespo, R. F., & Heymann, D. (2017). Processing uncertainty: Evolving beliefs, fallible theories, rationalizations and the origins of macroeconomic crises. Journal of Applied Economics, 20(2), 305–328. https://doi.org/https://doi.org/10.1016/S1514-0326(17)30014-4
- Si, D.-K., Liu, X.-H., & Kong, X. (2019). The comovement and causality between stock market cycle and business cycle in China: Evidence from a wavelet analysis. Economic Modelling, 83, 17–30. https://doi.org/https://doi.org/10.1016/j.econmod.2019.10.003
- Škare, M., Prziklas Druzeta, R., & Škare, D. (2018). Measuring poverty cycles in the US 1959–2013. Technological and Economic Development of Economy, 24(4), 1737–1754. https://doi.org/https://doi.org/10.3846/tede.2018.5212
- Türkeli, S., Kemp, R., Huang, B., Bleischwitz, R., & McDowall, W. (2018). Circular economy scientific knowledge in the European Union and China: A bibliometric, network and survey analysis (2006–2016). Journal of Cleaner Production, 197, 1244–1261. https://doi.org/https://doi.org/10.1016/j.jclepro.2018.06.118
- Välilä, T. (2020). Infrastructure and growth: A survey of macro-econometric research. Structural Change and Economic Dynamics, 53, 39–49. https://doi.org/https://doi.org/10.1016/j.strueco.2020.01.007
- Wang, Y.-P., & Zhou, X.-N. (2020). The year 2020, a milestone in breaking the vicious cycle of poverty and illness in China. Infectious Diseases of Poverty, 9(1), 11. https://doi.org/https://doi.org/10.1186/s40249-020-0626-5
- Yan, C., & Huang, K. X. D. (2020). Financial cycle and business cycle: An empirical analysis based on the data from the U.S. Economic Modelling. . https://doi.org/https://doi.org/10.1016/j.econmod.2020.01.018
- Zhou, Y., & Liu, Y. (2019). The geography of poverty: Review and research prospects. Journal of Rural Studies. https://doi.org/https://doi.org/10.1016/j.jrurstud.2019.01.008