
 ?Mathematical formulae have been encoded as MathML and are displayed in this HTML version using MathJax in order to improve their display. Uncheck the box to turn MathJax off. This feature requires Javascript. Click on a formula to zoom.
Abstract
Taking the environmental interventions on air quality at G20 Hangzhou Summit as a natural experiment, this paper innovatively establishes an extended synthetic control method with multiple units to evaluate the dynamic treatment effects on air quality improvement at the Summit. The method constructs data-driven weights according to the fluctuation of urban air quality to obtain a more robust and stable estimation with smaller root mean squared prediction error (RMSPE). By minimising RMSPE for pre-intervention model fitting, the study takes nine cities under policy intervention in Zhejiang as treatment cities, and 45 key cities without policy intervention as control cities during 201501–201706 as the final improved experimental scheme. The policy effect of environmental regulations on the average monthly air quality composite index of treated cities in Zhejiang is -0.84 during 201607–201702; while no significant treatment effect is observed since 201702. The results indicate that the environmental policy for the G20 Hangzhou Summit lasted a relatively short period, and it had a significant short-term improvement effect while losing its long-term improving effect on air quality in treated cities. The identification validates the extended synthetic control method with multiple units could also be applied to the policy effect evaluation in other areas.
1. Introduction
Severe air pollution is an important issue for sustainable development in China. ‘The 2017 Statistical Bulletin of National Economic and Social Development’ points out that only 29.3% of cities had reached air quality standards and 70.7% of cities had failed to meet the new strict air quality standard among 338 monitored prefecture-level cities. Air pollution causes huge economic losses. According to the ‘National Environmental Analysis report of the People’s Republic of China’ from the Asian Development Bank and Tsinghua University, the annual economic losses caused by air pollution are about 1.2 percent and 3.8 percent of GDP through the economic costs of related disease and of willingness to pay, respectively. Most importantly, the largest portion of economic losses of health damage is attributed to air pollution. The health benefits resulting from coal control and air pollutants abatement in the Beijing-Tianjin-Hebei region has a range of 366.64–810.48 billion RMB for the whole region from 2015 to 2025 (Sun et al., Citation2018). Due to the physical health risk, mental health risk, and economic cost of haze pollution, Lu et al. (Citation2018) provide evidence that skilled workers perceive that smog pollution risk affects their migration intentions from the Beijing-Tianjin-Hebei region in China.
Government has committed to controlling air pollution through environmental regulation policies such as setting stringent pollutant reduction targets. Besides the long-term environmental regulation policies, local governments tend to adopt more aggressive short-term regulation policies to ensure air quality, especially before a specific large-scale event for a hosting region. During international events such as the 2008 Beijing Olympics Games, the 2010 Shanghai World Expo and the 2014 APEC conference in China, the hosting cities (Beijing, Shanghai) implemented a series of short-term environmental regulation measures to ensure better air quality. The short-term environmental regulation policies mostly involved one single city, i.e. the hosting city. Studies have provided evidence that a series of environmental regulation measures during the Olympic Games had a significant but temporary effect on air quality improvement in Beijing (Chen et al., Citation2013; Zhang et al., Citation2016). The G20 Summit was held in September 2016 in Hangzhou, China. Local government issued ‘The Implementation Plan for Prevention and Control of Air pollution in Zhejiang Province’ (Atmospheric Plan) in April 2016. The Atmospheric Plan assigned the 16 rectification tasks for different cities in Zhejiang Province. It mainly focused on the adjusting of energy structure, preventing motor vehicle and ship pollution, controlling industrial pollution, adjusting the industrial layout and structure, regulating urban dust and soot, controlling rural exhaust gas pollution and preventing pollution from ports and ships, etc. As opposed to the environmental regulations for other large-scale events in Beijing and Shanghai, the ‘Atmospheric Plan’ of G20 Hangzhou Summit in Zhejiang gave specific environmental regulation requirements for different cities; moreover, similar safeguard measures for controlling air pollution were also implemented among neighbouring major cities of Zhejiang Province.
The policy assessment of pollution control is important for adjusting existing measures and developing future measures (Zhang et al., Citation2012). Various studies provided the regulation results of several regulation policies on air pollution, such as the policies of shale gas reserves and water (Chang et al., Citation2014), the traffic regulation policy (Qi, Citation2014; Qiu & Liu, Citation2013), and so on. Early in 1996, Henderson (Citation1996) held that air quality regulation has a direct impact on air quality, and the strength of local supervision is directly related to its effect. Kathuria (Citation2002) found that the ban policy on leaded gasoline and commercial vehicles does not have a good effect on air quality due to the limitation of the applicable object of the policy which is only applicable to new cars, so the policy effect is not significant. Davis (Citation2008) held that the air quality of the study area has not been improved as a result of traffic control measures because of other objective factors and the relatively short period. Qiu and Liu (Citation2013) measured and declared that the motor vehicle restriction policy in Beijing in 2008 had a significant effect on the improvement of the air pollution index in Beijing with the change of air quality before and after the implementation. Based on the functional data perspective, Qi (Citation2014) constructed a functional virtual variable regression model for point-by-point measurement of the policy effect based on this model combined with nitrogen dioxide (NO2) data before, during and after the odd-even traffic restriction period of Lanzhou City in winter 2013. The results showed the restriction policy is statistically significant in improving air quality, and the policy effect exerts a ‘U’ shaped trajectory. Chen et al. (Citation2013) and Zhang et al. (Citation2016) applied DID model and the synthetic control method for single treated units, respectively, and confirmed that a series of regulation measures during the Olympic Games had a significant but temporary effect on air quality improvement in Beijing.
Regression discontinuity design, difference-in-differences method (DID), and synthetic control method are widely applied to the evaluation of policy effects (Nykiforuk et al., Citation2019; Pellegrini et al., Citation2013). Thistlethwaite and Campbell (Citation1960) proposed regression discontinuity design to study the treatment effect for the first time. Compared with other causality analysis methods, they held regression discontinuity design is closer to quasi-natural experiments. Qin et al. (Citation2017) applied regression discontinuity design to study the relationship between human capital and China’s One-Child Policy. Gagliardi and Percoco (Citation2017) also applied regression discontinuity design and found that European Cohesion funds have positive effect on economic growth, which is mostly driven by the successful performance of rural European regions. Xi and Liang (Citation2015) applied regression discontinuity model to investigate the environmental protection input and regional air pollution, and found that local governments have the mechanism of ‘inverse regulation’ of environmental protection expenditure to air pollution, and the discontinuity effect of local cities is obvious. Sun (Citation2017) tested the improvement of improving vehicle emission standards on air quality based on regression discontinuity design. However, regression discontinuity design mainly evaluates the policy effects for the same experimental group with the variation before and after policy implementation. Moreover, it often ignores the research perspectives with different experimental groups and comparison groups. The ‘local random experiment’ near the breakpoint assumes the breakpoint regression satisfies certain conditions. When the attributes (time, geography) are used as grouping features, this randomness may be problematic. The method has certain limitations in external validity.
The difference-in-differences approach includes different test groups and comparison groups for measurement. Stevens (Citation2018) used difference-in-differences model to measure the effects of natural gas prices and environmental policies on natural gas-fired combined cycle utilization. The research reveals that both increase the utilization, but in nationwide averages. The Clean Air Interstate Rule has larger impact on increased utilization. Yang et al. (Citation2017) used the quasi-difference-in-differences method and found that China’s carbon intensity constraint policy (CICP) only has surface success in China, while it has negative effect on the GPP over time. They also mentioned the selection of comparison groups in the DID approach has a certain subjectivity. When applying the DID model to measure policy effects, Zhang et al. (Citation2016) held that different time trends between the test group and the comparison group exist and cannot be effectively decomposed, which causes more difficulty in evaluating policy effects accurately.
Abadie and Gardeazabal (Citation2003) proposed the synthetic control method, which uses the data-driven method to estimate the weight of the comparison group. The similarity between the comparison group and the test group is measured according to the prediction variables before the treatment. Abadie et al. (Citation2010) proposed the basic idea of the ‘permutation tests’ or ‘placebo test’ (Edgington & Onghena, Citation2007) of the synthetic control method through repeatedly resetting the treatment group in the reference group. The placebo test further enhanced the analytical framework of the synthetic control method. The composite comparison group is selected based on the data-driven weighted average of the reference groups obtained under the condition of minimising the prediction error, which overcomes the difference between the comparison group and the disposal group. To a certain extent, the synthetic control method compensates for the defect of the DID approach.
Empirically, Castillo et al. (Citation2017) applied the synthetic control method and found that tourism development policies have a positive effect on inter-industry employment externalities in the Argentinean province of Salta. Karaman and Karaman (Citation2017) applied the synthetic control method and concluded that inflation targeting policy improves economic growth for developing countries. Almer and Winkler (Citation2017) applied the synthetic control method and revealed that emission targets policy on reducing CO2 has little reduction effect on the major emitters. However, most of the existing literature is restricted to the synthetic control method with single treated units, i.e. only one object is implementing the concerned policy while others are not (Zhang et al., Citation2016).
Considering large numbers of policies are implemented for multiple regions, it is urgently necessary to extend the synthetic control method for multiple treated units. There are limited works aimed to provide solid evidence in policy evaluation for multiple treated units. Dube and Zipperer (Citation2015) proposed a distribution-free method for pooling synthetic control case studies using the mean percentile rank. Kreif et al. (Citation2016) extended the application of synthetic control methods to multiple treated group individuals to study the impact of pay-for-performance schemes on risk-adjusted hospital mortality. However, the multiple treated group individuals in the framework of Kreif et al. (Citation2016) are subjected to the same policy, while during the G20 Hangzhou Summit period, various surrounding cities other than Hangzhou implemented differentiation environmental regulation policy. How to extend the synthetic control methods with multiple treated units, especially the multiple treated units that are subjected to differentiation policies, is of crucial importance for the development in the area of policy effect evaluation.
In this sense, the paper firstly extends the synthetic control method with multiple treated units theoretically, in which the units are subjected to various policies. Furthermore, the paper applies the extended synthetic control method for multiple treated units to evaluate the short-term and long-term policy effect of environmental measures at the G20 Hangzhou Summit. The paper takes the series of environmental protection measures implemented at the G20 Hangzhou Summit as a natural experiment, and selects 70 air quality monitored key cities as the study sample. The nine multiple key cities in Zhejiang Province subjected to G20 Hangzhou Summit policy are taken as treatment units and the remaining 61 key cities are included as control units. Technically, the study constructs reasonable weights according to the fluctuation of urban air quality, i.e. the fluctuation of control variables. The weight establishment ensures the sensitive cities to abnormal external factors have smaller weights to avoid the negative effects of objective factors (such as heavy rainfall, typhoons, sandstorms and other natural disasters). It guarantees the estimation accuracy and robustness of the policy effects.
The remainder of the research is organized as follows. Section 2 firstly provides the extended synthetic control method for multiple treated units; it also gives an illustration of research data. Section 3 measures the policy effect of the comprehensive environmental protection measures for multiple treated cities at the G20 Hangzhou Summit in Zhejiang Province. Section 4 finally draws the conclusions and presents some policy suggestions.
2. Extended synthetic control method and data
2.1. Extended synthetic control method with multiple treatment units
Abadie et al. (Citation2010) provides a general investigation framework of synthetic control method. Among all investigated units (regions), if the first unit is exposed to the environmental regulation policy, it is taken as the treated region; while the other remaining J regions unexposed to the policy are referred as the ‘donor pool’ (control regions). This study collects the sample data during the period between Jan 2014 and Jun 2017, with a total of
periods. The environmental policy is implemented at period
is the observation of the air quality composite index (SYI) vector for each region.
is the observation without environmental policy intervention. With the introduction of a dummy variable of regulation policy, the real observation satisfies the following equation:
(1)
(1)
(2)
(2)
where
is the time fixed effect;
(
is the number of predictive variables) represents the vector that measures the predictive variable at a fixed time;
is an unknown parameter vector that changes with time;
represents a vector that measures non-observable predictive variables at a fixed time;
is the coefficient vector of
varying with time;
is a dummy variable of regulation policy, equal to 1 for the treated unit after
and 0 otherwise;
represents a random disturbance term with E(
)=0.
Prior to the policy intervention, observations without the impact of policy corresponded to outcome variables for the treated
and control cities. For periods after
the treatment-free counterfactual for the treated city is not observed. In order to estimate the treatment effect for the post-intervention period, the synthetic control method estimates the unobserved
by creating a ‘synthetic control unit’, which is the weighted combination of the comparison groups closest to the characteristics of the intervention target before intervention. The vector set for this weighting is:
(3)
(3)
According to Abadie et al. (Citation2010), the weight matrix satisfies:
(4)
(4)
The weight in EquationEq. (4)(4)
(4) follows the idea of Abadie and Gardeazabal (Citation2003), which selects the
and
through minimising the root mean square error (RMSPE). The counterfactual observation of the treated city can be linearly represented by control regions through the optimal weight in EquationEq. (5)
(5)
(5) .
(5)
(5)
The average treatment effect of the environmental regulation policy on single treated units during period of to the interested period
is given by:
(6)
(6)
The similarity of the time trend of non-observable variables between the treated city and the control cities is the precondition of the accurate measurement for intervention regulation. More generally, if the weight vector satisfies the relationship in EquationEq. (7)(7)
(7) :
(7)
(7)
The response variable is a linear function of observed and unobserved interference factors. Therefore, is the approximate unbiased estimation of
Local governments in both Zhejiang Province and Yangtze River Delta region implemented various environmental regulation measures for multiple cities to ensure the smooth opening of the G20 Hangzhou Summit in 2016. The study firstly constructs the targeted cities as the multiple treated units by weighted treatment. Specifically, the indexes of the new target cities are constructed by weighted average of the explained variables and the forecast variables of the selected treatment groups. Specifically, suppose are treated cities under the intervention of environmental policy. The remaining
cities are the control cities without policy intervention. The total number of collected sample cities is
Following the idea of Kreif et al. (Citation2016), the observational sets of the constructed treatment cities under policy intervention can be expressed in EquationEq.(8)
(8)
(8) as follows:
(8)
(8)
where
(9)
(9)
is a dummy variable of regulation policy;
is the average treatment effects under policy interventions.
measures the weights of individuals in different cities. The counterfactual proxy estimate for the treated region can be obtained by synthetic control in EquationEq. (10)
(10)
(10) as follows:
(10)
(10)
is the optimal weight .
Kreif et al. (Citation2016) studied the impact of pay-for-performance schemes on risk-adjusted hospital mortality. Multiple hospitals are subjected to the same pay-for-performance scheme. indicates the number of patient samples in each hospital per unit period of the treatment group (hospital with policy intervention). The higher the number, the more representative the sample is, and a higher weight the hospital has when constructing a single treated unit.
In our study, the reported Air Quality Index (AQI) is a synthetic value of various pollutants. AQI is subjected to short-term volatility of both weather conditions and the concentration of various pollutants. The urban samples with less abnormal air quality fluctuations are more representative. The reciprocal coefficient of variation of the daily air quality index (AQI) in each city is taken as the weight. The weight ensures that the cities with larger random fluctuation of AQI in each month have smaller weights and the smaller fluctuation cities have larger weights. In this case, the estimate can eliminate the disturbance of abnormal factors to some extent and ensure the model results are more robust. Specifically,
(11)
(11)
where
is the average AQI in month
of city
is the AQI standard deviation of the city in month
The ‘placebo test’ method is proposed in Abadie et al. (Citation2010), sharing the same idea of the permutation test (Edgington & Onghena, Citation2007). The test synthesises the changes of multiple treated units into a weighted average treatment effect Similarly, the same number of treatment cities are repeatedly selected from controls as treated regions, and remaining controls cities are taken as new controls. By applying the synthetic control method estimation in EquationEquations (8)
(8)
(8) and Equation(10)
(10)
(10) , the study estimate the average treatment effect for the treatment cities. The study will further repeat the estimation of the extended synthetic control method for multiple treated units to obtain sufficient placebo effect under independent resamples. The statistical significance of the estimates is verified by comparing the distribution of treatment effects between the target and placebo test.
2.2. Data illustration
There have been 74 monitored cities in total in accordance with the ‘Environmental air quality standards’ (GB3095-2012) since 201301. The cities are distributed at Beijing-Tianjin-Hebei region, Yangtze River Delta, Pearl River Delta and other major regions like provincial capitals. Our study selects 70 cities as the final sample cities since the data in Handan, Taizhou, Shaoxing and Wenzhou city are partially missing. Since the G20 Summit was held in Hangzhou, the regulation strength in the nine cities in Zhejiang is stronger than the that in other monitored major cities. The study takes the nine cities in Zhejiang Province under the intervention of the G20 Atmospheric Plan as the treatment units and the remaining 61 cities as control units.
Concerning the time point of regulation, it is known that the ‘Atmospheric Plan’ of G20 Hangzhou Summit and other regulation measures came into effect in April 2016 for cities in Zhejiang Province and major cities in the Yangtze River Delta region, respectively. With reference of the study of Mao and Hu (Citation2017), our study takes 201605 as the boundary time point to measure the policy effect. The study considers the whole sample period during 201401–201706 for investigation because it contains the pre-event stage, in-session stage, and after-event stage of the environmental regulation of the G20 Hangzhou Summit.
The study takes monthly air quality composite index (SYI) as the explained variable of air quality. The index, also known as the ambient air quality composite index, is a dimensionless index that describes the comprehensive situation of urban ambient air quality. According to the pilot ‘Environmental Air quality Index (AQI) Technical regulations’ (HJ633–2012), the air quality composite index is the weighted value of the six pollutants SO2, NO2, PM10, PM2.5, CO, and O3. The larger the air quality composite index value, the more serious is the air pollution. The study collects monthly air quality composite indices and average concentration of six pollutants SO2, NO2, PM10, PM2.5, CO, and O3 of the 70 key cities during the period between Jan 2014 and Jun 2017 from the website of the Ministry of Environmental Protection.
Air quality is also subjected to several control variables. The study collects the monthly mean temperature, rainfall and average wind speed for 70 cities during the period between Jan 2014 and Jun 2017 from the website of China Meteorological Administration for investigation. Economic development and growth style also exert significant impacts on air quality (Zeng et al., Citation2019), the study collects several indicators that reflects environmental purification capacity, industrial pollution, and vehicle pollution for analysis. Specifically, the study collects the annual values of green area per capita, gross industrial output, industrial sulfur dioxide emissions, emissions of industrial smoke dust, total carbon monoxide emissions from motor vehicles, passenger traffic, passenger free craft freight traffic of 70 cities during period between 2014 and 2016 from the China City Statistical Yearbook and the China Statistical Yearbook. To overcome the issues of heteroscedasticity, the study takes the logarithm value of the macroeconomic indicators for analysis. provides the descriptive statistics of collected indicators, which illuminates a general sketch of our indicators.
Table 1. Descriptive statistics of collected indicators for 70 cities.
3. Empirical results
This paper applies the extended synthetic control method for multiple units to measure the policy effect of the G20 Atmospheric Plan with STATA and R software. Before introducing the synthetic control method, the average air quality composite indices in treatment cities and control cities are provided in .
Figure 1. Air quality composite index average trend chart for treatment and control cities. Source: The Figure is created by authors.
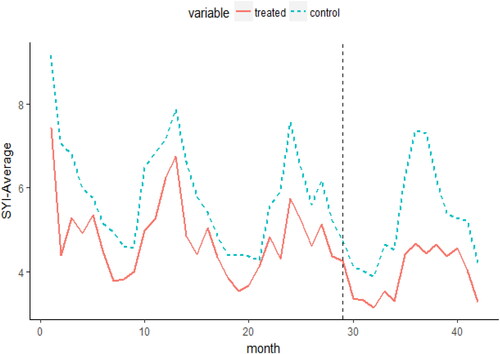
Overall, the average levels of air quality index (SYI) for treatment cities are lower than the average levels for control cities. There was a discrepancy of average SYI fluctuation trend between treatment cities and control cities during the period between Jan 2014 and Jun 2017. The result provides a preliminary result that the G20 Atmospheric Regulation Plan has an effect on air quality improvement for treated cities.
Our study provides an extended synthetic control method with multiple units to evaluate the policy effect of environmental measures on air quality improvement at the G20 Hangzhou Summit. The SYI of the treatment cities and the SYI for control cities do present a cyclical development trend along with time. By including meteorological variables (wind speed, temperature, rainfall) and economic variables (logarithm of green area per capita, logarithm of industrial added value, etc.) as vital control variables, the study goes with the further estimate to measure how much of this improvement in air quality is due to the environmental regulation at the G20 Hangzhou Summit.
3.1. Short-term policy effects evaluation
First, the study conducts the policy effect evaluation during the period between Jul 2016 and Feb 2017. To include the pre-intervention period, the study focuses on the study period between Jan 2014 and Feb 2017 for analysis. It takes Hangzhou city as the single treated unit and the remaining 61 cities of Zhejiang Province as the control cities to conduct the synthetic control estimation for single-treated units. With the synthetic control method for single units of Hangzhou city, the SYI observation of Hangzhou city is lower than the synthetic SYI of Hangzhou, with average treatment effect -0.52 during the period 201607–201702 (32nd to 38th month). The changing trend of SYI observation and synthetic SYI is almost the same during period between Jan 2014 and Aug 2016, and period between Feb 2017 and Jun 2017. The root mean squared prediction error (RMSPE) of single-treated Hangzhou is 0.22.
Second, taking nine cities in Zhejiang Province as the multiple treated unit and 61 cities out of Zhejiang Province as the control cities, the study applies the extended synthetic control method for multiple-treated units to measure the treatment effect. The deviations of treated cities and synthetic cities are randomly fluctuating near to zero, and the root mean squared prediction error (RMSPE) of multiple-treated cities is 0.17. The SYI observation of treated cities is lower than the synthetic SYI of multiple treated cities. The monthly average treatment effect of the treated cities during 201607–201702 (32nd to 38th month) on Zhejiang Province is -0.27 (), which is lower than the policy effect of Hangzhou city, the host city of the G20 Hangzhou Summit. Similarly, the G20 Atmospheric Regulation Plan had no significant impact on treatment cities since 201702.
Figure 2. Trends of SYI in treatment cities and synthetic cities (Initial sample). Source: The Figure is created by authors.
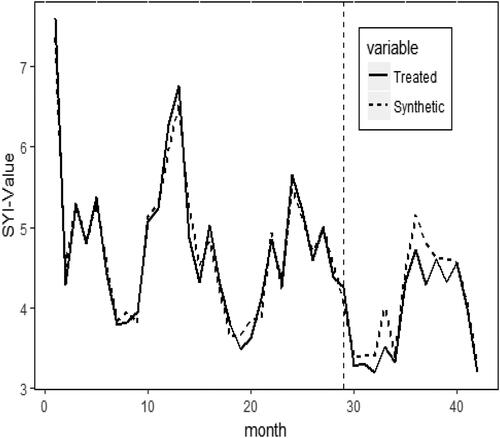
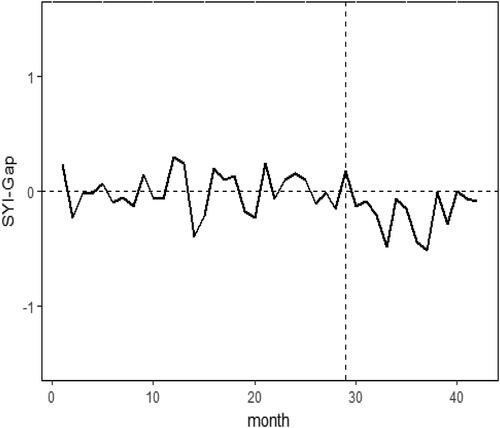
Figure 3. Average SYI difference of the treated and synthetic cities. Source: The Figure is created by authors.
provides the comparison of city weights, RMSPE, and P values between the treatment method with single treated unit and the treatment method with multiple treated units. The figures in illustrate the synthetic control method with multiple units has a smaller pre-intervention prediction bias because the RMSPE of synthetic control method with multiple units (0.17) is less than the level with single unit (0.22). In addition, the regulation has a certain influence on the whole region of Zhejiang province. The monthly average treatment effect during 201607–201702 (32nd to 38th month) is -0.27 with P value 0.06, which is lower than the effect on Hangzhou.
Table 2. Results of synthetic control method with single treated unit and multiple treated units.
To provide the validity of the estimate, the study gives the placebo test as follows. First, the study randomly selects nine cities as treatment groups from 61 control cities, and takes the remainder as new control groups. Second, the study applies the synthetic control method with multiple units to estimate. Our study conducts the procedure 100 times. The study excludes the test group whose RMSPE or extreme prediction bias exceeds the RMSPE of treatment group by more than five times (Abadie et al., Citation2010). The treatment effect of the target experiment and the remaining 99 tests are presented in . According to the distribution of the monthly average treatment effect of 99 experimental groups during period between Jul 2016 and Feb 2017 in , there are five tests in which the average treatment effect reached the level of the target experiment; that is to say, the probability of occurrence of small probability events is 6%. At the significant level of 10%, our research holds that the environmental regulation policy of the G20 Hangzhou Summit has affected the air quality of the cities in Zhejiang province during the short period between Jul 2016 and Feb 2017.
Figure 4. Treatment effect of target experiment and 99 permutation tests. Source: The Figure is created by authors.
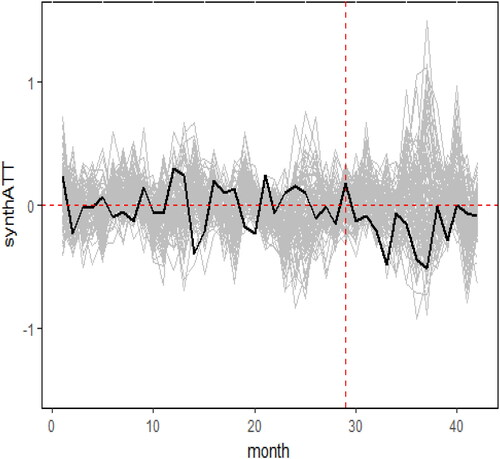
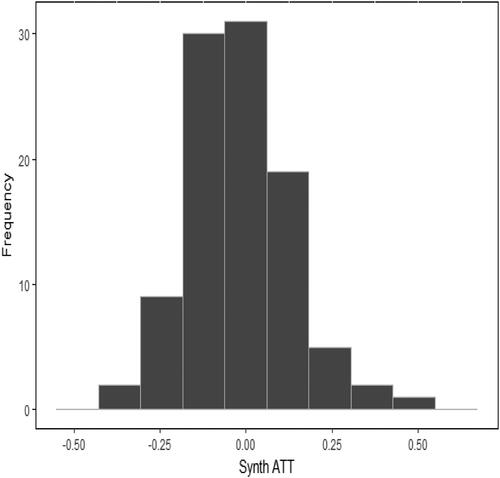
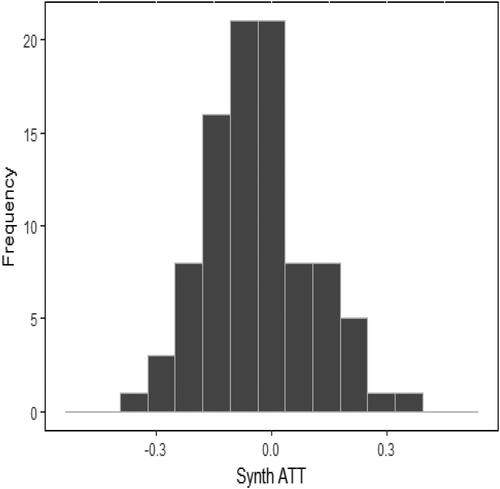
Figure 5. The histogram of average treatment effects of 99 experimental groups. Source: The Figure is created by authors.
3.2. Long-term policy effects evaluation
Considering the listed issues, the study considers improving the experimental scheme with an adjustment of the experimental data. First, according to the initial measurement results and corresponding related regulation measures during the G20 Hangzhou Summit, the study excludes 16 cities in Shanghai, Jiangsu, Anhui, Jiangxi and Fujian from the initial experimental sample. This step aims to reduce the bias due to the certain convergence of the policy between control regions and the treatment regions. However, because the sampled cities excluded are geographically close to the treatment regions, this may also bring about some pre-intervention prediction errors. Therefore, the study selects the sample period of pre-intervention model fitting based on the principle of minimising RMSPE. Finally, the period between Jan 2015 and Jun 2017 is selected for a total of 30 months as a complete research cycle, and it is a relatively long-term period since 201706 is almost one year after the implementation of the regulation policy in 201604. The synthetic control method with multiple treated units in Zhejiang Province is carried out based on the data during 201501–201706. The RMSPE drops to 0.18, and the prediction results become more persuasive and robust.
shows prediction indicators of treated cities and synthetic cities before 201605. We find that the average SYI for fitting estimation well before 201605, and the monthly mean value of the prediction error did not exceed 0.05 during the first half of 2015, the second half of 2015 and the first four months of 2016.
Table 3. Comparison of predictive variables.
Among the predictive variables, there are some differences in rainfall between the treated cities and the synthetic cities. The average monthly rainfall of the synthetic cities is half of the average rainfall in the cities of treated regions. The possible reason is that, after removing the cities neighbouring of Zhejiang Province in the sample pool, the remaining sample cities are mostly in the Midwest and North. In view of the fact that rainfall is one of the key factors for purifying air (especially for suspended particulate matter), this also explains that the monthly average PM10 for the treated regions is lower than the level of synthetic area (8.95 ug/m3) to some extent. In addition, other predictors have a fairly good fit.
and provide the SYI trends of the treated cities and the control cities, and the evolution path of the difference during period between Jan 2015 and Jun 2017, respectively. Compared with the result during the initial sample period between Jan 2014 and Feb 2017, the measured policy effects of environmental measures at the G20 Hangzhou Summit for the adjusted experimental sample period are more significant and robust.
Figure 6. Average SYI trends of the treated cities and synthetic cities (improved sample). Source: The Figure is created by authors.
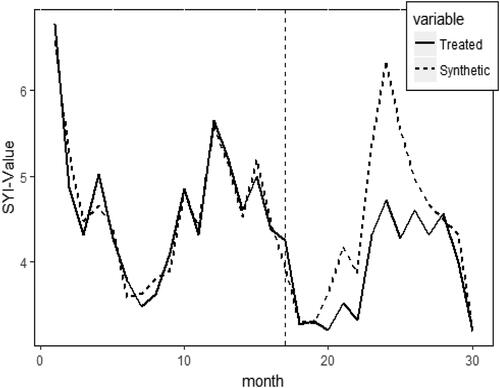
Figure 7. Average SYI difference of the treated and synthetic cities. Source: The Figure is created by authors.
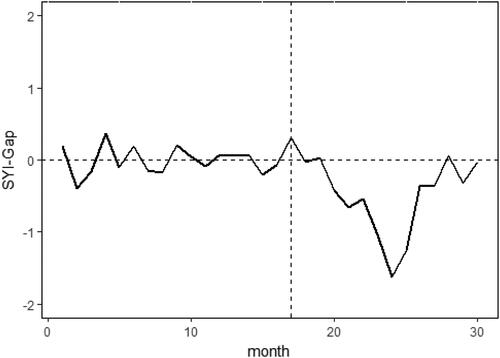
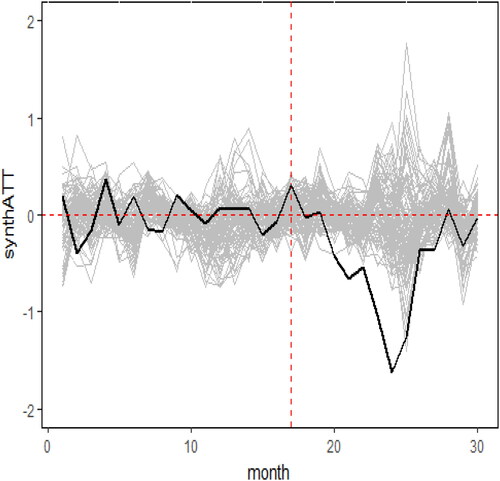
In order to further test the statistical significance of the model results, 100 trials were performed using the idea of permutation test. Seven test groups were excluded. The treatment effect evolution path for the target experiment and the remaining 93 groups are presented in . The treatment effect of the target experiment after intervention locates lower than all the 93 test groups. That is, after adjusting our data structure, there is no region in the test groups achieving air quality improvement effect in Zhejiang Province. The average policy effect of the G20 Atmospheric Regulation Plan on the whole Zhejiang Province is -0.84 during the period between Aug 2016 and Feb 2017. The result provides evidence that the G20 Atmospheric Regulation Plan does not have a significant treatment effect until 201608, and the improvement effect of the Regulation Plan begins to fade after 201702.
Figure 8. Treatment effect of target test and 93 permutation tests. Source: The Figure is created by authors.
The distribution of the monthly average treatment effect during the period between Jul 2016 and Feb 2017 (20th to 26th month) is between -0.4 and 0.4. The policy treatment effect on treated regions given by the synthetic control method with multiple treated regions belonging to accidental event with the value of 1/94. shows that the P value of the test is 0.0106, less than half of the P value (0.06) in the initial experimental period. There is no reason to reject the assumption that the G20 Atmospheric Regulation Plan has affected the air quality of the cities in Zhejiang Province during the period between Jul 2016 and Feb 2017 at the significant level of 5%. There is a difference but similar trends between average SYI in treated cities and average SYI in synthetic cities in June 2016, i.e. 201609. The fact validates that due to social environmental factors, the air quality of a wider area is partially affected by the G20 Hangzhou Summit.
Figure 9. The histogram of average treatment effects of 93 experimental groups. Source: The Figure is created by authors.
4. Conclusion and policy implications
4.1. Conclusions
Taking the environmental regulation measures of the G20 Hangzhou Summit in Zhejiang Province as a natural experiment, this paper innovatively provides an extended synthetic control method with multiple units to evaluate the policy effect of environmental measures at the Summit. Technically, the study constructs data-driven weights according to the fluctuation of urban air quality, ensuring that cities which are vulnerable to abnormal external factors have smaller weights to avoid the negative effects of objective factors on the accuracy of model estimation results and to obtain the estimation of average treatment effect with stronger robustness. The ideas in this study can be extended to other policy evaluations covering multiple objectives.
First, the study takes nine cities under policy intervention in Zhejiang Province as treatment cities, and 61 key cities without policy intervention in other provinces as control cities during the period between Jan 2014 and Feb 2017. The results of the synthetic control method with multiple treated units based on reasonable weighting has smaller RMSPE than the synthetic control method with single treated unit, and the estimation result is more stable.
Second, the study improves the experimental scheme of pre-intervention model fitting based on the principle of minimising RMSPE. The improved scheme takes nine cities under policy intervention in Zhejiang Province as treatment cities, and 45 key cities without policy intervention in other provinces as control cities during the period between Jan 2015 and Jun 2017. The prediction results become more persuasive since RMSPE dropped to 0.18. Permutation test is included to test the statistical significance of the model results. The policy treatment effect on treated regions given by the synthetic control method with multiple treated regions belonging to accidental event is 1/94, which is significant at 5%.
Third, the treatment effect of short-term environmental regulations on the monthly average air quality composite index SYI of cities in Zhejiang Province is -0.84 at 5% significant level during the period between Aug 2016 and Feb 2017. This shows that the G20 Atmospheric Regulation Plan improves air quality in Zhejiang Province during the short-term period between Aug 2016 and Feb 2017., while the G20 Atmospheric Regulation Plan does not have a significant treatment effect in period between Jan 2015 and Aug 2016, and period between Feb 2017 and Jun 2017. This result provides evidence that the G20 Atmospheric Regulation Plan has no long-term treatment effect on air quality improvement in Zhejiang Province. Some of the regulation measures stop instantly after the close of the G20 Hangzhou Summit in September 2016. In this sense, some of the measures only take effect for four months; the time interval of the regulation policy is relatively short.
4.2. Policy implications
First, our study discusses the policy effect of environmental regulation on average monthly air quality composite index. The results also present the estimation results with the multiple synthetic control method and results with simple synthetic control method to validate our theory. The method of this paper has important value in theory and application. The method adopted is novel and innovative, and able to explain the results of different theories.
Second, concerning the regulation effect of the G20 Atmospheric Plan, the short-term policy effects are stronger than the long-term policy effects in terms of air quality improvement in Zhejiang. To guarantee sustainable air quality improvement, the government should extend some of the short-term regulations to become long term. More attention should be paid to these aspects in long-term governance. Measures taken in short-term environmental policies are often the most effective methods of environmental governance. In this sense, the governments and institutions should further extend the core effective measures of short-term governance to long-term environmental regulation policies from the perspective of environmental sustainability, and gradually slow down or even offset the curve of deterioration of air quality to achieve long-term governance.
According to the air quality improvement for Hangzhou city, both the short-term and long-term policy effects of the plan were stronger in Hangzhou than in other prefecture-level cities. The successful experience of the environmental regulations brought in for the G20 Summit in Hangzhou can be used as a reference for other major cities. Thus, stringent policies restricting industrial exhaust gas, coal-fired flue gas, vehicle and ship exhaust gas, other exhaust gas, and dust and ash gas, together with policies to close heavily polluting factories in Hangzhou city, could be extended to other cities to improve air quality in other cities in Zhejiang province.
Disclosure statement
No potential conflict of interest was reported by the author(s).
Additional information
Funding
References
- Abadie, A., & Gardeazabal, J. (2003). The economic costs of conflict: A case study of the Basque Country. American Economic Review, 93(1), 113–132. https://doi.org/https://doi.org/10.1257/000282803321455188
- Abadie, A., Diamond, A., & Hainmueller, J. (2010). Synthetic control methods for comparative case studies: Estimating the effect of California’s Tobacco Control Program. Journal of the American Statistical Association, 105(490), 493–505. https://doi.org/https://doi.org/10.1198/jasa.2009.ap08746
- Almer, C., & Winkler, R. (2017). Analyzing the effectiveness of international environmental policies: The case of the Kyoto Protocol. Journal of Environmental Economics and Management, 82, 125–151. https://doi.org/https://doi.org/10.1016/j.jeem.2016.11.003
- Castillo, V., Figal Garone, L., Maffioli, A., & Salazar, L. (2017). The causal effects of regional industrial policies on employment: A synthetic control approach. Regional Science and Urban Economics, 67, 25–41. https://doi.org/https://doi.org/10.1016/j.regsciurbeco.2017.08.003
- Chang, Y., Huang, R., & Masanet, E. (2014). The energy, water, and air pollution implications of tapping China’s shale gas reserves. Resources, Conservation and Recycling, 91(9), 100–108. https://doi.org/https://doi.org/10.1016/j.resconrec.2014.07.015
- Chen, Y., Jin, G. Z., Kumar, N., & Shi, G. (2013). The promise of Beijing: Evaluating the impact of the 2008 Olympic Games on air quality. Journal of Environmental Economics and Management, 66(3), 424–443. https://doi.org/https://doi.org/10.1016/j.jeem.2013.06.005
- Davis, L. W. (2008). The effect of driving restrictions on air quality in Mexico City. Journal of Political Economy, 116(1), 38–81. https://doi.org/https://doi.org/10.1086/529398
- Dube, A., & Zipperer, B. (2015). Pooling Multiple Case Studies Using Synthetic Controls: An Application to Minimum Wage Policies. IZA Discussion Paper No. 8944. https://ssrn.com/abstract=2589786.
- Edgington, E., & Onghena, P. (2007). Randomization tests (statistics: a series of textbooks and monographs). 4th edn. Chapman & Hall/CRC.
- Gagliardi, L., & Percoco, M. (2017). The impact of European cohesion policy in Urban and Rural Regions. Regional Studies, 51(6), 857–868. https://doi.org/https://doi.org/10.1080/00343404.2016.1179384
- Henderson, J. V. (1996). Effects of air quality regulation. American Economic Review, 86(4), 789–813.
- Kathuria, V. (2002). Vehicular pollution control in Delhi: need for integrated approach. Economic and Political Weekly, 37(12), 1147–1155.
- Karaman, K., & Karaman, Y. S. (2017). The monetary policy change in Turkey in 2009 and its implications for inflation and growth. Bogazici Journal, 31(1), 1–21. https://doi.org/https://doi.org/10.21773/boun.31.1.1
- Kreif, N., Grieve, R., Hangartner, D., Turner, A. J., Nikolova, S., & Sutton, M. (2016). Examination of the synthetic control method for evaluating health policies with multiple treated units. Health Economics, 25(12), 1514–1528. https://doi.org/https://doi.org/10.1002/hec.3258
- Lu, H., Yue, A., Chen, H., & Long, R. (2018). Could smog pollution lead to the migration of local skilled workers? Evidence from the Jing-Jin-Ji Region in China. Resources, Conservation and Recycling, 130(3), 177–187. https://doi.org/https://doi.org/10.1016/j.resconrec.2017.11.024
- Mao, M. J., & Hu, D. Y. (2017). Evaluation of the air pollution control over Zhejiang Province during the G20 Summit in Hangzhou. Research of Environmental Sciences, 30(12), 1822–1831.
- Nykiforuk, C. I. J., McGetrick, J. A., Raine, K. D., & Wild, T. C. (2019). Advocacy coalition impacts on healthy public policy-oriented learning in Alberta, Canada (2009–2016): A difference-in-differences analysis. Social Science & Medicine, 220, 31–40. https://doi.org/https://doi.org/10.1016/j.socscimed.2018.10.017
- Pellegrini, G., Terribile, F., Tarola, O., Muccigrosso, T., & Busillo, F. (2013). Measuring the effects of European Regional Policy on economic growth: A regression discontinuity approach. Papers in Regional Science, 92(1), 217–233. https://doi.org/https://doi.org/10.1111/j.1435-5957.2012.00459.x
- Qi, W. (2014). Air quality policy assessment under functional data perspective: An analysis of odd-even day traffic restriction scheme in Lanzhou city. Statistics & Information Forum, 29(09), 79–85.
- Qin, X. Z., Zhuang, C. C., & Yang, R. (2017). Does the one-child policy improve children’s human capital in Urban China? A regression discontinuity design. Journal of Comparative Economics, 45(2), 287–303. https://doi.org/https://doi.org/10.1016/j.jce.2016.09.001
- Qiu, Z. X., & Liu, S. (2013). Effect of motor vehicle restriction on air pollution index in Beijing. Review of Economic Research, 2013(11), 70–73 + 76.
- Stevens, K. A. (2018). Natural gas combined cycle utilization: An empirical analysis of the impact of environmental policies and prices. The Energy Journal, 39(01), 205–229. https://doi.org/https://doi.org/10.5547/01956574.39.5.kste
- Sun, D., Fang, J., & Sun, J. (2018). Health-related benefits of air quality improvement from coal control in China: Evidence from the Jing-Jin-Ji region. Resources, Conservation and Recycling, 129(2), 416–423. https://doi.org/https://doi.org/10.1016/j.resconrec.2016.09.021
- Sun, K. X. (2017). Study on effect of haze treatment on vehicle emission standard-analysis based on regression discontinuity design. Soft Science, 31(11), 93–97.
- Thistlethwaite, D. L., & Campbell, D. T. (1960). Regression-discontinuity analysis: an alternative to the ex post facto experiment. Journal of Educational Psychology, 51(6), 309–317. https://doi.org/https://doi.org/10.1037/h0044319
- Xi, P. H., & Liang, R. B. (2015). Can air pollution influence the local environmental protection expenditure-based on the multiple-cutoffs regression discontinuity design. Statistical Research, 32(9), 76–83.
- Yang, Z. B., Fan, M. T., Shao, S., & Yang, L. L. (2017). Does carbon intensity constraint policy improve industrial green production performance in China? A quasi-DID analysis. Energy Economics, 68, 271–282. https://doi.org/https://doi.org/10.1016/j.eneco.2017.10.009
- Zeng, B., Wu, T., & Guo, X. (2019). Interprovincial trade, economic development and the impact on air quality in China. Resources, Conservation and Recycling, 142(3), 204–214. https://doi.org/https://doi.org/10.1016/j.resconrec.2018.12.002
- Zhang, C., Chen, J., & Wen, Z. (2012). Alternative policy assessment for water pollution control in China’s pulp and paper industry. Resources, Conservation and Recycling, 66(9), 15–26. https://doi.org/https://doi.org/10.1016/j.resconrec.2012.06.004
- Zhang, J., Zhong, C., & Yi, M. (2016). Did environmental regulation improve air quality in Beijing?—based on the synthetic control method. Collected Essays on Finance and Economics, 18(06), 104–112.