
 ?Mathematical formulae have been encoded as MathML and are displayed in this HTML version using MathJax in order to improve their display. Uncheck the box to turn MathJax off. This feature requires Javascript. Click on a formula to zoom.
Abstract
While the influential role of Economic Policy Uncertainty (EPU) on economic activity and financial markets is well-documented, little is known about how to forecast EPU, especially in the framework of an emerging market economy (EME). We forecast the newly developed EPU index of China based on financial uncertainty (measured by a realised volatility) of the selected East Asian Economies (EAEs) including ASEAN5 and Hong Kong, having close trade linkages with China, by using LR and DT methods. After controlling for macroeconomic variables, it is evident that the realised volatility of regional EAEs significantly forecasts the EPU of China, except for Thailand. Moreover, comparing the performance of both models based on the accuracy classification score test, LR performs better than DT. Policymakers, who aim to keep and maintain a low level of EPU to achieve effective investment policies and avoid reduced consumer spending, should take into account the findings of this study.
1. Introduction
High uncertainty in economic policy increases the financing cost, and in the case of irreversible investment, leads to reduced investment (Bernanke, Citation1983), unemployment and economic contraction (Bloom et al., Citation2007). Consistent with this, policymakers, who aim to keep a low level of EPU, should take proper measures to reduce EPU to foster a productive investment environment in the economy. Ever since the Global Financial Crisis (GFC) of 2008–2009, an intensive discussion about the profound effect of Economic Policy Uncertainty (henceforth, EPU) on economic conditions has re-emerged. Uncertainty is often considered as one of the fundamental components that affect economic activity adversely and hinder the economic progress of any economy (Scheffel, Citation2016). The impacts of EPU on economic activity are generally transmitted by consumption decisions of households/consumers and deferment in hiring plans or through delays in capital expenditure or investment by firms (Visco, Citation2017). Since EPU is negatively associated with investment and capital expenditure of firms (Sum, Citation2013), and when consumers (investors) perceive a higher level of uncertainty in economic policy, as a precautionary measure, they tend to postpone their spending (investments). Similarly, given the irreversibility of investment projects (Pindyck, Citation1990), firms also postpone capital expenditure, when EPU is high. This process reduces productivity and leads to unemployment (Bloom, Citation2009).
Even though the role of EPU is well-documented in economic growth and financial markets,Footnote1 little is known about how to forecast EPU. So far, research related to forecasting EPU is limited. The study of Wang et al. (Citation2015) was the first that investigated the role of 23 commodity prices in forecasting EPU of the U.S. economy. More recently, the study of Degiannakis and Filis (Citation2019) forecast European EPU based on Global EPU and asset market volatilities of Europe and the U.S. stock markets. In contrast, the prevailing research has mainly focused on investigating the predictive content of EPU, such as volatility forecasting (Liu & Zhang, Citation2015), or economic recessions (Karnizova & Li, Citation2014).
Against this backdrop, our study aims to investigate the reverse channel, which is to examine whether stock market volatilities can help in forecasting EPU. For this purpose, we choose to forecast Chinese EPU based on asset market volatilities of its neighbouring major trade partners (ASEAN5) and AH premium of Hong Kong, during the sample period of March 2011 to June 2018, by employing Logistic Regression (LR). The study also employed Decision Tree (DT) model for comparison purposes.
Our study tries to inspect the predictive role of asset price volatilities originating from the six selected major Asian stock marketsFootnote2 on the EPU of China. According to our knowledge, our paper is the first attempt that explores the volatilities spillovers originating from Southeast Asian Economies on the prediction of outstanding points (outliers) in Chinese EPU. Because of advanced technologies, pervasive media and frequent communications, the disturbances in any economy can be significantly spread to other economies around the world (Wu et al., Citation2016). It is clearly evident from the 2008–2009 financial crisis that the world’s economies tend to be more linked in terms of trade and financial integration than they were before, thus it can be anticipated that instabilities in economic and financial systems of one economy can be transmitted (directly or indirectly) to other economies.
The economies of ASEAN5 are located in the same region as China and are closely related by trade policies. They are the top trade partners of China (Soong, Citation2016).The economy of China is greatly dependent on the economic events that are occurring in Asian economies (Morck & Yeung, Citation2016). Meanwhile, other Asian economies also rely on China, and given this closer linkage and dependency on each other, this will lead to affecting the economies of each other (Das, Citation2014). The intra-regional contagion effect between Asian economies also causes fluctuations in the stock markets of these countries (Masih & Masih, Citation1999), which further strengthens the level of interdependency among their stock markets. The increased interaction is the outcome of the increased liberalisation of stock markets and macroeconomic policy conditions (Masih & Masih, Citation1999). Similarly, investment patterns and trade links display the increased economic integration between Asian economies (Chien et al., Citation2015).
ASEAN stock markets are fast-growing and emerging, and according to the report of the Asian Development Bank (ADB) in 2009,Footnote3 due to enhancements in their fundamentals, such as improvements in economic and financial services, they have improved the performance of their equity markets, which has attracted foreign portfolio investment in these economies. However, these developments and enhancements do not bring about the improvement of the stability of these markets and the volatility in these markets is still high due to certain global and internal factors in each country. Hence, considering the trade linkages with China, it is to be expected that any fluctuations in these stock markets will have a significant effect on the economy of China, especially on its economic policy uncertainty (EPU),Footnote4 as trade openness among countries plays a significant role in transmitting volatilities (Nikmanesh, Citation2016). In an emerging economy like China, where stock markets are less developed as compared to the developed economies, the shockwaves of financial uncertainty (a proxy for stock market volatility) transmission could be stronger (Carrière-Swallow & Céspedes, Citation2013), and given the influences of financial uncertainty on economic activity (Popp & Zhang, Citation2016), we expect that financial uncertainty (volatility) of the selected Asian economies could be a significant factor to predict Chinese EPU.
Our study has contributed to the current research on the forecasting and prediction of EPU and aims to answer two questions: Can the outliers in Chinese EPU be explained with the help of asset volatilities in ASENA5 and Hong Kong stock markets?, and Can we analyse and predict the outliers in Chinese EPU by using LR and DM approaches; if so, which one is better? The findings of our study show that stock market volatilities of all countries (except for Thailand) significantly forecast Chinese EPU based on the LR method. The findings of our study are similar to the findings of Degiannakis and Filis (Citation2019), who also documented the predictive role of volatilities from Europe and the U.S. on European EPU. Among the other control variables, the trade balance and the exchange rate were also one of the significant variables that explain the outliers of EPU. The results of the DT model also reveal that asset market volatilities of ASEAN5 and Hong Kong offer significant predictive gains for Chinese EPU. However, the overall performance of the LR model in this specific case is better than that of DT analysis based on the accuracy prediction score test. Consequently, the LR model with the realised volatilities of regional stock markets and other control variables is the acceptable framework to encapsulate accurately the future directions of Chinese EPU (outliers).
The remainder of the paper is structured as follows: section two reviews the relevant studies; Section three describes the data and discusses the methodology used in the paper; Section four explains the results. The conclusion and policy recommendations are discussed in section five.
2. Relevant research
Stock market performance reflects the overall economic condition of the economy; its uncertainty can be denoted by volatility, which is usually computed by standard deviation or by the variance between the returns of the same security or the stock market (Tsay, Citation2014), and it is expected that stock volatility will affect adversely the smooth operative systems of the economy (Mala & Reddy, Citation2007). Compared to advanced economies, in EMEs the relevant influence of stock volatility (a proxy of uncertainty shocks) is larger on economic activities (Carrière-Swallow & Céspedes, Citation2013). The focus of this study is therefore to inspect the role of the six selected Asian stock market volatilities in forecasting Chinese EPU. Due to reforms in financial policies by Asian financial markets in recent decades to facilitate and encourage cross-country investment (Wang & Liu, Citation2016) and given the importance of stock market volatility in economic development, consequently, it is reasonable to study the predictive role of asset volatilities in forecasting EPU as EPU represents the uncertainty in the economic policy of any country.
The literature exploring the connection of return and/or volatility of the stock market with EPU has flourished across the globe, including both developed and emerging economies. Extensive research has mainly concentrated on exploring the relationship of own country EPU with the returns/volatility of local stock markets (Bekiros et al., Citation2016; Rahman et al., Citation2019) among others, while various studies explored the transnational influences of EPU on the stock markets of other emerging economies such as Brazil, Australia, Canada, Japan, China, South Africa, and on the financial markets of some trade group countries such as ASEAN, BRIC, EU and GCC (Balcilar et al., Citation2019; Carrière-Swallow & Céspedes, Citation2013; Istiak & Alam, Citation2019; Kang & Ratti, Citation2015) among others.
Apart from this, there is increasing research work examining the influence of EPU on other crucial topics such as monetary policy (Aastveit et al., Citation2013), inflation and output (Jones & Olson, Citation2013), financial stress (Sun et al., Citation2017), investing behaviour (Gulen & Ion, Citation2015), exchange rates (Beckmann & Czudaj, Citation2017), bank lending (Bordo et al., Citation2016), sovereign risk (Wisniewski & Lambe, Citation2015), foreign exchange markets (Kido, Citation2016), cash holding (Demir & Ersan, Citation2017) and stock price crash risk (Jin et al., Citation2019).
When it comes to assessing the impact of Chinese EPU, numerous studies have focused primarily on the performance of local or mainland stock markets. For example, Yang and Jiang (Citation2016) inspected the association of stock return with Chinese EPU. The authors established that stock returns and EPU are significantly co-related based on the findings of VAR and SVAR, while based on the results of the DCC-MGARCH technique, the authors established a weak dynamic link between the coefficient of stock returns and EPU. While the study of Chen et al. (Citation2017) documented that future returns of Chinese stock markets are negatively forecast by EPU even after controlling for several other variables that represent financial or macro uncertainty. The study of Li et al. (Citation2016) established a significant causal association of Chinese EPU and stock returns of financial markets in the sub-sample period, while there was no significant causal relationship between them during the full sample period. Moreover, the study of Xiong et al. (Citation2018) used the DCC-GARCH approach to examine the time-varying correlation of stock returns with EPU in China; the authors documented significant responses of stock returns to changes in the absolute level of EPU. Further, the authors revealed that during the stock market crash in China and financial crises around the world, this correlation has large fluctuations. More recently, the study of Rahman et al. (Citation2019) has investigated whether changes in Chinese EPU have any substantial influence on the price discrepancy of the dual-listed AH share premium index. The authors used a counterfactual approach of nonparametric kernel density estimation technique and concluded that Chinese EPU explains variations in prices of AH shares, and significantly decreases AH premium share index returns. Furthermore, some studies have also explored the spillover effects of Chinese EPU on macro-economic activities (see, for example, Fontaine et al., Citation2017; Yan, Citation2018), leverage decisions of shipping firms in Thailand (Kotcharin & Maneenop, Citation2018) stock markets (Balcilar et al., Citation2019; Tsai, Citation2017).
Moreover, several studies have documented that fluctuations in market conditions and oil prices cause changes in EPU (Kang & Ratti, Citation2015; Ko & Lee, Citation2015) among others. However, the literature on a reverse channel such as the transnational influences of asset volatilities in predicting EPU has received little or no research attention in the empirical literature. Breaking away from the above-mentioned literature, the purpose of our study is to fill this literature gap. Even so, Wang et al. (Citation2015) documented that changes in commodity prices predict the EPU of the U.S. economy. The study of Degiannakis and Filis (Citation2019) documented that European EPU can be forecast based on Global EPU and European and U.S. asset market volatilities. Hence, we also maintain that stock market volatilities in regional Asian economies could contain significant information in predicting Chinese EPU.
3. Data and research methodology
3.1. Data and their relevant sources
The study employed monthly data for a sample period of March 2011 to June 2018 from different data sources to assess the role of financial market performance (measured in terms of return and volatility) of Southeast Asian economies in forecasting Chinese EPU. We obtain monthly data of the Chinese EPU index from the website of Baker et al. (Citation2016).Footnote5 The data for asset prices were obtained from the relevant stock indices of these countries. The data for these indices were taken from the website of the WIND database and investing.com. We used the following formula to calculate stock market return:
(3.1)
(3.1)
where
represents monthly returns of a country i at time t,
shows current month prices of stock and
shows the last month prices. To calculate volatility, this study uses monthly aggregate realised volatility (Jorion, Citation1995) as follows:
(3.2)
(3.2)
where
display monthly realised volatility of a country i at month t, and
display the squared daily returns at time t and t-22 shows the last 22 trading days of month t.
Additionally, we also take into account the economic situations of the sample economies to check whether they could also play any role in forecasting Chinese EPU. We used the following macroeconomic variables to represent the economic conditions of the sample countries. These variables include real effective exchange rate (ExRate), GDP growth rate (GDP),Footnote6 trade balance in US dollars (TB), bank policy rate as interest rate (IR) and industrial production index (IPI). These variables were taken from the Economic and Financial Indicators Database (EFID) of the Asian Development Bank (ADB).
3.1.1. Calculation of EPU outliers/outstanding points
We take EPU outliers as the dependent variable instead of the value of EPU itself, because the outlier of EPU can better reflect the uncertainty of economic development, and the impact of such uncertainty is also greater. On the other hand, since the models used in our study required binary outcomes of response variable; a technique is required to classify EPU as ‘1‘or ‘0′. We split the EPU data into two outcomes which are an outlier/outstanding point (1) and no-outlier (0). In order to predict an outlierFootnote7 in the EPU, we used the following process:
Firstly, we calculated the trend of Chinese EPU to obtain the de-trending series. We ran a time series regression with a ‘time trend’ as a predictor to calculate the time trend, using the following model:
(3.3)
(3.3)
Here is the response variable (EPU) while time is the explanatory variable, which is measured in months.
Secondly, we calculated the difference between the true value and predicted trend value and then we compared this value (difference value) with the standard deviation of EPU. We found the points at which the difference between the true value and predicted trend values was greater than the standard deviation and we treated these points as outliers/outstanding points.
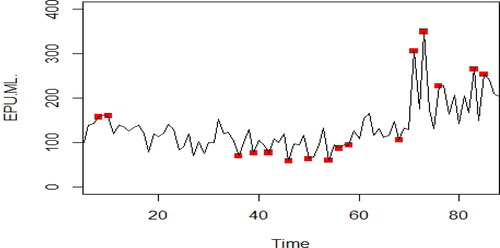
Finally, we created a series of new variables of the outliers/outstanding points, that is 0 means this point is not an outlier, and 1 means this point is an outlier. Note that, during this step, if two or more consecutive adjacent points are identified as ‘outliers‘, only the first of them is chosen as an outlier. At the end, 16 points are selected from 88 points as outliers, which are 8, 10, 36, 39, 42, 46, 50, 54, 56, 58, 68, 71, 73, 76, 83 and 85 as shown in .
Figure 1. The outstanding points of Chinese EPU. Source: Authors' Formation.
3.2. Forecasting models
3.2.1. Logistic regression (LR) model
In this study, the relationship between foreign (i.e. ASEAN5 and Hong Kong) financial and macroeconomic conditions and Chinese EPU has been analysed using the logit model. The LR model is a standard and the prevalent statistical method which is used to predict classification type problems. It is considered as an important type of General Linear Regression Model (GLIM) for categorical response data. It is a distinctive kind of regression method which has qualitative (dichotomous or binary) dependent variables and the predictors could be both discrete or continuous or a combination of discrete and continuous, i.e. it can evaluate a mixture of all kinds of explanatory variables (Hair et al., Citation1995). The benefit of using the LR technique is that it does not consider the assumption of linearity, normality, and homoscedasticity between response and predictor variables (Zavgren, Citation1985) that are based on the ordinary least square (OLS) approach.
Previously, the logit model has been used as a standard approach to predict corporate bankruptcy (Ohlson, Citation1980) and crises (Barrell et al., Citation2010; Demirgüç-Kunt & Detragiache, Citation2005). However, we used the logit model to predict outliers in Chinese EPU using ASEAN5 and Hong Kong stock market volatilities as predictors while controlling for other macroeconomic variables. It is commonly used to predict the dependent variable as either crises or no-crises (in our case, outlier or no-outlier) based on predictive variables. The logit model estimates the probability that outliers/outstanding points in the regressor (Chinese EPU) will occur with a vector of predictors (Xi,t). The value of the EPU variable (Yi,t) is a zero-one (0,1), that is, it will take the value of one when a certain quality is present with probability ‘p‘(i.e. when there is an outlier/outstanding point in the response variable, that is when the value of EPU exceeds their standard deviation) otherwise it is 0 when a certain quality is absent with probability ‘1- p‘. The estimation of the logistic model is given by:
(3.4)
(3.4)
Similarly:
(3.5)
(3.5)
Now EquationEquation (3.4)(3.4)
(3.4) is divided by EquationEquation (3.5)
(3.5)
(3.5) to get the final equation:
(3.6)
(3.6)
where
represents unknown coefficients,
and
indicate the probabilities of 1 and 0 respectively, and
is the exponential constant.
Standard measures used to assess OLS parameters do not apply to the LR model, but instead the parameters of the LR model are assessed by using the Maximum Likelihood Method (MLM) and the significance of a particular parameter is tested by using the likelihood-ratio Chi-Square (or Wald) test. We used the Wald statistic to identify the significant predictors. Wald test is the square of the asymptotic t-ratio and is given as:
(3.7)
(3.7)
Another important aspect of the LR method is to check the model fit. For this purpose, the well-known Hosmer-Lemeshow test is used to check if the model fits the data well or not. This test was suggested by Hosmer et al. (Citation1989), and it measures how effectively the response variable is described by the model. Based on expected probabilities, this approach groups the observations and then tests the hypothesis that the difference between the observations of the observed and predicted group is approximately zero, i.e. there is no substantial variation in the values of the observed group and the values of the predicted group. This test assesses the statistics through simulation and generally follows the distribution of chi-square. The maximum value of the Wald statistic (Chi-Square value) is the indication of the minimum standard error of the corresponding parameter. The Wald test (chi-square value) is only used for models with binary response data. At least here groups must be made to compute this test.
3.2.2. Decision tree model (DTM)
The study considers an additional statistical model to forecast Chinese EPU. The DT is a regular and a strong model for prediction and classification. It is a machine learning algorithm that splits the data into subsets. They are among the most commonly used transparent predictive modeling approaches, because of fewer data requirements and easily interpretable as well as handling the data well with binary or categorical characteristics. Unlike parametric models, the DT models do not have assumptions about the underlying data distribution and there is no need to consider monotonic transformations such as logarithms. They are tree-like graphs, comprising of nodes consistent with the predictors (independent variables), and repeatedly split the data by pecking order (asking a question of ‘if-and-else’) until the classification is made. The objective is to generate a model that replicates the end value for the target or dependent variable using several input or independent variables. CART and CHAID (Breiman et al., Citation1984) are well-known methods in this field. This study has used the CART approach. The CART approach is a binary-split category decision tree procedure that can use both categorical as well as continuous predictors. This technique is a ‘binary recursive partitioning‘which splits data into two subgroups to produce similar records in each subgroup which are compared contrary to the prior subgroup and works repeatedly until identical subgroups are created. This technique permits the tree to grow first, then uses a technique of cost-complexity to prune it. The process of pruning of CART analysis merges and terminates less important nodes and generates smaller trees.
To select significant variables from a classification tree, a function known as incongruous and gene index is used. The variable with a higher value of gene index (Gini) is the most suitable and important factor that explains the response variable.
4. Empirical analysis and discussion
4.1. Logistic regression results to predict Chinese EPU outliers
From the results of LR are given for Hong Kong and ASEAN5 (Indonesia, Malaysia, Philippine, Singapore and Thailand) respectively. The financial variables that include returns and volatility of stock markets and other macroeconomic variables from a country (i) are entered in the LR model to predict whether the stated variables explain the outliers in Chinese EPU or not.
Table 1. Panel A: Logistic Regression Results for Hong Kong.
Table 2. Panel A: Logistic Regression Results for Indonesia.
Table 3. Panel A: Logistic Regression Results for Malaysia.
Table 4. Panel A: Logistic Regression Results for the Philippines.
Table 5. Panel A: Logistic Regression Results for Singapore.
Table 6. Panel A: Logistic Regression Results for Thailand.
It is clear from that volatility in AH premium (at a significant level of 5%) and trade balance (TB) (at a significant level of 10%) of Hong Kong are the significant predictors i.e. they significantly explain the outliers in Chinese EPU.
Panel B of shows the model’s goodness of fit test to the data. Generally, Hosmer-Lemeshow and log Likelihood tests are used to evaluate the model fit. We used the Hosmer-Lemeshow test (1989) to assess the null hypothesis of whether the model reasonably fits the data.
Based on panel B results, we establish that the model is a good fitting model. The observed Chi-Square value’s significance level is equal to 0.7032, which means that there is no significant difference between the values of the observed group and the values of the predicted group. It can be concluded that it is very meaningful to use the LR model.
It is clear from that stock market return (10%, significant level) and volatility (5%, significant level) of Indonesia are the significant predictors i.e. they significantly explain the outliers in Chinese EPU. It is clear from panel B of that the model is good fitting as the observed Chi-Square value’s significance level is equal to 0.894, which means that there is no significant difference between the values of the observed group and the values of the predicted group.
demonstrates the results of the LR model for the financial and economic variables of Malaysia. It is clear from the results of that stock market volatility, the exchange rate (5%), GDP growth rate, trade balances and interest rate (10%) of Malaysia significantly explain the outliers in Chinese EPU. While the observed Chi-Square value’s significance level is equal to 0.0811, which means the difference between the values of the observed group and the values of the predicted group is not large enough.
The results of the LR model (as shown in ) for the Philippines shows that stock market volatility (10%) and exchange rate (5%) significantly explain the outliers in Chinese EPU. The observed Chi-Square value’s significance level of goodness of fit (Hosmer and Lemeshow test) is equal to 0.3941, which means that there is no significant difference between the values of the observed group and values of the predicted group and the usage of the LR method is meaningful.
and show the results for Singapore and Thailand respectively. It is clear that in the case of Singapore () only stock market returns significantly explain the outliers in Chinese EPU, while in the case of Thailand (), no variable significantly influences the outliers of EPU. However, their goodness of fit test shows that the observed Chi-Square value’s significance level of goodness of fit (Hosmer and Lemeshow test) for Singapore and Thailand is equal to 0.5945 and 0.6508 respectively, which means that the usage of LR method is meaningful.
4.2. Decision tree results to predict Chinese EPU outliers
give the results of DTs for Hong Kong and ASEAN5 economies respectively.
Figure 2. The created decision tree for the variables of Hong Kong. Source: Authors' Formation.
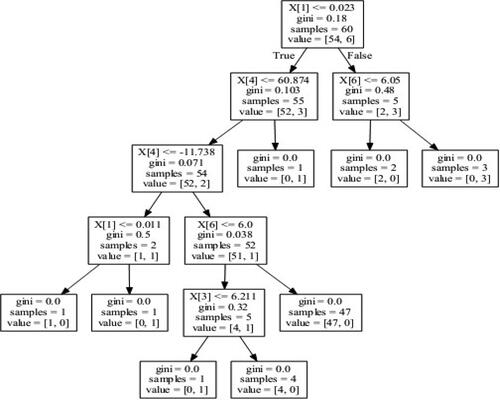
Figure 3. The created decision tree for the variables of Indonesia. Source: Authors' Formation.
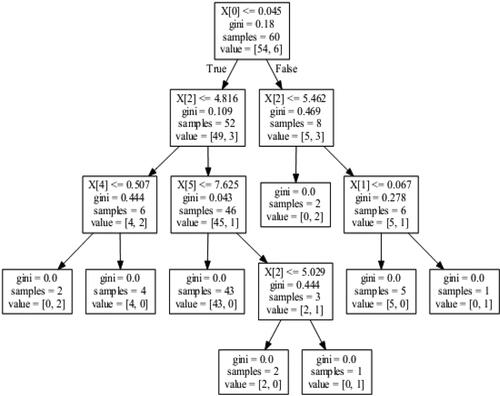
Figure 4. The created decision tree for the variables of Malaysia. Source: Authors' Formation.
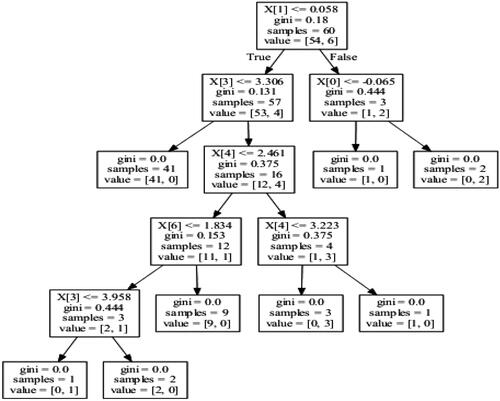
Figure 5. The created decision tree for the variables of the Philippines. Source: Authors' Formation.
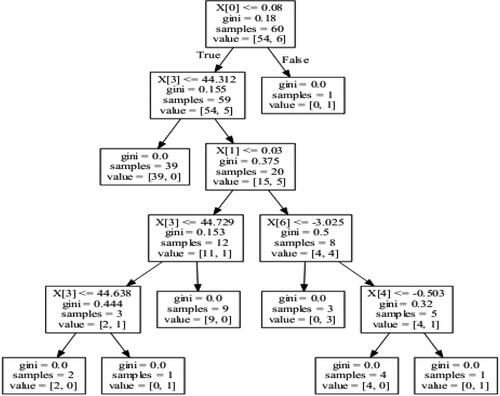
Figure 6. The created decision tree for the variables of Singapore. Source: Authors' Formation.
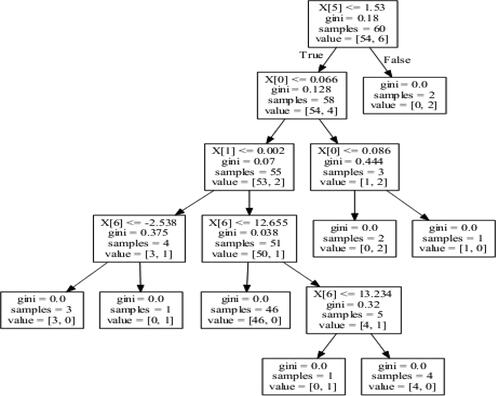
Figure 7. The created decision tree for the variables of Thailand. Source: Authors' Formation.
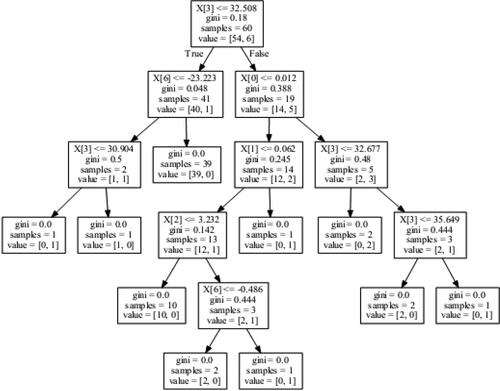
Note: In every figure, x[0] represent return (Ri) of country i, x[1] represent volatility (VOLi) of country i, x[2] represent GDP of country i, x[3] represent Exchange Rate (ExRate) of country i, x[4] represent Trade Balance (TB) of country i, x[5] represent Interest Rate (IR) of the country I and x[6] represent Industrial Production Index (IPI) of the country I.
depicts a tree for predicting outliers in Chinese EPU based on financial and macroeconomic variables from Hong Kong. Starting with the first node on the top with 60 samples and a Gini index of 0.18, if the predictor variable is less than 0.023, the DT navigates to the left (true); otherwise, it will be traversed to the right. This pattern is repeated until a decision node is reached at which the Gini index becomes zero. At this point, each node is to be classified as an outlier or no outlier.
From it can be observed that for this specific training set, only three variables out of seven mattered. More specifically, in order of importance, variables x[1] (volatility), x[6] (IPI) and x[4] (TB) explain the outliers in Chinese EPU.
indicates a tree for predicting outliers in Chinese EPU based on financial and macroeconomic variables from Indonesia. Starting with the first node on the top with 60 samples and a Gini index of 0.18, it can be observed that for this specific training set, four variables out of seven mattered for predicting outliers in EPU. More specifically, in order of importance, variables x[0] (returns), x[2] (GDP), x[4] (TB) and x[5] (IR) explain the outliers in Chinese EPU.
depicts a tree for predicting outliers in Chinese EPU based on financial and macroeconomic variables from Malaysia. From it can be observed that for this specific training set, five variables explain outliers in Chinese EPU, which can be classified (in order of importance) as x[1] (volatility), as x[0] (returns), x[3] (Exchange rate), x[4] (TB) and x[6] (IPI) respectively.
draws a DT for predicting outliers in Chinese EPU based on financial and macroeconomic variables from Philippine. From it can be observed that x[0] (returns), x[3] (Exchange rate), x[0] (volatility), x[6] (IPI) and x[4] (TB) respectively are important variables that explain outliers in Chinese EPU.
draws a DT for predicting outliers in Chinese EPU based on financial and macroeconomic variables from Singapore. It is clear from that for this specific training set, the important variables that explain outliers in Chinese EPU are x[5] (IR), x[0] (returns), x[1] (volatility) and x[6] (IPI) respectively.
depicts a tree for predicting outliers in Chinese EPU based on financial and macroeconomic variables from Thailand. From it can be observed that variables that mattered to identify outliers in EPU are x[3] (Exchange rate), x[0] (returns), x[6] (IPI), x[1] (volatility) and x[2] (GDP) respectively (variables are arranged in order of importance).
4.3. Comparison using the classification accuracy
To identify whether the results of LR and DT analysis are close to each other or not, we need to classify and identify the accuracy of data. The accuracy score test is the most popular method of quality assessment. This test can be calculated using the following formula:
(3.8)
(3.8)
where
and
= Predicted value of EPU in month t
= Actual value of EPU in month t
The classification accuracy analysis helps in evaluating the model’s performance by cross-tabulating the response categories of observed values with the predicted one. For each case, the predicted response is considered as one if the predicted probability is greater than the cut off rate; otherwise it is considered as zero. In this study, the cut-off value for the LR model is set to 0.5. The results of classification accuracy for all countries are shown in , for both LR (Panel A) and DT analyses (Panel B).
Table 7. Classification Accuracy Table (Comparison of LR and DT performance).
By using the LR model, the classification accuracy analysis of Hong Kong (, panel A) shows that the results for 33% of non-outliers (EPU-0) and 87% of outliers (EPU = 1) are classified accurately. The results show that 85% of outliers in EPU are correctly classified, while in the case of DT analysis (, panel B) the percentage of correctly classified outliers is 82.1%.
Similarly, it can be observed from the results of for other countries, which show the classification accuracy analysis of both models for ASEAN5 countries respectively (Indonesia, Malaysia, the Philippines, Singapore, and Thailand), that the overall percentage of correctly classified outliers, in the case of LR (Panels A for all countries) is 88.6%, 92.0%, 88.6%, 87.4% and 88.6%, respectively, In the case of DT analysis (Panels B), the overall percentage of correctly classified outliers is 75.0%. 71.4%, 71.4%, 55.6% and 75% respectively. Therefore, it can be concluded that the performance of LR in this specific case is better than that of DT analysis; this may be due to smaller data set/observations.Footnote8
5. Conclusion and policy implications
5.1. Conclusion
We forecast movements in Chinese EPU for the first time, using information from the six selected East Asian economies (including ASEAN5 and Hong Kong) stock market volatilities and macroeconomic variables. These economies are the major trading partners of China, and it is expected that any change, especially in the financial and economic sectors of these economies, might have significant influences on Chinese macroeconomic policies. In this regard, we try to evaluate whether Chinese EPU (outliers/outstanding points) can be explained with the help of asset volatilities in ASEAN5 and Hong Kong stock markets by controlling other macroeconomic variables. The study firstly employed the LR method, and the results reveal that stock market performance of all countries (except for Thailand) significantly predict outliers in Chinese EPU. These results are in line with the results of Degiannakis and Filis (Citation2019) who investigated the role of global EPU and asset market volatilities of Europe and the U.S. to forecast EPU of Europe. The authors concluded that financial asset realised volatilities of Europe and the U.S. have significant predictive gains on forecasting European EPU. Among the other control variables, the trade balance and the exchange rate werethe significant variables that explain the outliers of EPU.
To draw comparable results, the study also employed DTM to forecast Chinese EPU. The results show that asset market volatilities of ASEAN5 and Hong Kong offer significant predictive gains for Chinese EPU. However, the overall percentage of correctly classified outliers in the case of LR is 88.6%, 92.0%, 88.6%, 87.4% and 88.6%, respectively for Hong Kong and ASEAN5, while in case of DT model the overall percentage of correctly classified outliers is 75.0%. 71.4%, 71.4%, 55.6% and 75%, respectively. Therefore, it can be concluded that the performance of the LR model in this specific case is better than that of DT analysis. Consequently, the LR model with realised volatilities of regional (ASEAN5) and Hong Kong stock markets and other control variables is the acceptable framework to encapsulate accurately the future directions of Chinese EPU (outliers).
5.2. Policy implications
High uncertainty in economic policy increases the financing cost, and in the case of irreversible investment it leads to reduced investment (Bernanke, Citation1983), unemployment and economic contraction (Bloom et al., Citation2007). Consistent with this, policymakers, who aim to maintain the low level of EPU, should properly take measures to reduce EPU to avoid reduced consumer spending and to foster a productive investment environment in the economy. The outcomes of our study could provide numerous implications. For policymakers, the results of the study will provide important insight to ensure growth in investments. The results can provide valuable insights to policymakers and economists about the substantial predictive role of the regional financial and economic conditions on EPU forecasting. Policymakers must make their actions predictable in policy implementation. For example, when there is a rise in the volatility of the stock market, either from Hong Kong or the ASEAN5 economies, then the policymakers should know that a certain pattern will be followed by uncertainty in Chinese EPU in the following months, which will help them to control the situation before (proactive response) rather than responding to it (reactive response). The policymakers should pay attention to financial uncertainty and should monitor the financial developments that have been taking place in East Asian Economies to correctly forecast the Chinese EPU.
Further, based on the findings of this study, it is recommended that this area of research deserves more attention. As a follow-up on the findings of this study, more research can be conducted which can investigate the influence of the other regional economic systems and a US-China trade war to forecast Chinese EPU. Besides the financial and economic conditions of other associated economies, such as US, BRICS, etc. could also be used to forecast Chinese EPU. The other studies can also examine the determinants and the sources of the interaction between them to ensure financial stability and promote economic growth and development in the global setting.
Moreover, our study has concentrated on financial markets to forecast and predict EPU while controlling for other macroeconomic variables, however, researchers could also focus on certain other major uncertain economic events in future, such as political events. For example, as pointed out by Baker et al. (Citation2016), the EPU index is driven by political events and other policy decisions such as election cycles. Expectations about tax changes (Hassett & Sullivan, Citation2016) and regulatory complexity (Davis, Citation2017) and other financial uncertainty (such as VIX) and macroeconomic uncertainty indices (Jurado et al., Citation2015; Scotti, Citation2016) could also be employed to forecast EPU.
Acknowledgments
The authors would like to thank the Editor and the anonymous referees for their truly helpful comments and suggestions which led to a much-improved presentation.
Disclosure statement
No potential conflict of interest was reported by the author(s).
Additional information
Funding
Notes
1 For detail please see the relevant literature section.
2 Donadelli (Citation2015) used the VAR framework and documented that shocks in Asian stock markets lead to a long-lasting drop in U.S. EPU, which might affect fiscal and monetary authorities. Hence, we also expect that volatilities in the selected Asian stock markets will have a significant predictive role in forecasting Chinese EPU.
3 Asian Development Bank (2009), ‘Asian Economic Monitor’, July 2009, Manila. (https://www.adb.org/publications/series/asian-economic-integration-report?page=1).
4 This uncertainty index captures and highlights the macro level of the Chinese economy, policy and uncertainty and any fluctuations in it may subsequently affect the economic growth of China.
6 Monthly data for GDP was not available; therefore, we used interpolation technique to change quarterly data into monthly data.
7 Set of observations the values of which deviate from the expected range (which is a standard deviation in our case).
8 The study of Perlich et al. (Citation2003) established that in the case of smaller datasets, the LR technique is better while in the case of larger datasets DT analysis is better.
References
- Aastveit, K., Natvik, G. J. J., Sola, S. (2013). Economic uncertainty and the effectiveness of monetary policy. Norges Bank Working Paper No. 2013/17, 34. https://doi.org/https://doi.org/10.2139/ssrn.2353008
- Baker, S. R., Bloom, N., & Davis, S. J. (2016). Measuring economic policy uncertainty. The Quarterly Journal of Economics, 131(4), 1593–1636. https://doi.org/https://doi.org/10.1093/qje/qjw024
- Balcilar, M., Gupta, R., Kim, W. J., & Kyei, C. (2019). The role of economic policy uncertainties in predicting stock returns and their volatility for Hong Kong, Malaysia and South Korea. International Review of Economics & Finance, 59, 150–163. https://doi.org/https://doi.org/10.1016/j.iref.2018.08.016
- Barrell, R., Davis, E. P., Karim, D., & Liadze, I. (2010). Bank regulation, property prices and early warning systems for banking crises in OECD countries. Journal of Banking & Finance, 34(9), 2255–2264. https://doi.org/https://doi.org/10.1016/j.jbankfin.2010.02.015
- Beckmann, J., & Czudaj, R. (2017). Exchange rate expectations and economic policy uncertainty. European Journal of Political Economy, 47, 148–162. https://doi.org/https://doi.org/10.1016/j.ejpoleco.2016.06.003
- Bekiros, S., Gupta, R., & Majumdar, A. (2016). Incorporating economic policy uncertainty in US equity premium models: A nonlinear predictability analysis. Finance Research Letters, 18, 291–296. https://doi.org/https://doi.org/10.1016/j.frl.2016.01.012
- Bernanke, B. S. (1983). Irreversibility, uncertainty, and cyclical investment. The Quarterly Journal of Economics, 98(1), 85–106. https://doi.org/https://doi.org/10.2307/1885568
- Bloom, N. (2009). The impact of uncertainty shocks. Econometrica, 77(3), 623–685.
- Bloom, N., Bond, S., & Van Reenen, J. (2007). Uncertainty and investment dynamics. Review of Economic Studies, 74(2), 391–415. https://doi.org/https://doi.org/10.1111/j.1467-937X.2007.00426.x
- Bordo, M. D., Duca, J. V., & Koch, C. (2016). Economic policy uncertainty and the credit channel: Aggregate and bank level US evidence over several decades. Journal of Financial Stability, 26, 90–106. https://doi.org/https://doi.org/10.1016/j.jfs.2016.07.002
- Breiman, L., Friedman, J., Ohlsen, R., & Stone, C. (1984). Classification and regression trees. In Advanced books & software (pp. 121–125). Wadsworth & Brooks/Cole.
- Carrière-Swallow, Y., & Céspedes, L. F. (2013). The impact of uncertainty shocks in emerging economies. Journal of International Economics, 90(2), 316–325. https://doi.org/https://doi.org/10.1016/j.jinteco.2013.03.003
- Chen, J., Jiang, F., & Tong, G. (2017). Economic policy uncertainty in China and stock market expected returns. Accounting & Finance, 57(5), 1265–1286. https://doi.org/https://doi.org/10.1111/acfi.12338
- Chien, M.-S., Lee, C.-C., Hu, T.-C., & Hu, H.-T. (2015). Dynamic Asian stock market convergence: Evidence from dynamic cointegration analysis among China and ASEAN-5. Economic Modelling, 51, 84–98. https://doi.org/https://doi.org/10.1016/j.econmod.2015.06.024
- Das, D. K. (2014). The role of China in Asia’s evolution to global economic prominence. Asia & the Pacific Policy Studies, 1(1), 216–229. https://doi.org/https://doi.org/10.1002/app5.10
- Davis, S. J. (2017). Regulatory complexity and policy uncertainty: Headwinds of our own making. Becker Friedman Institute for Research in Economics Working Paper (2723980).
- Degiannakis, S., & Filis, G. (2019). Forecasting European economic policy uncertainty. Scottish Journal of Political Economy, 66(1), 94–114. https://doi.org/https://doi.org/10.1111/sjpe.12174
- Demir, E., & Ersan, O. (2017). Economic policy uncertainty and cash holdings: Evidence from BRIC countries. Emerging Markets Review, 33, 189–200. https://doi.org/https://doi.org/10.1016/j.ememar.2017.08.001
- Demirgüç-Kunt, A., & Detragiache, E. (2005). Cross-country empirical studies of systemic bank distress: A survey. National Institute Economic Review, 192(1), 68–83. https://doi.org/https://doi.org/10.1177/002795010519200108
- Donadelli, M. (2015). Asian stock markets, US economic policy uncertainty and US macro-shocks. New Zealand Economic Papers, 49(2), 103–133. https://doi.org/https://doi.org/10.1080/00779954.2014.890024
- Fontaine, I., Didier, L., & Razafindravaosolonirina, J. (2017). Foreign policy uncertainty shocks and US macroeconomic activity: Evidence from China. Economics Letters, 155, 121–125. https://doi.org/https://doi.org/10.1016/j.econlet.2017.03.034
- Gulen, H., & Ion, M. (2015). Policy uncertainty and corporate investment. The Review of Financial Studies, 29(3), 523–564.
- Hair, J. F., Anderson, R. E., Tatham, R. L., & Black, W. C. (1995). Multivariate date analysis with readings. Prentice.
- Hassett, K. A., Sullivan, J. (2016). Policy uncertainty and the economy. AEI Research, August.
- Hosmer, D. W., Lemeshow, S., & Sturdivant, R. X. (1989). The multiple logistic regression model. Applied Logistic Regression, 1, 25–37.
- Istiak, K., & Alam, M. R. (2019). US Economic policy uncertainty spillover on the stock markets of the GCC countries. Journal of Economic Studies, 47(1), 36–50.
- Jin, X., Chen, Z., & Yang, X. (2019). Economic policy uncertainty and stock price crash risk. Accounting & Finance, 58(5), 1291–1318. https://doi.org/https://doi.org/10.1111/acfi.12455
- Jones, P. M., & Olson, E. (2013). The time-varying correlation between uncertainty, output, and inflation: Evidence from a DCC-GARCH model. Economics Letters, 118(1), 33–37. https://doi.org/https://doi.org/10.1016/j.econlet.2012.09.012
- Jorion, P. (1995). Predicting volatility in the foreign exchange market. The Journal of Finance, 50(2), 507–528. https://doi.org/https://doi.org/10.1111/j.1540-6261.1995.tb04793.x
- Jurado, K., Ludvigson, S. C., & Ng, S. (2015). Measuring Uncertainty. American Economic Review, 105(3), 1177–1216. https://doi.org/https://doi.org/10.1257/aer.20131193
- Kang, W., & Ratti, R. A. (2015). Oil shocks, policy uncertainty and stock returns in China. Economics of Transition, 23(4), 657–676. https://doi.org/https://doi.org/10.1111/ecot.12062
- Karnizova, L., & Li, J. C. (2014). Economic policy uncertainty, financial markets and probability of US recessions. Economics Letters, 125(2), 261–265. https://doi.org/https://doi.org/10.1016/j.econlet.2014.09.018
- Kido, Y. (2016). On the link between the US economic policy uncertainty and exchange rates. Economics Letters, 144, 49–52. https://doi.org/https://doi.org/10.1016/j.econlet.2016.04.022
- Ko, J. H., & Lee, C. M. (2015). International economic policy uncertainty and stock prices: Wavelet approach. Economics Letters, 134, 118–122. https://doi.org/https://doi.org/10.1016/j.econlet.2015.07.012
- Kotcharin, S., & Maneenop, S. (2018). The giant’s pull: How macroeconomic conditions in China explain leverage decisions in Thailand’s shipping SMEs. The Asian Journal of Shipping and Logistics, 34(4), 337–344. https://doi.org/https://doi.org/10.1016/j.ajsl.2018.12.007
- Li, X. l., Balcilar, M., Gupta, R., & Chang, T. (2016). The causal relationship between economic policy uncertainty and stock returns in China and India: Evidence from a bootstrap rolling window approach. Emerging Markets Finance and Trade, 52(3), 674–689. https://doi.org/https://doi.org/10.1080/1540496X.2014.998564
- Liu, L., & Zhang, T. (2015). Economic policy uncertainty and stock market volatility. Finance Research Letters, 15, 99–105. https://doi.org/https://doi.org/10.1016/j.frl.2015.08.009
- Mala, R., & Reddy, M. (2007). Measuring stock market volatility in an emerging economy. International Research Journal of Finance and Economics, 8(5), 53–71.
- Masih, A. M., & Masih, R. (1999). Are Asian stock market fluctuations due mainly to intra-regional contagion effects? Evidence based on Asian emerging stock markets. Pacific-Basin Finance Journal, 7(3–4), 251–282. https://doi.org/https://doi.org/10.1016/S0927-538X(99)00013-X
- Morck, R., & Yeung, B. (2016). China in Asia. China Economic Review, 40, 297–308. https://doi.org/https://doi.org/10.1016/j.chieco.2016.07.009
- Nikmanesh, L. (2016). Trade openness and stock market volatility in the ASEAN-5 countries: New evidence using SUR. Investment Analysts Journal, 45(3), 194–211. https://doi.org/https://doi.org/10.1080/10293523.2016.1172806
- Ohlson, J. A. (1980). Financial ratios and the probabilistic prediction of bankruptcy. Journal of Accounting Research, 18(1), 109–131. https://doi.org/https://doi.org/10.2307/2490395
- Perlich, C., Provost, F., & Simonoff, J. S. (2003). Tree induction vs. logistic regression: A learning-curve analysis. Journal of Machine Learning Research, 4(Jun), 211–255.
- Pindyck, R. S. (1990). Irreversibility, uncertainty, and investment. National Beauru of Economic Research (No. w3307).
- Popp, A., & Zhang, F. (2016). The macroeconomic effects of uncertainty shocks: The role of the financial channel. Journal of Economic Dynamics and Control, 69, 319–349. https://doi.org/https://doi.org/10.1016/j.jedc.2016.05.021
- Rahman, M. U., Xu, B., Xiao, Y., & Lai, W. T. (2019). Explaining disparities in AH stock premium returns with Chinese economic policy uncertainty: Evidence based on a non-parametric analysis. Journal of Advanced Computational Intelligence and Intelligent Informatics, 23(4), 658–666. https://doi.org/https://doi.org/10.20965/jaciii.2019.p0658
- Scheffel, E. M. (2016). Accounting for the political uncertainty factor. Journal of Applied Econometrics, 31(6), 1048–1064. https://doi.org/https://doi.org/10.1002/jae.2455
- Scotti, C. (2016). Surprise and uncertainty indexes: Real-time aggregation of real-activity macro-surprises. Journal of Monetary Economics, 82, 1–19. https://doi.org/https://doi.org/10.1016/j.jmoneco.2016.06.002
- Soong, J. J. (2016). The political economy of development between China and the ASEAN states: Opportunity and challenge. The Chinese Economy, 49(6), 395–399.
- Sum, V. (2013). Economic policy uncertainty in the United States and Europe: A cointegration test. International Journal of Economics and Finance, 5(2), 98–101. https://doi.org/https://doi.org/10.5539/ijef.v5n2p98
- Sun, X., Yao, X., & Wang, J. (2017). Dynamic interaction between economic policy uncertainty and financial stress: A multi-scale correlation framework. Finance Research Letters, 21, 214–221. https://doi.org/https://doi.org/10.1016/j.frl.2016.12.010
- Tsai, I. C. (2017). The source of global stock market risk: A viewpoint of economic policy uncertainty. Economic Modelling, 60, 122–131. https://doi.org/https://doi.org/10.1016/j.econmod.2016.09.002
- Tsay, R. S. (2014). Financial Time Series. Wiley StatsRef: Statistics Reference Online, 1–23.
- Visco, I. (2017, 27 and 28 March). Financial market volatility and global policy uncertainty: A conundrum [Paper presentation]. Proceedings of a Conference Organized by IAI Rome, Challenges for Global Macroeconomic Stability and the Role of the G7.
- Wang, Y., & Liu, L. (2016). Spillover effect in Asian financial markets: A VAR-structural GARCH analysis. China Finance Review International, 6(2), 150–176. https://doi.org/https://doi.org/10.1108/CFRI-11-2014-0095
- Wang, Y., Zhang, B., Diao, X., & Wu, C. (2015). Commodity price changes and the predictability of economic policy uncertainty. Economics Letters, 127, 39–42. https://doi.org/https://doi.org/10.1016/j.econlet.2014.12.030
- Wisniewski, T. P., & Lambe, B. J. (2015). Does economic policy uncertainty drive CDS spreads? International Review of Financial Analysis, 42, 447–458. https://doi.org/https://doi.org/10.1016/j.irfa.2015.09.009
- Wu, T. P., Liu, S. B., & Hsueh, S. J. (2016). The causal relationship between economic policy uncertainty and stock market: A panel data analysis. International Economic Journal, 30(1), 109–122. https://doi.org/https://doi.org/10.1080/10168737.2015.1136668
- Xiong, X., Bian, Y., & Shen, D. (2018). The time-varying correlation between policy uncertainty and stock returns: Evidence from China. Physica A: Statistical Mechanics and Its Applications, 499, 413–419. https://doi.org/https://doi.org/10.1016/j.physa.2018.02.034
- Yan, M. (2018). Spillovers of economic policy uncertainty: Evidence From China. Available at SSRN 3297238.
- Yang, M., & Jiang, Z. Q. (2016). The dynamic correlation between policy uncertainty and stock market returns in China. Physica A: Statistical Mechanics and Its Applications, 461, 92–100. https://doi.org/https://doi.org/10.1016/j.physa.2016.05.019
- Zavgren, C. V. (1985). Assessing the vulnerability to failure of American industrial firms: A logistic analysis. Journal of Business Finance & Accounting, 12(1), 19–45. https://doi.org/https://doi.org/10.1111/j.1468-5957.1985.tb00077.x