
Abstract
This paper focuses on the interconnections between sovereign debt and the competitiveness of nations in the aftermath of the recent sovereign debt crises in the Eurozone. Further, it identifies new challenges to improving competitiveness. Based on a deductive approach, we analyse secondary data regarding sovereign debt and competitiveness in 28 EU countries for the period from 2006 to 2017. We also look at the recent theoretical developments in the competitiveness of companies, nations, and regions with the goal of identifying the new challenges to Portuguese competitiveness. In the period under analysis, Greece, Ireland, and Portugal had considerable losses in competitiveness and increases in their sovereign debt ratio. Despite benefiting directly from Porter’s insights into improving the country’s competitiveness, the Portuguese sovereign debt ratio has increased steeply. A previous analysis identified a path; however, there are new challenges such as those associated with EU competitiveness, shared value, and smart connected products. These need to be considered to support the creation of new strategies and policies for a small and open economy. Based on our analysis, we argue that competitiveness-oriented policies must more explicitly consider the negative implications of sovereign debt, and must recognize the new challenges to competitiveness.
JEL Classifications:
1. Introduction
The Competitive Advantage of Nations (Porter, Citation1990a, Citation1990b, Citation1998) highlighted the concepts of diamond, cluster and productivity in the context of national and regional competitiveness. This work defied the classical approaches to national prosperity and competitiveness, and soon a number of contributions followed that challenged, supported, or expanded this work by Michael PorterFootnote1. Recently, a special issue of the Competitiveness Review celebrated the twenty-fifth anniversary of this seminal work that confirmed the topicality of Michael Porter’s contribution and pointed to directions for future research (Ketels & Keller, Citation2015).
Notwithstanding its relevance, as a consequence of the debate over the years, there have been relevant contributions to enhance the initial view of Michael Porter on the competitiveness of nations and regions. The mentioned contributions either clarify or reinforce some of the aspects of the model or introduce new topics to the analysis. These new contributions imply that new analyses of nations and regions benefit from the accumulated research and experience. Simultaneously, over the last three decades, important changes have occurred in communication technologies, digitization, globalization, and European integration. These changes have affected the overall European Union economy and that of each member country, particularly in terms of competitiveness (Ketels & Porter, Citation2018).
Several nations and regions have taken direct advantage of Michael Porter’s approach to competitiveness. This was the case for Portugal. Immediately after the publication of The Competitive Advantage of Nations, Portugal invited a team led by the author to analyse its economy and to then provide recommendations. This team consolidated its findings in the 1994 report Building the Competitive Advantages of Portugal, also known as the Porter Report (for more information, see Gonçalves et al., Citation2015).
Despite the positive impact of the Porter Report on the Portuguese economy, the country’s competitiveness is still behind others because of delays in the implementation of public policies and because of difficulties regarding the operationalization of the institutions for collaboration (Gonçalves et al., Citation2015). The fragilities of Portuguese competitiveness (and clusters) were again exposed by its recent sovereign debt crisis. However, the literature barely addresses the causes for underperforming clusters (Giuliani et al., Citation2019) and their resilience to economic crises (Hanafi et al., Citation2017). This paucity may be an opportunity to reassess the challenges to competitiveness in Portugal, as Ketels and Porter (Citation2018) did with the European Union’s competitiveness.
To address the existing research gap and to meet our objective of understanding how countries (such as Portugal) which have high sovereign debts and low competitiveness should improve their innovation and competitiveness, we conduct a literature review and, based on a deductive approach and on secondary data referring to EU countries (data collected from Eurostat – sovereign debt ratio, World Economic Forum – competitiveness index, and AMECO – nominal GDP, sovereign debt and external debt), we conduct an analysis aiming to position EU countries on the basis of their competitiveness and sovereign debt ratios to support our reflection on the challenges to competitiveness in Portugal. The data presented in the paper reveals that there is a group of countries, including Portugal, struggling with high sovereign debt ratios and low levels of competitiveness which, according to our analysis and recent literature on competitiveness, implies that, while defining competitiveness policies, the sovereign debt ratio should not be neglected. We argue that, after taking into consideration this linkage and the impact of the new challenges associated with smart connected products and augmented reality, clusters continue to play a relevant role towards productivity and innovation.
Following this introduction, Section 2 deals with the advancements in competitiveness research. Then, Section 3 presents the evolution of sovereign debt in Portugal over the few last years and addresses the effect of sovereign debt on the Portuguese economy. Section 4 presents the relation between competitiveness and sovereign debt in the 28 European Union (EU) countries and in the specific countries that had recent sovereign debt crises. In Section 5, we draw conclusions and contributions for the competitiveness of Portugal. We also present some topics for future research in the final section.
2. Advancements on competitiveness
Ketels (Citation2013) presents a comprehensive review of the research regarding competitiveness (and clusters) that includes the new concept of competitiveness introduced by Delgado et al. (Citation2012, p. 1). This concept refers to the foundational competitiveness that aims to capture the ‘expected level of output per working-age individual’. However, this concept precedes recent, and relevant, contributions by Michael Porter (Porter & Heppelmann, Citation2014, Citation2015, Citation2017) that focus on the transformational effect of smart connected products (SCP) on competition, companies, and on the relevance of an ‘augmented reality strategy’. Porter and Heppelmann (Citation2014, Citation2015) are especially interesting because these directly expand Porter’s previous contributions on competition (five forces model) and companies (value chain analysis) based on the SCPs.
Despite the criticism, Porter’s initial contributions (Porter, Citation1990a, Citation1990b, Citation1998) that emphasize the importance of productivity and innovation with the goal of guaranteeing ‘a high standard of living for its citizens’ (Hanafi et al., Citation2017, p. 335) are still relevant. In the European Union context, as Ketels (Citation2013) shows, Porter’s initial contributions can be useful in the development of ‘smart specialization strategies’. Additionally, Porter’s initial contributions benefit from years of refinements from empirical-based and theoretical insights that lead to a broader analysis with more factors that influence ‘the prosperity of a location’ (Ketels, Citation2013, p. 270). Furthermore, effort has also been directed towards the identification of policy action areas. Other relevant clarifications relate to the new definition of competitiveness (Delgado et al., Citation2012), and with the fact that regional competitiveness is not solely supported in clusters. But these can be relevant in the context of the strategy for a region (Ketels, Citation2013). Regarding clusters, a consideration of the contributions from the analysis of less successful cases is also important (Giuliani et al., Citation2019).
Despite the merits of the previous literature, Ketels (Citation2013, p. 272) argues that the recent literature on competitiveness highlights the importance of finding a specific solution that takes into consideration the ‘particular circumstances at a given point in time’ instead of the solutions that are on average correct (Ketels & Porter, Citation2018) but fail in specific situations.
Regarding regional policies, or in a broader perspective the competitiveness policies, Ketels (Citation2013) is critical on those policies that transfer resources from wealthier and more competitive regions to less competitive ones. Competitiveness, even in the wealthier regions, has to be continuously developed. Simultaneously, Ketels (Citation2013) highlights that there are complex interactions between policies that influence economic performance. Further, Ketels refers explicitly to clusters when stating the importance of the continuous attention to the existing ones, and the importance of developing new clusters that are either based on unexplored assets or come from existing clusters through spillover effects or deepening certain areas of these clusters. The mechanisms leading to the evolution of clusters are addressed by Hervas-Oliver et al. (Citation2017).
However, Ketels (Citation2013) does not address the topic of shared value that according to Porter and Kramer (Citation2011) is also relevant to growth and specifically in the context of clusters. The adoption of a shared value perspective may help companies to take advantage of the new opportunities for innovation, while addressing social challenges that are based in the development of clusters to trigger productivity even with scarce resources (Porter & Kramer, Citation2011). Delgado et al. (Citation2014) in turn highlight that the specialization of locations present diminishing returns, which means that other regions can reduce the gap. This reduction also means that the excessive focus on a certain or a reduced number of clusters may lead to low economic growth. Converging with Ketels (Citation2013), Delgado et al. (Citation2014) also point to the externalities of existing clusters to develop new ones or new activities even if, in certain industries of the cluster, the employment growth rate declines.
Porter and Heppelmann (Citation2014) address the topic of competition in light of the new technological developments by claiming that SCPs ‘have unleashed a new era of competition’ (p. 66), specially for manufacturing industries, which may lead to a trajectory of economic growth that will not be replicable soon. However, there will be a period of coexistence between traditional and SCPs. The effects of SCPs extend to companies’ internal arrangements but also to the industry structure and the way companies compete. SCPs thus establish new opportunities and threats mainly because (contrary to previous IT-driven competition): ‘IT is becoming an integral part of the product itself’ (Porter & Heppelmann, Citation2014, p. 67). Each company’s competitive position will depend on the characteristics that it decides to incorporate in the product, as these decisions are now mainly related to software and not costly hardware parts (Porter & Heppelmann, Citation2015). Further, new business models are enabled by the information on the way consumers use products (product-as-a-service, for instance). Another fundamental issue derived from the emergence of SCPs relates to the boundaries of industries that are changing and ‘expanding even beyond product systems to systems of systems’ (Porter & Heppelmann, Citation2014, p. 75).
These changes from SCPs create new internal arrangements within firms that lead to Porter and Heppelmann (Citation2015, p. 98) considering that ‘what is under way is perhaps the most substantial change in the manufacturing firm since the Second Industrial Revolution, more than a century ago’. Further, data are at the centre of all these changes and are becoming a very relevant asset for companies by becoming a ‘key source of competitive advantage’ (Porter & Heppelmann, Citation2015, p. 100). However, as Porter and Heppelmann (Citation2017) show, the new transformations that will emerge in the near future will complement the SCP. And among these, augmented reality given the effect on how data is made available from machines to humans that will bring relevant benefits for productivity and cost efficiency in different stages of the value chain (for instance, for the purpose of training in the aircraft manufacturing industry, as pointed out by the authors).
3. The dynamics of the sovereign debt in Portugal (1995–2018)
3.1. The growth of sovereign debt in Portugal
Since 1995, Portugal has accumulated strong fiscal and external imbalances (Baer et al., Citation2013). Sovereign debt has increased from 58% in 1995 to up to 130% in 2016 and reduced to 120% in 2018. External net debt has increased from almost zero in 1995 to 100% in 2015 and to around 90% in 2018. The economic model of Portugal was based on domestic consumption and public investment and financed through debt. This model has failed to produce growth (Reis, Citation2013) and has led to what is called a ‘twin deficits’ situation (Abell, Citation1990), which also occurred in Greece (Kalou & Paleologou, Citation2012). There is some evidence in the literature of a long‐run secular relation between the trade and the fiscal deficits (Miller & Russek, Citation1989). With the 2008 financial and the Euro sovereign debt crises in 2010–2012 (see De Grauwe, Citation2012), these fiscal and external imbalances led Portugal to ask for a bailout from the ‘troika’ (IMF, EC, and ECB).
In the Eurozone, Portugal was the third country to ask for a financial rescue. Greece was the first due mainly to fiscal and external imbalances. Ireland was the second due to the crisis in its banking sector. In 2010, financial markets started to worry about the financial position of Portugal (household, corporate and government debts had reached 366% of GDP in 2010, one of the highest in the Eurozone – Cecchetti et al., Citation2011). Sovereign debt yields had increased in the secondary market and had reached more than 7% at the end of 2010. This led to intense pressure on public and private accesses to markets and funding. The Portuguese government was unable to curb the situation and asked for the financial bailout in March of 2011.
Studies have shown that high levels of debt constrain economic growth (Kourtellos et al., Citation2013; Reinhart & Rogoff, Citation2010). High levels of debt reduce the ability of governments to provide public services and also burden economic agents with taxes. However, the opposite is also likely: In the context of abundant credit and no domestic monetary policy, like in Portugal in the two decades after entering the Euro, low levels of growth increase the pressure on fiscal and external debts. As these two indicators are measured as a percentage of GDP, increasing public and external debts at a rate higher than the nominal GDP growth increases the ratio.
This was the case in Portugal. Before the financial crisis, credit to the private and public sector was abundant and at low interest rates. As a result, Portugal piled up a massive amount of debt. Once the markets closed out peripheral and highly indebted countries, Portugal had to seek help.
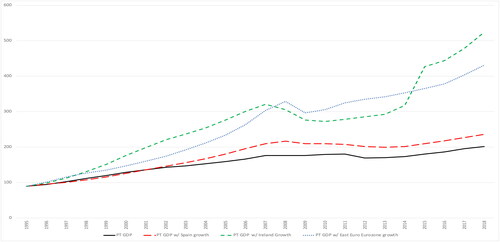
We argue that the main problem for Portugal was the lack of growth. To support this argument, we collected data on the nominal GDP for Portugal, Spain, Ireland and Eastern Eurozone countries and constructed . This figure shows that Portugal’s nominal GDP has been substantially below Spain and Ireland’s, and it is below the average of the Eastern Eurozone countries that are direct competitors of Portugal (Estonia, Cyprus, Latvia, Lithuania, Malta, Slovenia and Slovakia). Therefore, the lack of competitiveness, reflected, for instance, in the low productivity, of the Portuguese economy, led to a low level of economic growth. In real terms, from 1995 to 2018 the Portuguese economy had grown an average of 0.5% a year. This growth is lower than Spain’s (above 2%) and Ireland’s (around 6%) (source: AMECO, Citation2018).
Figure 1. Nominal GDP (1995–2018).
Note: Values are in billion €. This figure shows the nominal value of GDP from Portugal, but also the nominal value of the GDP if Portugal’s growth had been equal to Spain, Ireland, or the East European members of the Eurozone (Estonia, Cyprus, Latvia, Lithuania, Malta, Slovenia and Slovakia).
Source: Authors based on AMECO (Citation2018) data.
3.2. Economic growth’s effect on sovereign debt
In this subsection, we calculate the effect of higher economic growth on the imbalances of the country. To do this, based on the hypothetical nominal GDP values of Portugal presented in , we assume that the nominal value of the public and external debts of Portugal from 1995 to 2018 would remain equal to real values.
As presented in , when growth in the Portuguese economy is set at the same rate as Spain, Ireland, and the Eastern Eurozone countries there is a strong effect on the level of sovereign debt when measured as a percentage of GDP. If Portugal had had GDP growth similar to Ireland’s or the Eastern Eurozone countries’, sovereign debt would have remained below the 60% threshold of the Eurozone fiscal rules. The value of the sovereign debt is slightly above 60% of GDP only at the peak of the crisis (2009–2013). The effect on external debt is also extremely significant. As seen in , the external debt would be much lower if the GDP had had growth similar to Ireland’s or the Eastern Eurozone countries’. The external debt would have remained at almost half of the real values. The 2008 crisis would have arrived with the country facing low levels of public and external debts (around 40% of GDP in each case), instead of more than 100% of GDP. The pressure on the country would have been much less.
Figure 2. Portugal sovereign debt scenarios (1995–2018).
Note: This figure shows the value of the sovereign debt as a percentage of GDP if Portugal’s growth had been equal to Spain, Ireland, or the East European members of the Eurozone (Estonia, Cyprus, Latvia, Lithuania, Malta, Slovenia and Slovakia), and assumes the real nominal values of sovereign debt from 1995 to 2018.
Source: Authors based on AMECO (Citation2018) data for sovereign debt.
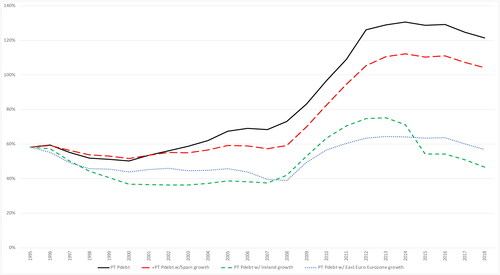
Figure 3. Portugal external debt scenarios (1995–2018).
Note: This figure shows the value of the external debt as a percentage of GDP if Portugal’s growth had been equal to Spain, Ireland, or the East European members of the Eurozone (Estonia, Cyprus, Latvia, Lithuania, Malta, Slovenia and Slovakia), and assumes the real nominal values of sovereign debt from 1995 to 2018.
Source: Authors based on AMECO (Citation2018) data for external debt.
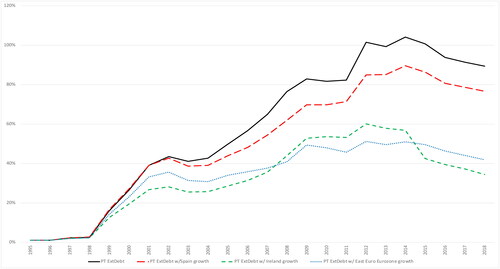
We can conclude that with higher economic growth, particularly before the 2008 crisis, the Portuguese imbalances would have been much lower. The country may have overcome the difficult period without asking for a bailout.
4. Competitiveness and sovereign debt
From Porter’s perspective, the roots of national and regional competitiveness are grounded in productivity and innovation. Delgado et al. (Citation2012) and Ketels (Citation2013) explore the connection between the productivity (as an antecedent of sustainable prosperity) of a nation or region and the policy factors as based on the following: 1) social infrastructure and political institutions (SIPI), such as basic health and education services, the political institutions’ quality, and the prevalence of the rule of law (Delgado et al., Citation2012); 2) monetary and fiscal policy (MFP) that incorporates ‘measures of fiscal sustainability and debt and inflation policies for managing short and medium-term fluctuations of economic activity’ (Delgado et al., Citation2012, p. 3); and 3) microeconomic competitiveness (MICRO). Delgado et al. (Citation2012), Ketels (Citation2013), and Parc (2018) consider that of these three policy groups, the impact of MFP is the least important. The macroeconomic factors that encompass the sovereign debt ratios ‘create opportunities for higher productivity but do not directly link to company productivity and labor mobilization’ (Delgado et al., Citation2012, p. 3).
Meanwhile, in the EU, the introduction of the Euro, along with other measures, increased macroeconomic stability but limited the range of policies national governments could use in a context of growing heterogeneity in the EU (Ketels & Porter, Citation2018). According to these authors, the appropriate changes in European policies have not followed the changes in context from European integration. This lack has had an effect on EU competitiveness, especially for South and East EU member countries that depend heavily on EU investment. Therefore, also according to the same authors, a new competitiveness policy is needed in Europe to take advantage of the opportunities from globalization and technological change, while coping with the pressures that these create, to benefit from ‘local competitive advantage’.
Ketels (Citation2013, p. 272) shows that the new research on competitiveness focuses on finding the factors for any location ‘that matter most given its particular circumstances at a given point in time’. Countries with a higher sovereign debt ratio and a lower competitiveness index are in a difficult position in terms of those ‘particular circumstances’ because the high sovereign debt ratio leads to more rigidity in government policies. This is especially true for those in the Eurozone and may reflect negatively on factor conditions, such as a reduction in infrastructure investment, and on demand conditions, such as decreases in public and private consumption. Simultaneously, the lower competitiveness index means that these countries face additional obstacles to increasing GDP. Despite the issues regarding EU policies, some EU countries have still managed to successfully implement strategies to improve their competitiveness (Ketels & Porter, Citation2018).
From a different perspective, in the aftermath of the international financial crisis and before all events related with the sovereign debt crises in Europe occurred, Reinhart and Rogoff (Citation2010) highlight that countries with debts above 90% of GDP presented lower growth rates, which Delgado et al. (Citation2012) also point out. Furthermore, Reinhart and Rogoff (Citation2010) argue that countries rarely manage to solve debt problems through growth.
To support our analysis, we collected data on the Competitiveness Index (gathered from the World Economic Forum) and the General Gross Debt to GDP ratio (gathered from the Eurostat). We present the 28 European Union countries for the period from 2006 to 2017 in the Appendix that illustrates the general government gross debtFootnote2 to GDP ratio and the global competitiveness index valueFootnote3. The analysis of the evolution of the countries is complex because the figure simultaneously captures the evolution over time of the competitiveness index and the sovereign debt ratio during the international financial crisis and the sovereign debt crises. For this reason, we summarize the data in to identify the accumulated variation in the competitiveness index and the debt ratio.
Figure 4. Variations in the competitiveness index and the sovereign debt ratio of the 28 EU countries (2006 to 2017).
Data sources: Eurostat and World Economic Forum.
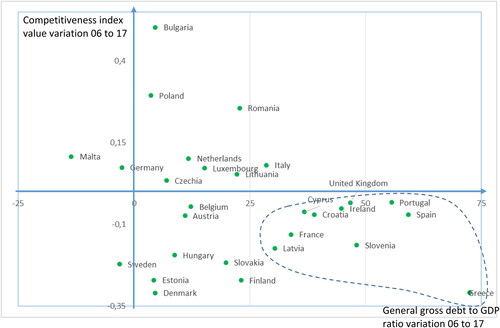
highlights that several countries have been confronted with relevant increases in their sovereign debt ratios and losses in the competitiveness index, both are calculated as the difference between 2017 and 2006. These countries are Greece, Spain, Portugal, Slovenia, the United Kingdom, Ireland, Croatia, Cyprus, France, and Latvia. However, only Greece, Ireland, and PortugalFootnote4 had sovereign debt crises and, consequently, needed technical assistance programmes from the European Commission, the European Central Bank, and the International Monetary Fund. also shows that all countries with high increases in their debt ratios had a corresponding decrease in the competitiveness value. In , we highlight the positions and evolutions of the three countries as well as of Spain that is often compared to Portugal.
Figure 5. Evolution of the general government gross debt (presented as percentage of GDP) and the global competitiveness index value from 2006 to 2017 in Spain, Greece, Ireland, and Portugal.
Notes: Since 2010, Greece’s general government gross debt ratio has been over 145% and for this reason, only presents data for Greece from 2006 to 2009. The competitiveness index value is a composite measure that ranges from 1 (low competitiveness) to 7 (high competitiveness). The figure also highlights the 90% threshold (dashed vertical line) for the debt ratio according to Reinhart and Rogoff (Citation2010). Data sources: Eurostat and World Economic Forum.
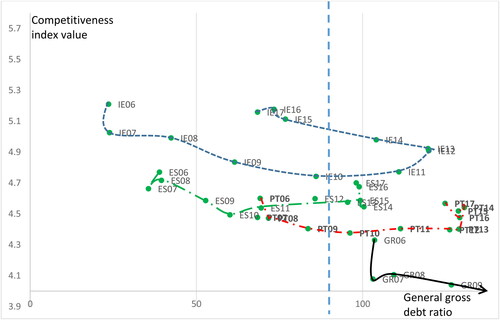
shows that the sovereign debt ratio of Ireland was severely affected by the international financial crisis which, finally, led to its assistance programme. However, the initial starting point was far better from what was observable in Greece and in Portugal. Ireland had a much lower debt ratio and a much better competitiveness index. Thus, to some extent the Irish crisis can be considered cyclical. In the cases of Portugal and Greece, the debt ratios were higher and the competitiveness was lower which tends to be the description of structural problems that require relevant actions to boost the competitiveness of the countries to support sustained growth in the GDP. Spain was also severely affected but managed to keep the gross debt ratio at a lower level.
5. Conclusions and contributions for the competitiveness of Portugal
Twenty-five years after the Porter Report on the competitiveness of the Portuguese economy, the challenges facing the Portuguese economy clearly have significantly changed. There were important developments in several areas, such as technology and the European integration process, that altered the context for companies and institutions. In this period, there were also contributions to enhance Michael Porter’s approach on the competitiveness of nations and regions. The creation of wealth, nevertheless, continues to be based on competitiveness and this, in turn, depends on productivity and innovation, and clusters continue to be important for productivity and innovation. Furthermore, besides supporting the existing clusters, the development of new ones is important.
There are new challenges for companies, including the emergence of SCPs. However, besides companies, countries and regions need to create the conditions to take advantage of the new opportunities. The investments in technological infrastructures associated with SCPs may constitute a barrier for many companies (due their limitations in financial resources and the access to financing), but the shared value perspective may enable the development of new and promising approaches that do not depend mainly on financial capacity.
The Portuguese economy is heavily conditioned by the burden of sovereign debt that has challenged its fiscal policy. As a consequence, the country has postponed projects to enhance competitiveness, and domestic demand is constrained by taxes and lower government expenditure. Despite some relief in recent years that comes from a combination of several factors such as low interest rates, the fact is that Portugal, like other EU countries, presents a problematic sovereign debt ratio which will be, in an unknown scale, also affected by the Covid-19 pandemic situation.
The 2007–2008 international financial crisis ultimately contributed to sovereign debt crises in Greece, Ireland, and Portugal that required the intervention of the European Commission, the European Central Bank, and the International Monetary Fund. In this paper we focus on the importance of competitiveness and verify that there is a group of EU countries, including the three above, that simultaneously had high increases in their sovereign debt ratios and decreases in their competitiveness which subsisted even during the recovery. Portugal was unable to strengthen its competitiveness in the early 1990s to achieve the growth which, as our estimates show, would have prevented its sovereign debt crisis. However, the competitiveness problem should be analysed in a broader perspective and interconnected with the competitiveness policy in Europe.
The framework developed by Michael Porter in the early 90 s is based on productivity and innovation to create wealth and was refined by posterior discussion and clarifications. Based on this refined framework, the importance of the ‘particular circumstances’ became clear and the high sovereign debt ratios seem to be one of those circumstances. Our analysis, in line with previous research, supports that, at least for very high levels of sovereign debt ratios, the combination with competitiveness decreases may not be negligible and thus requires specific attention. Furthermore, the long-term economic and social effects of lower investments and expenses in critical areas such as education or health care services are still unknown.
Portugal benefited from Michael Porter’s contribution on the competitiveness of the country. One of the most emblematic recommendations focused on clusters (Automotive, Footwear, Textiles, Wood Products, Tourism, and Wine) that have developed over the years. However, the country’s evolution has been below expectations which can be explained, to some extent, by the diminishing returns to specialization that were identified by previous research. This evolution should not discourage the effort on the continuous development of clusters, and the existing clusters should be complemented with new ones based on unexplored assets or spillover effects. The new opportunities for and challenges to competitiveness based on SCPs and augmented reality that change the context of firms’ activities mean new boundaries for existing industries, new industries, and ultimately having data as a source of competitive advantage. A new competitiveness analysis for Portugal and subsequent recommendations would be considerably different, especially because some of the opportunities related to SCPs incur higher upfront costs which may be unaffordable for many Portuguese companies that are characterized by high leverage. However, this handicap may be addressed through the adoption of a shared value perspective to take advantage of new opportunities for innovation even when resources are limited.
Portugal is often presented as a small country with limited endowments. Recent research, however, highlights that the size of the country is not an obstacle to competitiveness while the location vis-à-vis maritime transport positively affects productivity and adds good predictions for the competitiveness of the Portuguese economy. Nevertheless, as we argue in this paper, for Portugal and other countries struggling with high sovereign debts and low competitiveness, clusters continue to have an important role fostering productivity and innovation and not only the existing ones need support as new ones should be developed. The impact of the sovereign debt ratio in competitiveness shouldn’t, however, be neglected. As for companies, according to our analysis, these need to pay attention to the challenges associated with the emergence of SCPs and augmented reality and acknowledge that the scarcity of financial resources may be a handicap, although there are alternatives for companies facing obstacles in obtaining the necessary financial resources.
6. Limitations and future research
In this paper we have addressed the sovereign debt to GDP ratio but did not analyse how and why debt was created and which part was directed at the improvement of the conditions that lead to the future competitiveness of the country. We would like to see to what extent the investments made implied improvements in the different indicators considered in the competitiveness index.
To expand our analysis, in this paper based only on some secondary data, we would need to gather specific data on the existing clusters and to identify what would be the priority clusters. This new analysis would certainly benefit from the enhanced theoretical framework on clusters.
Another topic for future research relates with environmental sustainability. This is increasingly important for companies due to stricter regulations and pressure by consumers and other stakeholders. In this context, SCPs may contribute to reduce waste but the location of activities may need to be reassessed due to the environmental effects of transport activities (which may also be analysed in a shared value perspective).
Disclosure statement
No potential conflict of interest was reported by the author(s).
Additional information
Funding
Notes
1 Ketels (2013) presents an overview of the main criticisms and contributions following Michael Porter’s work on competitiveness and clusters.
2 Regarding general government gross debt, Eurostat (Citation2018a) states that ‘the indicator is defined (in the Maastricht Treaty) as consolidated general government gross debt at nominal (face) value, outstanding at the end of the year in the following categories of government liabilities (as defined in ESA 2010): currency and deposits, debt securities and loans. The general government sector comprises the subsectors: central government, state government, local government and social security funds’.
3 For more information on the global competitiveness index methodology and evolution see, for example, Schwab and Porter (Citation2008). Several other authors also use the global competitiveness index (e.g., Paraušić et al., Citation2014; Rusu & Roman, Citation2018). In this index, 1 stands for a low competitiveness score and 7 stands for a high competitiveness score.
4 The extent of the differences among the countries was high. According to Eurostat (Citation2018b), in 2007 the GDP per capita was 22,000 €; 40,300 €; and 16.800 € and in 2016 was 17,100 €; 53,100 €; and 17.000 € respectively for Greece, Ireland, and Portugal.
References
- Abell, J. D. (1990). Twin deficits during the 1980s: An empirical investigation. Journal of Macroeconomics, 12(1), 81–96. https://doi.org/https://doi.org/10.1016/0164-0704(90)90057-H
- AMECO. (2018). Annual macro-economic database of the European Commission's Directorate General for Economic and Financial Affairs. Retrieved November 14, 2018, from https://ec.europa.eu/economy_finance/ameco/user/serie/SelectSerie.cfm
- Baer, W., Dias, D. A., & Duarte, J. B. (2013). The economy of Portugal and the European Union: From high growth prospects to the debt crisis. The Quarterly Review of Economics and Finance, 53(4), 345–352. https://doi.org/https://doi.org/10.1016/j.qref.2012.06.002
- Cecchetti, S. G., Mohanty, M., & Zampolli, F. (2011). Achieving growth amid fiscal imbalances: The real effects of debt. In Economic Symposium Conference Proceedings (Vol. 352, pp. 145–196). Federal Reserve Bank of Kansas City.
- De Grauwe, P. (2012). The governance of a fragile Eurozone. Australian Economic Review, 45(3), 255–268. https://doi.org/https://doi.org/10.1111/j.1467-8462.2012.00691.x
- Delgado, M., Ketels, C., Porter, M. E., & Stern, S. (2012). The determinants of national competitiveness (Working Paper No. 18249). NBER.
- Delgado, M., Porter, M. E., & Stern, S. (2014). Clusters, convergence, and economic performance. Research Policy, 43(10), 1785–1799. https://doi.org/https://doi.org/10.1016/j.respol.2014.05.007
- Eurostat. (2018a). General government gross debt - annual data. Retrieved November 29, 2018, from https://ec.europa.eu/eurostat/tgm/table.do?tab=table&init=1&plugin=1&language=en&pcode=teina225
- Eurostat. (2018b). Real GDP per capita. Retrieved January 13, 2019, from https://ec.europa.eu/eurostat/tgm/table.do?tab=table&init=1&language=en&pcode=sdg_08_10&plugin=1
- Giuliani, E., Balland, P. A., & Matta, A. (2019). Straining but not thriving: understanding network dynamics in underperforming industrial clusters. Journal of Economic Geography, 19(1), 147–172. https://doi.org/https://doi.org/10.1093/jeg/lbx046
- Gonçalves, V. d., Ribeiro Mendes, F., Sardinha, I. D., & Rodrigues, R. (2015). Twenty years after the Porter Report for Portugal. Competitiveness Review, 25(5), 540–554. https://doi.org/https://doi.org/10.1108/CR-06-2015-0059
- Hanafi, M., Wibisono, D., Mangkusubroto, K., Siallagan, M., & Badriyah, M. J. (2017). Modelling competitive advantage of nation: a literature review. Competitiveness Review, 27(4), 335–365. https://doi.org/https://doi.org/10.1108/CR-06-2016-0031
- Hervas-Oliver, J. L., Lleo, M., & Cervello, R. (2017). The dynamics of cluster entrepreneurship: Knowledge legacy from parents or agglomeration effects? The case of the Castellon ceramic tile district. Research Policy, 46(1), 73–92. https://doi.org/https://doi.org/10.1016/j.respol.2016.10.006
- Kalou, S., & Paleologou, S. M. (2012). The twin deficits hypothesis: Revisiting an EMU country. Journal of Policy Modeling, 34(2), 230–241. https://doi.org/https://doi.org/10.1016/j.jpolmod.2011.06.002
- Ketels, C. (2013). Recent research on competitiveness and clusters: What are the implications for regional policy?. Cambridge Journal of Regions, Economy and Society, 6(2), 269–284. https://doi.org/https://doi.org/10.1093/cjres/rst008
- Ketels, C., & Keller, M. K. (2015). 25 years of "the competitive advantage of nations”. Competitiveness Review, 25(5), 1–4. https://doi.org/https://doi.org/10.1108/CR-08-2015-0073
- Ketels, C., & Porter, M. E. (2018). Towards a new approach for upgrading Europe’s competitiveness (Working Paper No. 19–033). Harvard Business School.
- Kourtellos, A., Stengos, T., & Tan, C. M. (2013). The effect of public debt on growth in multiple regimes. Journal of Macroeconomics, 38, 35–43. https://doi.org/https://doi.org/10.1016/j.jmacro.2013.08.023
- Miller, S. M., & Russek, F. S. (1989). Are the twin deficits really related? Contemporary Economic Policy, 7(4), 91–115. https://doi.org/https://doi.org/10.1111/j.1465-7287.1989.tb00577.x
- Paraušić, V., Cvijanović, D., Mihailović, B., & Veljković, K. (2014). Correlation between the state of cluster development and national competitiveness in the Global Competitiveness Report of the World Economic Forum 2012–2013. Economic Research-Ekonomska Istraživanja, 27(1), 662–672. https://doi.org/https://doi.org/10.1080/1331677X.2014.974917
- Parc, J. (2018). Why has Japan's economy been staggering? A competitiveness perspective. Competitiveness Review, 28(4), 433–450. https://doi.org/https://doi.org/10.1108/CR-01-2017-0005
- Porter, M. E. (1990a). The competitive advantage of nations. Harvard Business Review, 68(2), 73–91.
- Porter, M. E. (1990b). The competitive advantage of nations. The Free Press.
- Porter, M. E. (1998). The competitive advantage of nations. 2nd ed. The Free Press.
- Porter, M. E. (2008). On competition. Harvard Business School Publishing Corporation.
- Porter, M. E., & Heppelmann, J. E. (2014). How smart, connected products are transforming competition. Harvard Business Review, 92(11), 64–88.
- Porter, M. E., & Heppelmann, J. E. (2015). How smart, connected products are transforming companies. Harvard Business Review, 93(10), 96–114.
- Porter, M. E., & Heppelmann, J. E. (2017). Why every organization needs an augmented reality strategy. Harvard Business Review, 95(6), 46–57.
- Porter, M. E., & Kramer, M. R. (2011). Creating shared value. Harvard Business Review, 89(1–2), 62–77.
- Reinhart, C. M., & Rogoff, K. S. (2010). Growth in a time of debt. American Economic Review, 100(2), 573–578. https://doi.org/https://doi.org/10.1257/aer.100.2.573
- Reis, R. (2013). The Portuguese slump and crash and the Euro crisis (Working Paper No. 9288). NBER.
- Rusu, V., & Roman, A. (2018). An empirical analysis of factors affecting competitiveness of C.E.E. countries. Economic Research-Ekonomska Istraživanja, 31(1), 2044–2059. https://doi.org/https://doi.org/10.1080/1331677X.2018.1480969
- Schwab, K., & Porter, M. E. (2008). The global competitiveness report 2008–2009. World Economic Forum.
- World Economic Forum. (2018). The global competitiveness index dataset 2007–2017. World Economic Forum.
Appendix
Evolution of the general government gross debt (presented as percentage of GDP) and the global competitiveness index value from 2006 to 2017
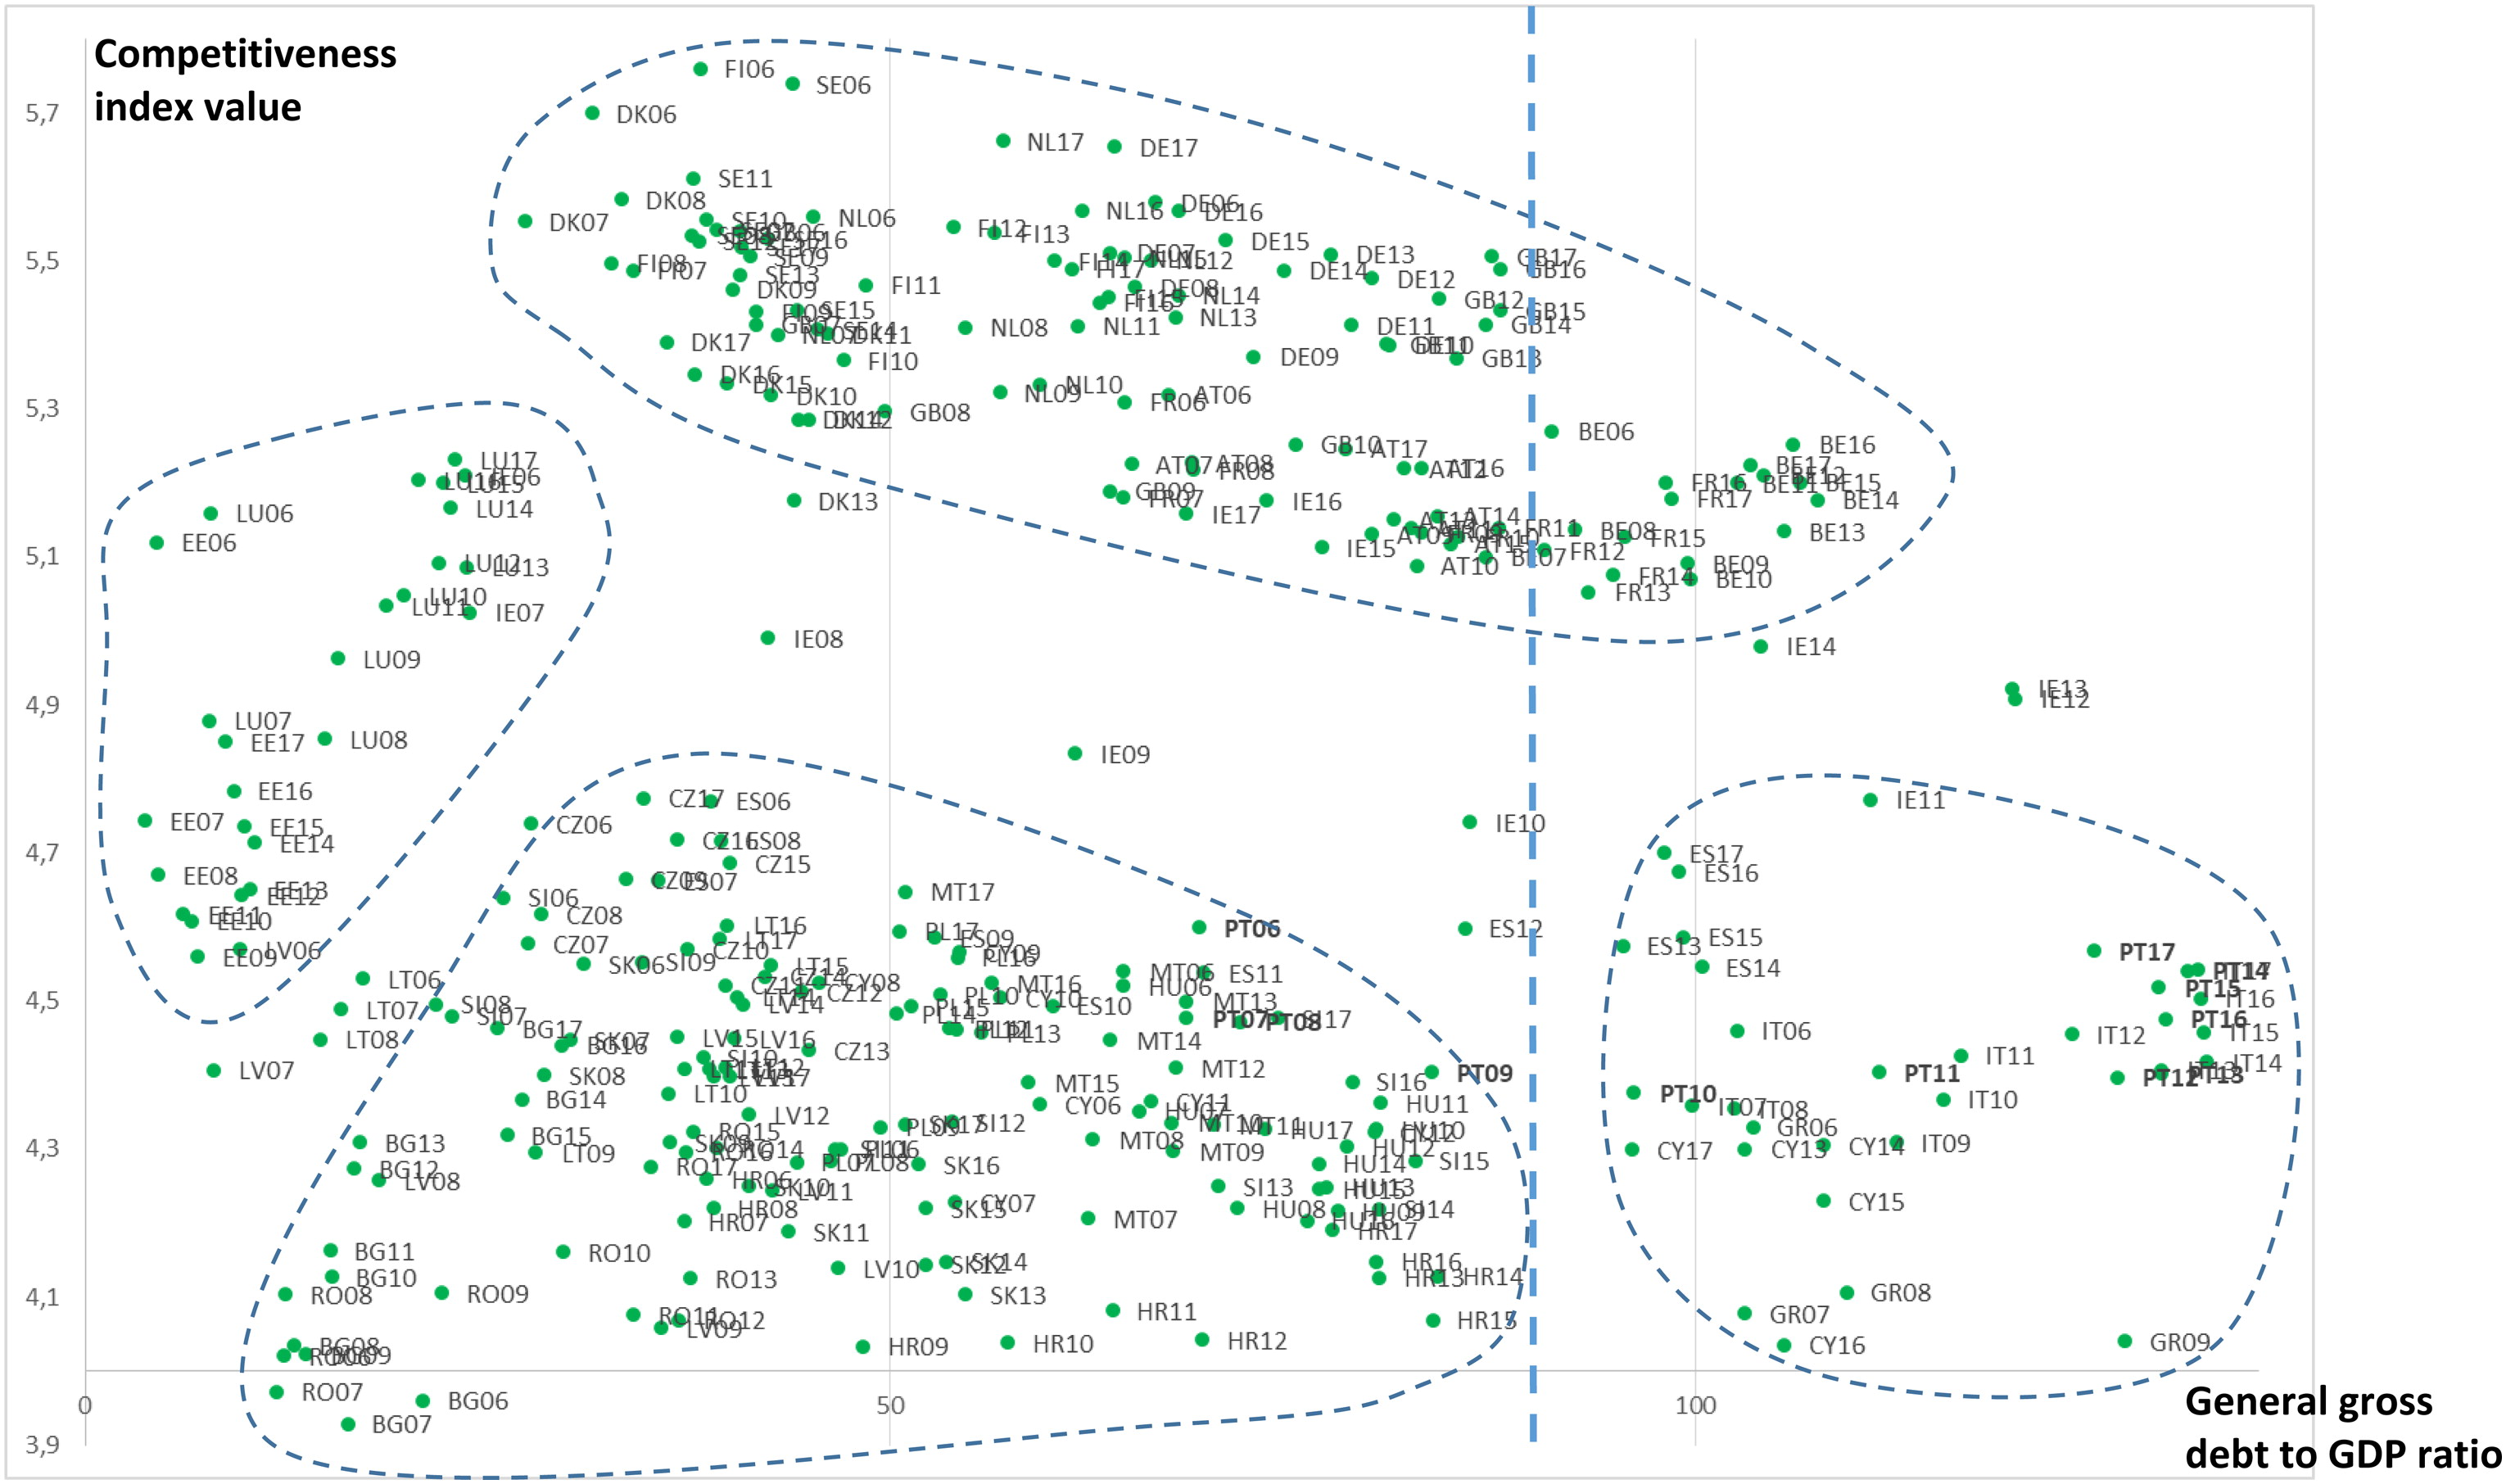
Notes: Since 2010, Greece’s general government gross debt ratio has been over 145% and for this reason, only presents data for Greece from 2006 to 2009. The competitiveness index value is a composite measure ranging from 1 (low competitiveness) to 7 (high competitiveness) (World Economic Forum, Citation2018). The vertical dashed line refers to the 90% threshold for the debt ratio, above which growth is lower (Reinhart & Rogoff, Citation2010). The highlighted (bold) points refer to Portugal. The names of the countries are abbreviated: Belgium (BE), Bulgaria (BG), Czechia (CZ), Denmark (DK), Germany (DE), Estonia (EE), Ireland (IE), Greece (GR), Spain (ES), France (FR), Croatia (HR), Italy (IT), Cyprus (CY), Latvia (LV), Lithuania (LT), Luxembourg (LU), Hungary (HU), Malta (MT), Netherlands (NL), Austria (AT), Poland (PL), Portugal (PT), Romania (RO), Slovenia (SI), Slovakia (SK), Finland (FI), Sweden (SE), and United Kingdom (GB).Data sources: Eurostat and World Economic Forum.