
 ?Mathematical formulae have been encoded as MathML and are displayed in this HTML version using MathJax in order to improve their display. Uncheck the box to turn MathJax off. This feature requires Javascript. Click on a formula to zoom.
Abstract
This study uses an evolutionary perspective to examine the relationship between profit and growth. The evolutionary perspective argues that firm growth refers to the diffusion of fitter routines of the firm. In order to apply this evolutionary view, we investigate franchise data by using various regression techniques such as pooled OLS, fixed/random effects, dynamic GMM, and split-sample regressions. Overall, the empirical results support the positive relationship. Some more findings are: (i) the positive relationship is pronounced for the traditional measure rather than the “evolutionary” measure; (ii) the dynamic GMM regressions show that the positive effect of profit on growth is found only when using the evolutionary measure, which implies that the idea of evolutionary analysis fits well with the dynamic model. Also, the positive relationship is pronounced in small and young groups when using the evolutionary measure.
1. Introduction
This study empirically examines the relationship between firm profit and growth from an evolutionary perspective. Interest in applying evolutionary ideas to economic phenomena such as firms’ strategies has increased in recent years (Ngo & McCann, Citation2019; Witt, Citation2008). Evolutionary perspective would be beneficial to understand how firm behave since economies are always changing. In order to apply an evolutionary perspective, we use panel data set on around 2000 franchised retail stores belonging to 27 chains in South Korea (hereafter called Korea). Franchise data are appropriate for evolutionary analysis, which will be discussed below.
What is the relationship between profit and growth of the firm? Theoretical discussions on this issue lead to the opposite conclusions (Lee, Citation2014, pp.2–3). Some argue for a negative relationship, while others claim the opposite. First, there are reasons to expect a negative relationship between firm profit and growth. Profit maximization in standard microeconomics textbooks is mostly discussed as the sole objective of the firm. In contrast, ‘managerial theories’ claim that managerial objectives tend to be sales revenue maximization (Baumol, Citation1959) or balanced rate of growth (Marris, Citation1964). To the extent that it is not easy for managers to simultaneously achieve both goals of profit and growth, they are likely to be oriented toward either profit or growth, but not both. Accordingly, a trade-off exists between profit and growth, which can lead us to expect a negative relationship between them. Second, profitability and growth may be mutually supportive. It has been claimed that growth can provide opportunities to foster profitability, which is often based on the theories of scale economies, first mover advantages, network externalities, and experience curve effects (Steffens et al., Citation2009). In the face of these conflicting hypotheses, it is left to empirical analysis to determine the actual outcome.
Several empirical studies examined the mutual effect of profit and growth by investigating firm-level data, summarized in . Similarly to the opposite theoretical predictions, the existing empirical studies show mixed results. Some studies support the negative relationship between profit and growth, while others show the positive relationship. The mixed results might reflect the competing theoretical models or the variety of the methods used. Since prior work is inconclusive, new perspectives or more robust methods are needed to examine the relationship. This study contributes to the extant literature in that it analyzes the issue of firms’ behavior and decisions from an evolutionary perspective by using a sample of franchise firms, which provides a very useful framework for understanding firm growth.
Table 1. Previous studies of growth and profit.
2. An evolutionary perspective
Regarding the issue of profit and growth, evolutionary views argue that profits can lead to growth. The evolutionary principle of “growth of the fitter” (Coad, Citation2007) suggests that profitable firms grow. Since profit realization is the criterion according to which superior firms are selected, those who realize positive profits grow (Alchian, Citation1950). Economic selection works in the real world when failing firms are eliminated through bankruptcy and successful firms are copied by other firms.
A series of empirical studies conducted by Alex Coad and his colleagues examined the relationship between profit and growth from the perspective of evolutionary economics, but their results did not confirm the positive effect of profits on growth. Coad (Citation2007) uses panel data of French manufacturing firms to find that profitability is not the driver of firm growth and that past growth had a positive influence on the subsequent profit rate. Coad (Citation2010) reports that growth of both employment and sales is followed by a higher growth of profits, but growth of profits was not followed by growth of employment and sales. Coad et al. (Citation2011) investigate a panel of Italian firms to find that sales growth and employment growth are associated with subsequent growth of profits.
The current study complements the previous work of the evolutionary economists by considering a more detailed evolutionary picture. The previous empirical studies use the size of each firm as a proxy for growth, but the concept of growth in terms of evolutionary theories needs an alternative proxy to better represent evolutionary growth.
According to Nelson and Winter (Citation1982), evolutionary economics explains the economic process of natural selection “by which traits of organizations, including those traits underlying the ability to produce output and make profits, are transmitted through time”(Nelson & Winter, Citation1982, p.9). These traits are ‘routines’, which” include characteristics of firms that range from well-specified technical routines for producing things, through procedures for hiring and firing, ordering new inventory, or stepping up production of items in high demand, to policies regarding investment, research and development (R&D), or advertising, and business strategies about product diversification and overseas investment” and “are selectable in the sense that organisms with certain routines may do better than others, and, if so, their relative importance in the population (industry) is augmented over time”(Nelson & Winter, Citation1982, p.14). The evolutionary view focuses on the patterns of differential survival and growth in a population, which are related to the selection of some of the relatively fitter characteristics (i.e., fitter ‘routines’) and the inheritance of the characteristics through time. The competitive selection process makes fitter routines prosper relative to others (Hodgson, Citation2003, pp.356–357). Hence, the ‘growth’ in evolutionary economics refers to the spread of fitter routines in an industry, which is shown by replicator dynamics in an evolutionary game. The replicator dynamics show that the fraction of the players of a certain type will increase as time passes provided they perform better than the average; otherwise, it will decrease (for refined models, refer to London & Tohmé, Citation2019; Ai Zhang et al., Citation2007). A simple replicator dynamic equation is as below:
(1)
(1)
where pi is the proportion of firm i in its industry and πi is the performance of firm i. It indicates that better performing firms grow and underperforming firms shrink (Lee, Citation2014, p.3).
We examine firm growth in terms of the diffusion of fitter routines of the firm by investigating the panel data of franchise companies, which is the contribution of this paper to the empirical literature (for a survey of economic analyses of franchising, see Dnes, Citation1996). In franchise contracts, franchisors provide franchisees with brand names and various kinds of managerial assistance such as national advertising, training programs, standard operating manuals, ongoing advice, and so on. In addition, franchisors can control franchisees’ activities, such as pricing, advertising, and financing. In this sense, opening new outlets in franchise systems can lead to the spread of particular routines. Successful franchisors grow by increasing the number of outlets, which reflects the process of replication of successful routines. Thus, the number of franchise outlets are better measures of the ‘evolutionary growth’ than firm size. To our knowledge, this study is the first to examine the sample of franchise firms to test the hypothesis of profit and growth in evolutionary economics.
3. Data and variables
This study empirically examines the relationship between profit and growth by using insights from evolutionary economics. In order to do this, we analyze franchise growth since it reflects evolutionary processes. For the empirical analysis, this paper employs a panel data set of 27 franchise firms located in Seoul, South Korea during the period 2000–2017. An important advantage of using panel data is that it controls for unobservable factors that might be correlated with endogenous regressors (Lennox et al., Citation2012). The sample data are obtained from the database of Seoul Open Data Plaza (https://data.seoul.go.kr/), which provides Seoul’s information such as real-time bus operation schedules, subway schedules, non-smoking areas, locations of public Wi-Fi services, as well as information of franchise stores in Seoul.
In this study, the number of franchise stores (frnch) serves as a proxy for firm growth. Following the previous studies, the ratio of sales to assets (sales) is also included as an additional variable for firm growth. Since previous studies often use sales growth, our results can be compared with those of previous studies. For the variable of profit, we use the traditional measure of return on assets, the ratio of net income to assets (ninc).
In addition to the major variables of growth and profit, firms’ size, firms’ financial status, and macroeconomic fluctuations are employed in the empirical analysis as control variables. For firms’ size, the natural logarithm of total assets (asset) is used. Firm size is known to have effects on firm growth (Goddard et al., Citation2004), profitability(Amato & Wilder, Citation1985), and survival of franchisors (Perrigot & Cliquet, Citation2003; Shane & Foo, Citation1999). The ratio of debt to equity (dte) is included as a proxy for financial status. It is well known that access to finance affects firm growth and profitability by facilitating capital accumulation. Year dummies are included to account for macroeconomic fluctuations.
reports the summary statistics for the sample. The table shows the full sample as well as split samples. The full sample is divided into two groups by size and by age to conduct robust analysis, which is discussed below. In the table, large firms refer to firms with total average sales over the period under study of more than the median value and the average sales of small firms are less than the median value. We compute each firm’s average size over the sample period, rank the firms by the average size, and divide the firms into two groups, those with firm size above the median and those below the median. We also separate firms into old firms and young firms according to firm age measured by founding year. Old firms are defined as those firms founded before 1998, which is the median value, and young firms refer to those firms founded on or after 1998.
Table 2. Summary statistics.
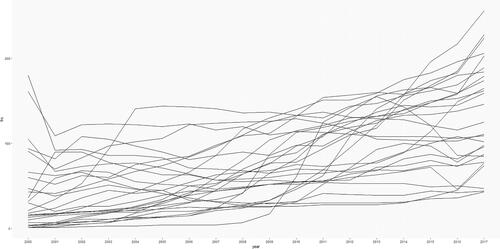
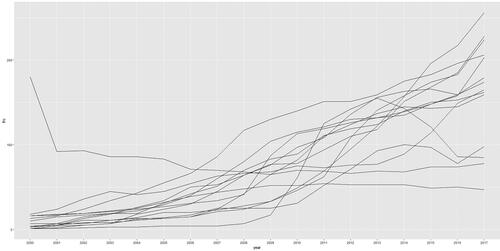
shows the trend of the number of outlets in each franchise chain. Each line in the figure refers to each franchisor. We can observe that the dispersion becomes larger as time goes by, though it is not remarkable.
Figure 1. Franchises by number of stores over time. Source: Authors.
The trends of the number of outlets for the split samples are also illustrated in . shows the time trend of the number of outlets of large franchises, and shows the time trend of the number of outlets of small franchises. The time trends seem to be more evenly distributed for large franchises than for small franchises, which, however, is not pronounced. shows the time trend of the number of outlets of old franchises, and shows the time trend of the number of outlets of young franchises. For old franchises, the trends are relatively stable and distributed evenly over the time period. In contrast, for young franchises, the trends exhibit herd behavior.
Figure 2. Large franchises by number of stores over time. Source: Authors.
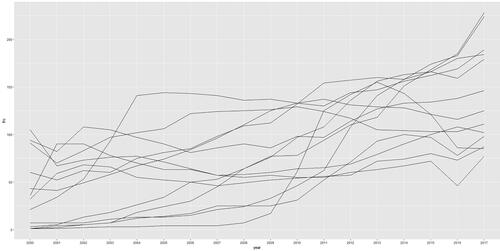
Figure 3. Small franchises by number of stores over time. Source: Authors.
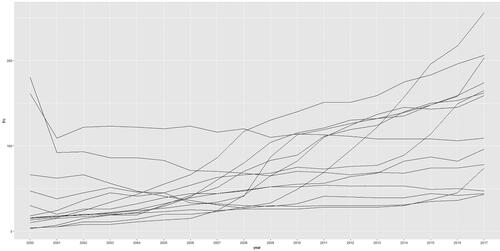
Figure 4. Old franchises by number of stores over time. Source: Authors.
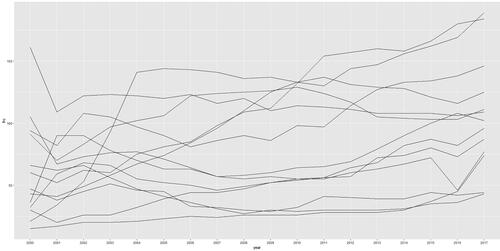
Figure 5. Young franchises by number of stores over time. Source: Authors.
4. Regression methods
In this empirical analysis, both static and dynamic regression models are applied to panel data. For the static analysis, the regression equations below are used:
(2)
(2)
(3)
(3)
where g refers to the growth variables, π to the profit variable, control to the control variables, i to the firm, t to time period, α and β to parameters, γ to time dummies, and ϵ to the error term.
Panel data can be investigated using pooled OLS, fixed-effects, and random-effects models. In order to compare the usefulness of the models, researchers perform statistical tests such as F test, LM test, and Hausman test. However, as discussed in most econometrics textbooks, the three models have their own strengths and weaknesses. Thus, we use all three estimation methods to provide the more detailed information on the results.
This study considers whether a nonlinear relationship exists between profit and growth. A nonlinear relationship might account for mixed empirical results in existing research. We conduct Ramsey’s RESET (regression equation specification error test) to determine whether nonlinear patterns exist between variables (Ramsey, Citation1969) and the test results support the possibility of a nonlinear relationship. Thus, in order to examine the possible nonlinear relationship, quadratic terms are also considered in the regression analysis:
(4)
(4)
(5)
(5)
where β1 indicates the overall linear trend in the relationship between profit and growth and β2 implies the direction of curvature. For example, an inverse U-shaped relationship can be confirmed by the observation that β1 is positive and β2 is negative.
For the dynamic analysis, the regression equations below are employed:
(6)
(6)
(7)
(7)
In the dynamic regression equations, a lagged dependent variable is included as one of the independent variables to capture dynamic effects such as persistence effects and feedback effects. However, since the lagged dependent variable is likely to be endogenous, the estimated coefficients would be biased and inconsistent. Thus, the dynamic equations are estimated by a generalized method of moments (GMM) method to address the endogeneity problem. The t − 2 and t − 3 lagged values of each dependent variable is used as a GMM instrument. More remote lags are not likely to be informative in practice (Bond & Meghir, Citation1994). The two often used techniques, difference GMM (Arellano & Bond, Citation1991) and system GMM (Blundell & Bond, Citation1998), are employed in the dynamic analysis. The Sargan test (Sargan) and the test for second-order autocorrelation of the residuals (AR(2)) are preformed to check the specification of the model and the validity of the instruments.
In addition to the full sample regression, we also consider the split-sample technique by dividing the sample firms into two groups based on firm size and firm age and performing the regressions in each of the groups. Shane and Foo (Citation1999) argue that firms need organizational routines to engage in business activities, and large or old firms are likely to have established routines. The moderating roles of firm size and firm age are relevant in this regard. Indeed, numerous studies consider firm size and firm age as determinants of business effectiveness and use them in empirical analysis (Lee, Citation2014, Citation2015). If the relationship between growth and profit is significantly different between groups, the difference indicates the pure relationship. Another benefit of this method is that, although individual estimates of the coefficients can be biased, the estimated difference in the coefficients between groups is unbiased because the possible bias is to be the same for the two groups (Hoshi et al., Citation1991, p.36).
5. Empirical results
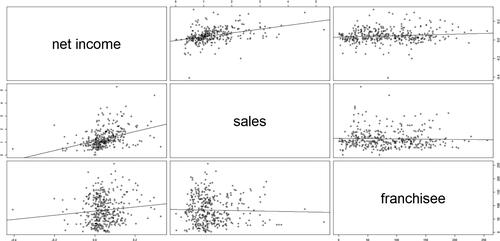
This section discusses the empirical results. As a preliminary step, the full sample is presented graphically in the form of scatterplots depicting the relationship between profit and growth (). The scatterplots indicate that the relationship between profit and growth seems to be positive. The relationship between the variables of net income and sales is strong, but the relationship between the variables of net income and franchise is very weak. That is to say, the relationship between profit and growth seems to be more pronounced for the traditional variables. When we use the evolutionary perspective, it might be hard to find the relationship between profit and growth.
Figure 6. Full-sample scatterplot matrix. Source: Authors.
shows the results of pooled regressions for the full sample. According to the results, the linear relationship between profit and growth is confirmed to be positive irrespective of the models used. The positive effect of profit on growth and the positive effect of growth on profit are both statistically significant across all the variables. However, the quadratic relationship is not supported by the quadratic regressions, which indicate that only linear terms are significant, while the square terms are insignificant. The insignificant results of the quadratic relationship are also observed for the other regression models, which are not reported for brevity.
Table 3. Full-sample pooled regression.
reports the results of fixed effects and random effects regressions for the full sample. The results indicate that the relationship between profit and growth is different across variables. When using the sales variable (sales) as a proxy for growth, the relationship is found to be positive, which is the same as the results of the pooled regressions above. In contrast, for the number of franchise stores (frnch), the regression results do not support the positive relationship: 3 out of 4 regressions provide insignificant coefficient estimates. It is consistent with the visual interpretation of the scatterplots discussed above.
Table 4. Full-sample panel regression.
summarizes the results of the dynamic GMM estimation for the full sample. We can observe only one significant result from this dynamic analysis: The effect of profit on the number of franchise stores is found to be significantly positive, while the other regressions do not show significant results for the relationship between profit and growth. This result is in contrast to the results presented above. For the static regression, the positive relationship between profit and growth is more obvious in the traditional setting, while, for the dynamic regression, the positive relationship exists only in the evolutionary framework. It might indicate the dynamic nature of the evolutionary process.
Table 5. Full-sample dynamic GMM regression.
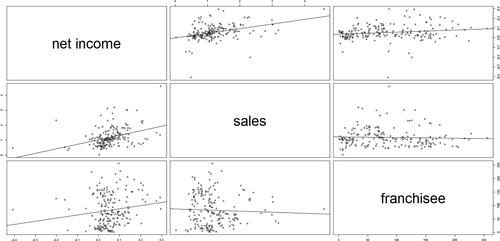
The results of the split sample analysis are presented here. Similarly to the full sample analysis, we examine the scatterplots. show the scatterplots for the split samples. The scatter plots for large franchises and for small franchises are shown in and 8, respectively. Comparing the two scatterplot matrices, we can observe a difference between them. For the large group, the relationship between profit and growth measured by the sales variable seems to be positive, while the relationship for the number of franchise stores seems to be neutral or even negative. In contrast, for the small group, the relationship between profit and growth appears to be positive for both cases (that is, the sales variable and the franchise variable). and show the scatter plots for old franchises and for young franchises, respectively. Similarly to the scatter plots for the large vs. small groups, there is a little difference between the scatterplots for the old vs. young groups. The scatter plots for the relationship between profit and growth represented by the sales variable indicates a clear positive relationship for both old and young groups. By contrast, the relationship measured by franchise stores seems to be neutral for the old group and positive for the young group. This can imply that the evolutionary framework is more likely to be applied in small and young groups. Since large and old groups are established and stable, the changing nature of firms is not likely to be captured for the groups.
Figure 7. Large franchises scatter plot matrix. Source: Authors.
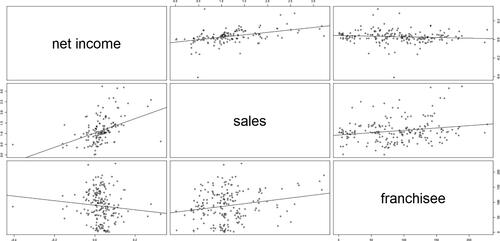
Figure 8. Small franchises scatter plot matrix. Source: Authors.
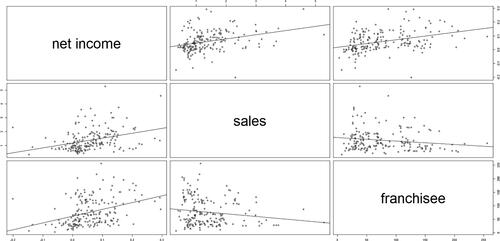
Figure 9. Old franchises scatter plot matrix. Source: Authors.
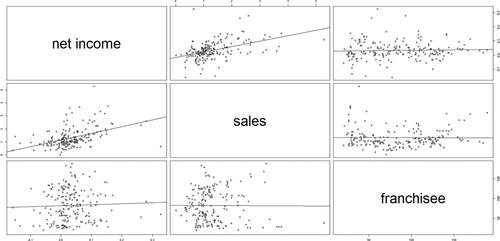
Figure 10. Young franchises scatter plot matrix. Source: Authors.
and present the results of the split sample regressions for firm size. The pooled regressions are shown by and the fixed effects regressions are shown by . We do not report the results of random effect regressions for simplicity since they are very similar to those of fixed effects regressions. Dynamic regressions for the split samples are not reported because there are some technical problems due to insufficient data. According to , there exists a difference between large firms and small firms. When using the sales variable as a proxy for growth, the regressions of large firms and small firms show similar results that the relationship between profit and growth is positive and statistically significant. In contrast, when using the number of franchise outlets, the regressions for large firms fail to provide significant estimates, while the regressions for small firms produce significantly positive estimates of profit and growth. This is consistent with the observations obtained from the scatterplots above. However, this difference between the models does not occur in the fixed effects regressions shown by . The fixed effects regressions show that the positive relationship is statistically significant when using the sales variable and insignificant when using the franchise variable irrespective of whether the sample is the large group or the small group. Once individual fixed effects are estimated, the difference between large and small groups disappears.
Table 6. Split-sample linear pooled regression: Size.
Table 7. Split-sample fixed effects regression: size.
and show the results of the split sample regressions for firm age. The pooled regressions summarized by confirm the positive relationship between profit and growth across models. All the coefficient estimates of profit and growth in the regressions are positive and statistically significant. By contrast, in the fixed effects regressions in , most coefficient estimates of profit and growth (6 out of 8) are not statistically significant in the fixed effects regressions. In sum, the split sample regressions for firm age do not have a clear implication.
Table 8. Split-sample linear pooled regression: Age.
Table 9. Split-sample fixed effects regression: Age.
6. Conclusion
Based on an evolutionary perspective, this study uses regression analysis to evaluate the relationship between profit and growth. According to the evolutionary perspective, firm growth refers to the diffusion of fitter routines of the firm. In order to apply this evolutionary view, we investigate franchise data by using various regression techniques such as pooled OLS, fixed/random effects, dynamic GMM, and split-sample regressions.
The empirical findings are: (i) the scatterplots and the fixed/random effects regressions for the full sample show that the positive relationship is pronounced for the traditional measure (the sales variable) rather than the “evolutionary” measure (the number of franchise outlets); (ii) The pooled OLS for the full sample support the positive relationship; (iii) the quadratic relationship is not found; (iv) the dynamic GMM regressions show that the positive effect of profit on growth is found only when using the evolutionary measure; (v) the scatterplots for the split samples indicate that the positive relationship is pronounced in small and young groups when using the evolutionary measure; (vi) the pooled OLS regressions indicate that the results using the traditional measure confirm the positive relationship across the groups, while the results using the evolutionary measure support the positive relationship only in the small groups; (vii) the fixed effects regressions show that the positive relationship is found only when using the traditional measure for the both large and small groups; and (viii) while the pooled OLS regressions support the positive relationship across models, the fixed effects regressions do not show significant results.
In sum, we can derive two implications from the findings of the present study for the relationship between profit and growth. First, overall, the empirical results support the positive relationship, which is supported by evolutionary analyses (Coad, Citation2007, Citation2010; Coad et al., Citation2011). Second, by using the franchise data, we can apply the evolutionary analysis to obtain different results than those reported by previous studies. In particular, the idea of evolutionary analysis fits well with the dynamic model as well as the small and young groups. Thus, the evolutionary interpretation of firm behavior would be valuable in improving economic policy-making since it provides an insight that cannot be achieved by a comparative and static analysis.
This is the first study to apply evolutionary analysis to the relationship between profit and growth by using franchise data. Thus, there are some limits to this study. Due to data availability, dynamic GMM methods cannot be applied to the split samples as discussed before. Also, the characteristics of franchise firms cannot be controlled sufficiently. We may be able to improve the quality of the analysis when more detailed data of the franchise firms and the distinguishing features of franchise contracts are available. This is left to future study.
Disclosure statement
No potential conflict of interest was reported by the authors.
References
- Ai Zhang, P., Yan Nie, P., Qiang Hu, D., & Yan Zou, F. (2007). The analysis of bi-level evolutionary graphs. BioSystems, 90 (3), 897–902. https://doi.org/https://doi.org/10.1016/j.biosystems.2007.05.008
- Alchian, A. A. (1950). Uncertainty, evolution, and economic theory. Journal of Political Economy, 58 (3), 211–221. https://doi.org/https://doi.org/10.1086/256940
- Amato, L., & Wilder, R. P. (1985). The effects of firm size on profit rates in U. S. manufacturing. Southern Economic Journal, 52 (1), 181–190. https://doi.org/https://doi.org/10.2307/1058913
- Arellano, M., & Bond, S. (1991). Some tests of specification for panel data: Monte Carlo evidence and an application to employment equations. The Review of Economic Studies, 58 (2), 277–297. https://doi.org/https://doi.org/10.2307/2297968
- Baumol, W. J. (1959). Business behavior, value and growth. Macmillan.
- Blundell, R., & Bond, S. (1998). Initial conditions and moment restrictions in dynamic panel data models. Journal of Econometrics, 87 (1), 115–143. https://doi.org/https://doi.org/10.1016/S0304-4076(98)00009-8
- Bond, S., & Meghir, C. (1994). Dynamic investment models and the firm’s financial policy. The Review of Economic Studies, 61 (2), 197–222. https://doi.org/https://doi.org/10.2307/2297978
- Coad, A. (2007). Testing the principle of ‘growth of the fitter’: The relationship between profits and firm growth. Structural Change and Economic Dynamics, 18 (3), 370–386. https://doi.org/https://doi.org/10.1016/j.strueco.2007.05.001
- Coad, A. (2010). Exploring the processes of firm growth: Evidence from a vector auto-regression. Industrial and Corporate Change, 19 (6), 1677–1703. https://doi.org/https://doi.org/10.1093/icc/dtq018
- Coad, A., Rao, R., & Tamagn, F. (2011). Growth processes of italian manufacturing firms. Structural Change and Economic Dynamics, 22 (1), 54–70. https://doi.org/https://doi.org/10.1016/j.strueco.2010.09.001
- Cowling, M. (2004). The growth-profit nexus. Small Business Economics, 22 (1), 1–9. https://doi.org/https://doi.org/10.1023/B:SBEJ.0000011568.42714.c9
- Dnes, A. W. (1996). The economic analysis of franchise contracts. Journal of Institutional and Theoretical Economics, 152 (2), 297–324.
- Goddard, J., Molyneux, P., & Wilson, J. O. S. (2004). Dynamics of growth and profitability in banking. Journal of Money, Credit, and Banking, 36 (6), 1069–1090. https://doi.org/https://doi.org/10.1353/mcb.2005.0015
- Hodgson, G. M. (2003). The mystery of the routine: The darwinian destiny of an evolutionary theory of economic change. Revue Économique, 54 (2), 355–384. https://doi.org/https://doi.org/10.3917/reco.542.0355
- Hoshi, T., Kashyap, A., & Scharfstein, D. (1991). Corporate structure, liquidity, and investment: Evidence from Japanese industrial groups. The Quarterly Journal of Economics, 106 (1), 33–60. https://doi.org/https://doi.org/10.2307/2937905
- Jang, S., & Park, K. (2011). Inter-relationship between firm growth and profitability. International Journal of Hospitality Management, 30 (4), 1027–1035. https://doi.org/https://doi.org/10.1016/j.ijhm.2011.03.009
- Lee, S. (2014). The relationship between growth and profit: Evidence from firm-level panel data. Structural Change and Economic Dynamics, 28, 1–11. https://doi.org/https://doi.org/10.1016/j.strueco.2013.08.002
- Lee, S. (2015). Slack and innovation: Investigating the relationship in Korea. Journal of Business Research, 68 (9), 1895–1905. https://doi.org/https://doi.org/10.1016/j.jbusres.2014.12.009
- Lee, S. (2018). Growth, profits, and R&D investment. Economic Research, 31 (1), 607–625.
- Lennox, C. S., Francis, J. R., & Wang, Z. (2012). Selection models in accounting research. The Accounting Review, 87 (2), 589–616. https://doi.org/https://doi.org/10.2308/accr-10195
- London, S., & Tohmé, F. (2019). Economic evolution and uncertainty: Transitions and structural changes. Journal of Dynamics & Games, 6 (2), 149–158. https://doi.org/https://doi.org/10.3934/jdg.2019011
- Marris, R. (1964). The economic theory of ‘managerial’ capitalism. MacMillan.
- Nelson, R. R., & Winter, S. G. (1982). An evolutionary theory of economic change. Belknap Press of Harvard University Press.
- Ngo, C. N., & McCann, C. R. (2019). Rethinking rent seeking for technological change and development. Journal of Evolutionary Economics, 29 (2), 721–740. https://doi.org/https://doi.org/10.1007/s00191-018-0591-3
- Perrigot, R., & Cliquet, G. (2003). Survival analysis along a hotel chain classification in France. Influence of network managerial form and nationality on the fall in the classification. In D. Welsh & I. Alon (Eds.), International franchising in developed markets: Western and Northern Europe. CHH Publishing.
- Ramsey, J. B. (1969). Tests for specification errors in classical linear least-squares regression analysis. Journal of the Royal Statistical Society: Series B (Methodological), 31 (2), 350–371. https://doi.org/https://doi.org/10.1111/j.2517-6161.1969.tb00796.x
- Shane, S., & Foo, M.-D. (1999). New firm survival: Institutional explanations for new franchisor mortality. Management Science, 45 (2), 142–159. https://doi.org/https://doi.org/10.1287/mnsc.45.2.142
- Steffens, P. R., Davidsson, P., & Fitzsimmons, J. R. (2009). Performance configurations over time: implications for growth and profit oriented strategies. Entrepreneurship Theory and Practice, 33 (1), 125–148. https://doi.org/https://doi.org/10.1111/j.1540-6520.2008.00283.x
- Witt, U. (2008). What is specific about evolutionary economics. Journal of Evolutionary Economics, 18 (5), 547–575. https://doi.org/https://doi.org/10.1007/s00191-008-0107-7
- Yoo, S., & Kim, J. (2015). The dynamic relationship between grwoth and profitability under long-term recession: The case of Korean construction companies. Sustainability, 7(12), 15982–15998. https://doi.org/https://doi.org/10.3390/su71215796