
 ?Mathematical formulae have been encoded as MathML and are displayed in this HTML version using MathJax in order to improve their display. Uncheck the box to turn MathJax off. This feature requires Javascript. Click on a formula to zoom.
Abstract
A system of 36 regional-level indicators is selected to create a new index measuring a location’s attractiveness for business development (the LA-index), on the criteria of intelligence, networking and infrastructure, sustainability, digitalisation, learning, agility, innovativeness and knowledge. Business establishment is defined by nine indicators. Overall, the research data include 5,170 observations. The methodology presented is suitable for assessing the attractiveness of any region if the necessary data are available. We use correlation analysis and the Granger causality test to analyse the impact of business attractiveness on the establishment of new businesses. The main findings reveal that attractiveness for business development has a positive impact on the establishment of new businesses, but the determinants and time lags of this impact vary depending on the level of economic development of the region. The paper contributes to the regional economic development literature by exploring the concept of a location’s attractiveness using the smartness approach, and by discovering the time lags of the impact of this on the establishment of new businesses. The paper provides original empirical evidence, which helps policy makers to develop more accurate strategies and decision-making process based on smartness determinants and delayed effect (impact over time).
1. Introduction
The last decade has witnessed intensified competition among regions for investment, business projects, start-ups, individual entrepreneurs, etc. Certain prerequisites must be met in a host region if it is to attract business and investment inflow and convert the potential benefits into positive spill-over (Jurčić et al., Citation2020).
There is a close connection between regional factors and the benefits resulting from those factors. Location factors influence place selection, which may be more or less beneficial (Strzelczyk, Citation2015). Many studies have already highlighted the fact that countries that are attractive for business development (Godlewska-Majkowska & Komor, Citation2017; Strzelczyk, Citation2015) and for governance infrastructure (Younsi & Bechtini, Citation2019) are likely to attract more businesses and foreign direct investment. However, a policy of enhancing the business climate may be productive in some regions but not in others (Chin, Citation2020). Foreign investments have become increasingly vulnerable to the quality of institutions, as the motive for foreign investment has shifted from seeking markets and resources to seeking greater efficiency (Dunning, Citation2003). Deindustrialisation of the economy also leads to many changes in market systems (Budzyńska, Citation2016). However, what is less known and still needs in-depth investigation is how attractiveness for business development influences the indicators for the establishment of new businesses in different regions of the same country. An understanding of these variations in outcomes is key if planners and policymakers are to implement strategies that stimulate economic growth. So far, efficiency analysis has mostly been done at the national level. Theoretical and empirical research at the regional level (the NUTS level 3) in any one country is scant. It is important to point out that the overall business climate, including improvements in policies, laws, and regulations related to entrepreneurship and investment, can change over time, and theories need to be re-examined (Eicher et al., Citation2012).
Recently, the smartness approach has been developed more widely under the leadership of business practitioners and policymakers (e.g. Europe, 2020; Horizon, 2020; smart specialisation strategies). Smart specialisation is one example of the way in which smart-orientated innovation policy seeks to increase the development of European countries (Krammer, Citation2017). So far, many different pieces of research related to smartness have been published across the world, quite often emphasising innovation-driven growth and digitalisation (Foray et al., Citation2011; Martin et al., Citation2018) as well as soft abilities, such as entrepreneurial discovery (Vinod Kumar & Dahiya, Citation2017), managerial discretion and networking (Evans, Citation2019). Recently, the smartness approach has been used for the intelligent management of man-made environments (Jucevicius & Juceviciene, Citation2015). The smartness approach is basic for improving governance and seeking economic efficiency (Caragliu et al., Citation2011), for sustainable development (Gazzola et al., Citation2019; Martin et al., Citation2018; Kita & Šimberová, Citation2018), for competitiveness (Vinod Kumar & Dahiya, Citation2017) and for increasing investment attractiveness (Snieska et al., Citation2019). Despite the growing interest in the smartness approach, there is a lack of research combining it with the concept of attractiveness for business development. Therefore, this research does not analyse the usual infrastructure, economic, or institutional frameworks, but rather focuses on smartness determinants, such as intelligence, knowledge, agility, learning, networking, digitalisation, environment and sustainability. The analysis of a location’s attractiveness for business development using the smartness approach might ensure that this analysis can be used over time and during economic challenges.
Taking into consideration the given context, the purpose of the article is to integrate the smartness approach into the concept of a location’s attractiveness for business development, and evaluate the impact of this attractiveness on indicators for the establishment of a new business in NUTS level 3 regions of an advanced, small, open economy country.
The research methods include: a systematic, comparative and logical scientific literature analysis based on the methods of comparison, classification, systematisation and generalisation; secondary data analysis; and index, correlation and Granger causality tests.
The research employs panel data for socio-economic indicators of ten NUTS level 3 regions of an advanced, small, open economy, namely Lithuania, for 2007–2017. The LA-index is constructed from 36 characterising indicators, and new business establishment is defined by nine indicators. Overall, the research dataset includes 5,170 observations.
This paper makes several important contributions. First, it contributes to the regional economic development literature (Chin, Citation2020; Capello & Lenzi, Citation2018; Gazzola et al., Citation2019; Machado Junior, Nassif, Ribeiro, & Bazanni, 2018; Martin et al., Citation2018; Godlewska-Majkowska, Citation2018; Dubé et al., Citation2016; Strzelczyk, Citation2015) by exploring the concept of the attractiveness of a location for business development using the smartness approach, and by discovering the time lag of the impact of this attractiveness on the establishment of a new business. Secondly, the focus is placed on NUTS level 3 regions because attractiveness has been explored more commonly at country level. The methodology presented in this article has implications for territorial cohesion policies, and employment, labour market, and property development policies at a regional level. The paper provides original empirical evidence, which helps policy makers to develop more accurate strategies and decision-making process based on smartness determinants and delayed effect (impact over time).
The paper is organised as follows. The first section introduces the concept of attractiveness for business development, the impact of attractiveness on business development and economic growth, and the smartness approach. Section 3 discusses the methodology used for the assessment of the impact of a location’s attractiveness for business development on certain business establishment indicators, with indicators being defined for the LA-index and the establishment of new businesses. The final section introduces the results of the empirical research and initiates a scientific discussion. At the end of the article, conclusions, limitations and directions for future research are submitted.
2. Theoretical background
The concept of attractiveness for business development is a research area that is among the most difficult to define, as it combines different interrelated aspects of favourable conditions for doing business, investment, living, working, learning and travelling. Therefore, we find overlapping concepts such as investment attractiveness (Godlewska-Majkowska, Citation2018; Strzelczyk, Citation2015), business environment (Kiseľáková et al., Citation2019), economic environment (Dubé et al., Citation2016), business climate (Conroy et al., Citation2017), economic performance (Chin, Citation2020), market environment (Budzyńska, Citation2016), country characteristics (Kotler et al., Citation2019) and geomarketing (Ramadani et al., Citation2018). Research that focuses on location-specific rather than country-specific factors and that addresses issues of business development rather than the attraction of investment, uses the concept of a location’s attractiveness for business development (Dubé et al., Citation2016; Godlewska-Majkowska, Citation2018; Ramadani et al., Citation2018). In this article we include all of the definitions mentioned above in the analysis of the theoretical background, to give a deeper understanding of the impact of attractiveness for business development on the establishment of a new business. Following Kotler et al. (Citation2019) and Dunning (Citation2003), we define a location’s attractiveness for business development as the particular characteristics and competitive advantages of the location that affect strategic decisions about the establishment or development (maintenance) of a business in this location. In the article we focus on the aspect of the establishment of a new business.
The factors that drive the location decision for a new start-up and those that influence the decision of a larger firm looking for a site for a new branch are likely to be very different (Conroy et al., Citation2017). The factors analysis that is usually done is based on the one of three theoretical frameworks, namely, the neo-classical, behavioural, or institutional framework (Kotler et al., Citation2019). The institutional approach plays a crucial role in the analysis of location attractiveness in the context of the establishment of a new business (Chin, Citation2020), but all these approaches are widely used in international business decision and business reallocation research. The first decision a company faces is the selection and evaluation of a foreign market (Aliouche & Schlentrich, Citation2011). Within the institutional approach, external factors (e.g. formal and informal institutions, such as trust, networks, and local policies) are of the utmost importance to firm behaviour (Conroy et al., Citation2017).
Initially, location attractiveness is analysed by considering infrastructure, economic or institutional frameworks (Lee, Citation2016). A country’s attractiveness is determined by its macro environment, which includes, for instance, its economic, political, and social stability, whether it has favourable government policy, its market size and growth rate, its competitive landscape, its natural resources, its low-cost advantages, and its infrastructure; the attractiveness is adversely affected by corruption, inflation, lack of human development, and political risk (Brown et al., Citation2015). The most important determinants of attractiveness include tangible factors such as the country’s market size, prospects for market growth, degree of economic development (or per capita income) and market openness as regards its political and institutional environment (Christiansen, Citation2004), as well as taxes. A country that has a higher level of political stability, transparency, and human development is more likely to be attractive (Lee, Citation2016). An effective approach to researching a new market involves gathering information about firms already operating in this market (Kotler et al., Citation2019). However, Dunning (Citation2003) argues that the explanatory variables of investment attractiveness differ according to the motives for investment, the composition of the sector, the home and host countries of the investing firm, and a variety of firm-specific considerations; recently, intangible factors have become more important in developing the attractiveness of a location. ‘Soft power’, or the ability of a country to persuade or attract rather than coerce or buy (Nye, Citation2008), has recently become a means to success in international competition, because of political, social and environmental changes. The maturation of the knowledge-based economy and the emergence of the Internet as the dominant technological force, as well as an increase in intellectual capital and other kinds of intangible assets, have become the main factors affecting investment attractiveness (Dunning, Citation2003).
Numerous pieces of research stress the positive impact of an increase in attractiveness on the development of a location (Gokmenoglu et al., Citation2019; Táncošová, Citation2019), on workplaces and productivity (Li & Tanna, Citation2019), on the number of companies (Gokmenoglu et al., Citation2019), on GDP (Gokmenoglu et al., Citation2019; Táncošová, Citation2019) and on competitiveness (Kiseľáková et al., Citation2019). Following Conroy et al. (Citation2017), the number of studies at a regional level is noticeably smaller than the number at the country level. Furthermore, little is known about the impact of location attractiveness on the indicators for the establishment of a new business. Most research analyses the effects on the relocation of companies (Conroy et al., Citation2017; Kotler et al., Citation2019) or on foreign direct investment (Dunning, Citation2003; Younsi & Bechtini, Citation2019). Some studies analyse the interaction between location attractiveness and new business development at a regional level. Strzelczyk (Citation2015) analysed Polish regions and found a positive relationship between the potential investment attractiveness of a region and the number of localised economic subjects in a particular voivodeship. A policy enhancing the business climate may be productive in some regions but not in others (Chin, Citation2020). We could find no research at regional level for an advanced, small, open economy in Eastern Europe. Eastern European countries offer a special case as they reflect economic development principles in a period of profound socio-economic transformation. Although these countries are mostly fully functioning market economies, the east–west divide is still evident.
The concepts of a smart city or region and smart specialisation have attracted great interest and have been widely adopted in European regional and innovation policy (Piirainen et al., Citation2017). A smart specialisation policy combines the support of entrepreneurs to discover new domains of future opportunities, the promotion of structural changes and non-neutrally designed policy instruments (Foray et al., Citation2011). In the mid-2000s, the smartness approach began to be applied in the spatial context of urban planning (Gazzola et al., Citation2019; Machado Junior et al., Citation2018; Martin et al., Citation2018). Businesses also benefit in numerous ways from being located in a smart city or region, from the higher use of urban services (Belanche et al., Citation2016), greater efficiency in their operations, the protection of their investments and a better service for their customers. The smartness approach covers innovation-driven growth and digitalisation (Gazzola et al., Citation2019; Machado Junior et al., Citation2018; Martin et al., Citation2018) together with dynamic abilities such as insight, agility, learning, networking, and communication (Capello & Lenzi, Citation2018; Jucevicius & Juceviciene, Citation2015; Varga, Sebestyén, Szabó, & Szerb, 2020; Vinod Kumar & Dahiya, Citation2017). Smartness is achieved through cooperation and networks among companies, institutions and citizens. Soft factors such as entrepreneurship (Vinod Kumar & Dahiya, Citation2017), learning (Jucevicius & Juceviciene, Citation2015), managerial discretion, clusters and networking (Evans, Citation2019) are distinguished as the determinants of a smartness approach. Although initially the smartness approach was treated as a pragmatic engineering method (Gazzola et al., Citation2019) for dealing with economic and social challenges by employing ICT, it subsequently became a means for the intelligent management of man-made environments (Jucevicius & Juceviciene, Citation2015). Following Caragliu et al. (Citation2011), the smartness approach is basic for improving governance and seeking economic efficiency. So far, research on many different aspects of smartness has been published worldwide, quite often on smart cities (Caragliu et al., Citation2011; Vinod Kumar & Dahiya, Citation2017) and smart specialisation strategies (Krammer, Citation2017), as well as on sustainable development (Gazzola et al., Citation2019; Martin et al., Citation2018) and competitiveness (Vinod Kumar & Dahiya, Citation2017). However, the concept of attractiveness has not been analysed in the context of the smartness approach (Snieska et al., Citation2019).
presents our conceptual view of location attractiveness for business development using the smartness approach. Following Snieska et al. (Citation2019), Martin et al. (Citation2018), Varga et al. (Citation2020), Vinod Kumar and Dahiya (Citation2017) and Jucevicius and Juceviciene (Citation2015), the determinants of a location’s attractiveness for business development are divided into seven groups: 1) intelligence-driven; 2) networking and infrastructure-driven; 3) sustainability-driven; 4) digitalisation-driven; 5) learning-driven; 6) agility-driven; and 7) innovativeness and knowledge-driven attractiveness. The more detailed characteristics of determinants are presented in other article, namely Snieska et al. (Citation2019).
Figure 1. Conceptual framework of the impact of a location’s attractiveness for business development on new business establishment. Source: Authors.
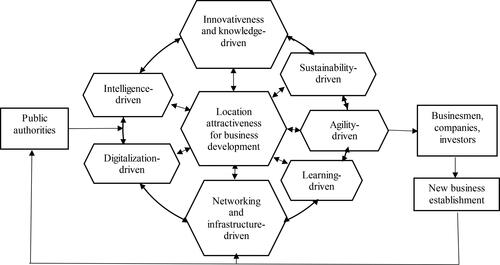
We use the institutional framework (Kotler et al., Citation2019) for the analysis of the impact of attractiveness on the establishment of new businesses. Public authorities are recognised as responsible for the determinants of a location’s attractiveness and the implementation of appropriate strategies. Businessmen, companies and investors are recognised as the exploiters of a location’s attractiveness and at the same time they are creators of location investment attractiveness. The networking and agglomeration affect incorporate different agents to build and expand the determinants of location’s attractiveness. Such approach stresses the ability of different actors to work together for a common purpose (increase the attractiveness).
3. Data and research methodology
The impact of a location’s attractiveness for business development on business establishment is analysed by creating the LA-index and comparing this with new business establishment indicators, using correlation and the Granger causality test. The research is done in the context of regional disparities in economic development. The units of research are ten Lithuanian regions (NUTS level 3) classified into three groups, according to economic development level and importance to country’s economy (White Paper of Lithuanian Regional Policy Citation2017–2030): European importance (Vilnius, Kaunas, and Klaipeda); national importance (Siauliai and Panevezys); and regional importance (Alytus, Marijampole, Taurage, Telsiai, and Utena). This classification clusters regions according to their different impacts on the national economy. In the regions of European importance, there are top-notch services and special types of infrastructure (universities, research and development (R&D) infrastructure, university hospitals, etc.), and these regions provide support for the development of services, giving high added value. In the regions of national importance, there are university departments and region-specific state-owned enterprises and institutions, and these regions provide support for the development of services and production, giving high added value. In the regions of regional importance, there are vocational training colleges and their departments, territorial departments of business service institutions, region-specific departments of state-owned enterprises, and facilities for the secondary level of healthcare, and these regions provide support for the development of production, giving high and medium added value.
presents the indicators for a location’s attractiveness for business development.
Table 1. The determinants and indicators of a location’s attractiveness for business development.
The selection of indicators is based on the literature research (Snieska et al. (Citation2019), Martin et al. (Citation2018), Varga et al. (Citation2020), Vinod Kumar and Dahiya (Citation2017)) and data availability. The identified seven factors groups are specified. Following Martin et al. (Citation2018) “a complex adaptive systems theory”, the indicators of less specified group (namely intelligence-driven, agility-driven, which are more difficult to characterise quantitatively) is more aggregated. Intelligence is the ability to learn, understand, and make judgments or have opinions that are based on reason, so the indicators (for example GDP per capita) which represent current locations characteristics, and development trajectory and potential are included. Agility is the ability to think quickly and clearly, so the indicators (for example young high-growth enterprises) which represent capacities of locations agents to be agile are included.
The LA-index was developed in the following way. The quantitative indicators and their values were selected (see ), and an interdependence analysis (Pearson correlation) was carried out. Correlation analysis allows index indicators to be refined by eliminating duplicate and redundant information (Sušnik & van der Zaag, Citation2017). In order that the economic meaning was not distorted, pairs of indicators with an extremely close linear relationship (when the Pearson correlation coefficient exceeded 0.8) were submitted for evaluation to decide whether or not the elimination of one indicator from a pair of strongly correlated indicators would distort the economic information. This research involved 12 experts (7 scientists and 5 practitioners). Each expert provided their opinion on which indicator from each pair must be left in further research. The consistency level of agreement between experts regarding the indicators was evaluated by Cronbach's alpha coefficient. Value of 0.76 proved that answers have relatively high consistency as the value of 0.70 and higher is considered admissible.
On the basis of the expert recommendations, the initial number of 44 characterising indicators was reduced to 36. The use of expert evaluation in the index estimation methodology, as well as the elimination of redundant indicators, distinguishes this methodology from various other methodologies used in the scientific literature for the evaluation of a concept with multiple criteria by an index.
Normalization of the values was performed by using the method of the distance between the minimal and the maximal values. The LA-index is a set of seven sub-indexes which represents the different factor groups (see ). The LA-index is estimated by using the following mathematical function:
(1)
(1)
Here:
LA-index – location attractiveness for business development index;
Intell_sub-index – intelligence-driven attractiveness sub-index;
Netw_Infrastrt_sub-index – networking and infrastructure-driven attractiveness sub-index;
Sust_sub-index – sustainability-driven attractiveness sub-index;
Digit_sub-index – digitalisation-driven attractiveness sub-index;
Learn_sub-index – learning-driven attractiveness sub-index;
Agil_sub-index – agility-driven attractiveness sub-index;
Innov_ Knowl_sub-index – innovativeness and knowledge-driven attractiveness sub-index;
wi – weight coefficient of the ith factor.
All the sub-indices are assigned an equal weight coefficient (1/7). Each sub-index is characterised by a different number of indicators with different weight coefficients: the indicators of the Innov_ Knowl_sub-index are weighted by 0.125 (1/8); the indicators of Netw_Infrastrt_sub-index by 0.33 (1/3); the indicators of Sust_sub-index by 0.2 (1/5); the indicators of Digit_sub-index by 0.5 (1/2); the indicators of Learn_sub-index by 0.25 (1/4); and the indicators of Intell_sub-index and Agil_sub-index - by 0.14 (1/7).
The LA-index robustness and sensitivity analysis justifies the reliability of the index and the transparency of the estimations.
Following Kiseľáková et al. (Citation2019), Strzelczyk (Citation2015), and Godlewska-Majkowska (2018), indicators for new business establishment, excluding those used in the LA-index, were identified (see ).
Table 2. New business establishment indicators.
As indicators, which indirectly characterise new business establishment, we included non-residential and residential buildings. The practice showed that when large business (manufacture) comes to a separate location, it usually invests to infrastructure first. Smaller businesses (services, trade) usually rent infrastructure. Therefore, attractiveness for business is closely related to attractiveness for living.
The business establishment indicators described above were compared with the LA-index by employing correlation and the Granger causality test. The correlation analysis shows the strength of the relationship between the location’s attractiveness and the establishment of new businesses. The use of the Granger causality test defines the delayed effect (lags) and the direction of the relationship between a location’s attractiveness for business development and the establishment of new businesses (Gokmenoglu et al., Citation2019). The best lag value (5 years) for the dependent variable was chosen according to the Akaike (AIC) criterion (its minimum value). The research applied a 95% confidence level with 1, 2, 3, 4 and 5 lags (in years), so the null hypothesis, that a location’s attractiveness for business development does not have any impact on the business establishment indicators, is accepted when the estimated probability of the F statistics is higher than 0.05. The stationarity of the indicators was tested before the Granger causality test was performed, and the results of the unit root test confirmed that all the indicators had stationary time lines. The calculations were done using the econometric software GRETL.
Based on the availability of Statistics Lithuania data for the regions, the period of analysis was 2007–2017 ( and ). All the region-level indicators from the LA-index framework were used. Data for three indicators from the LA-index and two business establishment indicators, namely the self-employment rate, the proportion of the turnover of innovative enterprises to the turnover of all enterprises, innovation expenditure as a percentage of total turnover, the number of natural persons working under a business licence per 1000 people, and the number of natural persons working under an individual activity certificate per 1000 people, were missing for two out of the eleven analysed years for all regions. When the region was lacking several years of data, the data were predicted in the following way. If only an intermediate value was missing from the data, the missing value was filled in as the mean value of the two adjacent values. If a missing value was at the end or beginning of a time series, then a linear regression model with a coefficient of determination satisfying the regression conditions was used to predict this value. Data were missing for the self-employment rate, the number of natural persons working under a business licence per 1000 people and the number of natural persons working under an individual activity certificate per 1000 people for the years 2007 and 2008 for all regions. The prediction for these indicators was performed using linear regression models with the aim of keeping the coefficient of determination as high as possible. There were data for the turnover of innovative enterprises compared to the turnover of all enterprises and the innovation expenditure as a percentage of total turnover for every two years, so the missing data were filled in with the mean values of the adjacent values.
The descriptive statistics for the data show a wide variety in the analysed indicators, as the regions have different development levels. provides descriptive statistics for a single representative indicator from each factor group of location’s attractiveness for business development.
Table 3. Descriptive statistics.
For example, foreign direct investment per capita was, on average, €2444, and it varied over a comparatively large interval, from €117 to €14,392. The difference between the regions can be shown by examining the following indicators: the figure for gross monthly earnings was, on average, €610 and it varied from €385.90 to €1,226.40 during the analysed period; the number of newly registered small and medium enterprises per 1000 people per year was, on average, 2.01 (and varied from 0.78 to 9.10) and the number of newly created workplaces per 1000 people per year was 1.49 (and varied from 0.60 to 3.16).
4. Research results
The correlation between the LA-index and the business establishment indicators (see ) proves that there is a moderate (Pearson correlation coefficient varies from 0.40 to 0.59) or strong (varies from 0.60 to 0.79) relationship between a location’s attractiveness for business development and the establishment of businesses.
Table 4. Correlation between the LA-index and the new business establishment indicators, 2007–2017.
The impact of a location’s attractiveness for business development over time, analysed by applying the Granger causality test, is presented in . Only non-validated null hypotheses are included.
Table 5. Granger causality test results for the LA-index and business establishment indicators with 1-5 lags (years).
5. Discussion
We found that all regions under consideration show a moderate or strong positive correlation between the LA-index and the corporate and workplace indicators and between the LA-index and the self-employment indicators, which confirms that a location’s attractiveness for business development is conducive to the establishment of businesses (particularly small and medium-sized ones), job creation and self-employment. These findings are in agreement with previous studies (Chin, Citation2020; Godlewska-Majkowska & Komor, Citation2017; Strzelczyk, Citation2015), showing that the integration of the new approach (namely the smartness approach) into the concept of a location’s attractiveness for business development does not distort any economic tendencies. On the contrary, the integration of the new approach is important in qualitative terms (for giving insights) when making strategic decisions.
The results also reveal the ambiguous relationships between the LA-index and youth self-employment, and between the LA-index and building infrastructure, which suggest that deeper research into the above-mentioned relationships is needed. The correlation between youth self-employment and the LA-index could have been affected by intensive emigration of young people who are studying and working from unfriendly regions to more attractive ones (which confirms the negative correlation between the variables). The correlation between building infrastructure and the LA-index could have been affected by there being sufficient infrastructure supply in particular regions. The establishment of a business is based on the rent of the available infrastructure, while increasing business attractiveness promotes the establishment of businesses that demand less real estate.
The relationships between the LA-index and the business establishment indicators in different groups of regions are ambiguous. The research (see ) discloses the following tendencies:
Regions within the same country that are economically stronger, namely those of European and national importance, show a stronger relationship between the location’s attractiveness for business development and the corporate and workplace indicators, as well as between the location’s attractiveness for business development and the self-employment indicators.
Regions within the same country that are economically stronger, namely those of European importance, show a positive correlation between the location’s attractiveness for business development and youth self-employment.
Economically weaker regions, namely those of national and regional importance, show a negative correlation between the location’s attractiveness for business development and youth self-employment. This negative correlation occurs because young people from economically weaker regions are likely to emigrate to economically stronger regions or to find employment in strong regional companies rather than to start up in self-employment.
Within the same country, economically stronger regions, namely those of European importance, show a positive correlation between the location’s attractiveness for business development and building infrastructure.
The incorporation of smartness approach to assessment of location attractiveness process expanded the methodologies used in the literature and decision-making process by smart (soft) determinants.
The results in indicate that a location’s attractiveness for business development has both an instant and a delayed Granger causality impact on different aspects of business establishment:
A location’s attractiveness for business development most quickly (instantly) affects corporate and workplace indicators, and this impact lasts for one year (lag 1). This tendency is more pronounced in economically stronger regions.
A location’s attractiveness for business development affects the establishment of small and medium-sized companies after two or three years (lag 2, lag 3), and self-employment and youth (aged 18-29) self-employment after three years (lag 3). This tendency is more pronounced in economically stronger regions.
With a four-year lag, there is an inverse relationship between the number of natural persons working under an individual activity certificate and the location’s attractiveness for business development; that is, the number of natural persons working under an individual activity certificate affects the location’s attractiveness for business development. This finding indicates that a location’s attractiveness for business development affects business establishment, while business establishment, as an independent factor, affects the location’s attractiveness.
With a five-year lag, there is no causal relationship between a location’s attractiveness for business development and self-employment or between the location’s attractiveness for business development and youth (aged 18-29) self-employment.
With a one- or two-year lag, a location’s attractiveness for business development affects the building infrastructure indicators, while, with a four- or five-year lag, the building infrastructure indicators affect the location’s attractiveness for business development. This tendency is more pronounced in economically stronger regions.
The research shows that a location’s attractiveness for business development has the fastest effect on the corporate and workplace indicators, while later on (with a four- or five-year lag) it affects the establishment of small and medium-sized companies, self-employment (including youth self-employment) and the building infrastructure indicators. The absence of a relationship between a location’s attractiveness for business development and the business establishment indicators with a five-year lag proves that there is a continual need to boost a location’s attractiveness for business development. More pronounced impacts of a location’s attractiveness for business development on business establishment are observed in economically stronger regions.
The incorporation of Granger causality test to the assessment of location attractiveness process expanded the methodologies used in the literature and decision-making process by the delayed effect (impact over time).
The conceptual framework (see ) could be applied to analyse regions or countries of large or small economies. The set of quantitative indicators should be adjusted to the specifics of each territory and the availability of statistical data. The presented set of indicators is oriented to the regions of small economy country, which are more sensitive to international trade flows. For the analysis at the country level, macroeconomic indicators which differ among countries (for example, inflation, taxes rates) should be included. For the analysis of large economy countries, indicators characterising domestic consumption should be included.
6. Conclusions, limitations and further research
The institutional and smartness approaches allow us to clarify the definition of a location’s attractiveness for business development as the ability of a location, through its environment (comprising intelligence, sustainability, digitalisation, agility, innovativeness, networking, knowledge and learning) and the smart operation of its economic agents (representing public and private sectors), to attract, create and sustain business in a way that provides the location with a competitive advantage over the other locations.
Complementing the correlation analysis with expert evaluation, and including this evaluation in the LA-index, allows the elimination of variables carrying duplicate and redundant information, which increases the statistical confidence, simplicity and practical applicability of the methodology and the accuracy of the results.
The correlation between the LA-index and the business establishment indicators proves that there is a moderate or strong relationship between a location’s attractiveness for business development and the establishment of businesses. A location’s attractiveness for business development affects the establishment of businesses, while the establishment of businesses, as an independent factor, affects a location’s attractiveness. A location’s attractiveness for business development has effects not only in the current period but also in later periods.
The integration of the smartness approach into the concept of a location’s attractiveness for business development does not distort any economic tendencies. On the contrary, it is important in qualitative terms (providing insights) when making strategic decisions. Such integration lets systematically analyse attractiveness through soft determinants and has justified that location attractiveness for business development strategy might be supplemented by the smartness approach. New policy decision making, based on the latest economic research, makes the direct impact on the location attractiveness and its image.
This research is hampered by inherent limitations. The first limitation is related to the robustness and sensitivity of the LA-index and the selection of the number of business establishment indicators. The LA-index value and rankings are affected by the number of sub-indices, their constituent determinants and their indicators. The final result depends on the indicators used, and these, in their turn, can become a means of manipulation to achieve the desired results. Not all estimations can be properly interpreted, because of the vagueness of trends or low statistical confidence. A longer observation period (more than ten years) and a larger number of locations are required, and this should be taken into consideration when conducting future research. Another limitation is the focus on the case of a single country: given that the research is based on a single country’s dataset, the findings should be treated with considerable caution.
A number of future research opportunities can be envisaged. It would be worthwhile to carry out more comprehensive empirical research that would include a larger number of countries and would provide a deeper insight into the effects of a location’s attractiveness for business development in more or less economically strong regions. The methodology presented in this article is created for the assessment of a location’s attractiveness at a sub-national level. It could also be applied at both national and international levels after substituting and revising the indicators, considering the specific nature of the data and the period analysed. The development of methodological frameworks for the quantitative assessment of networking is another potential research area, because currently it is difficult to make a quantitative assessment of this component of a location’s attractiveness by employing the data available in general purpose databases.
Disclosure statement
No potential conflict of interest was reported by the author(s).
References
- Aliouche, E., & Schlentrich, U. (2011). Towards a strategic model of global franchise expansion. Journal of Retailing, 87(3), 345–365. https://doi.org/https://doi.org/10.1016/j.jretai.2011.01.004
- Belanche, D., Casaló, L. V., & Orús, C. (2016). City attachment and use of urban services: Benefits for smart cities. Cities, 50, 75–81. https://doi.org/https://doi.org/10.1016/j.cities.2015.08.016
- Brown, C., Cavusgil, S. T., & Lord, A. (2015). Country-risk measurement and analysis: A new conceptualization and managerial tool. International Business Review, 24(2), 246–265. https://doi.org/https://doi.org/10.1016/j.ibusrev.2014.07.012
- Budzyńska, K. (2016). Offshoring sector in Poland. Oeconomia Copernicana, 7(4), 635–651. https://doi.org/https://doi.org/10.12775/OeC.2016.035
- Capello, R., & Lenzi, C. (2018). Regional innovation patterns from an evolutionary perspective. Regional Studies, 52(2), 159–171. https://doi.org/https://doi.org/10.1080/00343404.2017.1296943
- Caragliu, A., Del Bo, C., & Nijkamp, P. (2011). Smart cities in Europe. Journal of Urban Technology, 18(2), 65–82. https://doi.org/https://doi.org/10.1080/10630732.2011.601117
- Chin, J. T. (2020). Location choice of new business establishments: Understanding the local context and neighbourhood conditions in the United States. Sustainability, 12(2), 501–517. https://doi.org/https://doi.org/10.3390/su12020501
- Christiansen, H. ( (2004). ). ODA and investment for development: What guidance can be drawn from investment climate scoreboards? OECD, Directorate for Financial and Enterprise Affairs, OECD Working Papers on International Investment.
- Conroy, T., Deller, S., & Tsvetkova, A. (2017). Interstate relocation of manufacturers and business climate. Review of Urban & Regional Development Studies, 29(1), 18–45. https://doi.org/https://doi.org/10.1111/rurd.12057
- Dubé, J., Brunelle, C., & Legros, D. (2016). Location theories and business location decision: A micro-spatial investigation in Canada. The Review of Regional Studies, 46(2), 143–170.
- Dunning, J. H. (2003). Determinants of foreign direct investment: Globalization-induced changes and the role of policies. In B. Tungodden, N. Stern, & I. Kolstad (Eds.), Annual World Bank Conference on Development Economics, Europe, Toward Pro-Poor Policies Aid, Institutions, and Globalization (pp. 279–290).
- Eicher, T. S., Helfman, L., & Lenkoski, A. (2012). Robust FDI determinants: Bayesian model averaging in the presence of selection bias. Journal of Macroeconomics, 34(3), 637–651. https://doi.org/https://doi.org/10.1016/j.jmacro.2012.01.010
- Evans, G. (2019). Emergence of a digital cluster in East London: Birth of a new hybrid firm. Competitiveness Review, 29(3), 253–266. https://doi.org/https://doi.org/10.1108/CR-08-2018-0047
- Foray, D., David, P. A., Bronwyn, H. (2011). Smart specialization. https://community.oecd.org/servlet/JiveServlet/previewBody/33875-102-1-64377/MTEI-WP-2011-001-Foray_David_Hall.pdf
- Gazzola, P., Gonzalez Del Campo, A., & Onyango, V. (2019). Going green vs going smart for sustainable development: Quo vadis?. Journal of Cleaner Production, 214, 881–892. https://doi.org/https://doi.org/10.1016/j.jclepro.2018.12.234
- Godlewska-Majkowska, H. (2018). Polarity of the regional space – The dilemma of shaping the investment attractiveness of Poland. Studies of the Industrial Geography Commission of the Polish Geographical Society, 32(4), 110–122. ]. https://doi.org/https://doi.org/10.24917/20801653.324.6
- Godlewska-Majkowska, H., & Komor, A. (2017). Regional strategic groups as a tool of enterprises localization analysis on automotive industry in the European Union. Engineering Economics, 28(1), 35–46. https://doi.org/https://doi.org/10.5755/j01.ee.28.1.7799
- Gokmenoglu, K., Kirikkaleli, D., & Eren, B. M. (2019). Time and frequency domain causality testing: The causal linkage between FDI and economic risk for the case of Turkey. The Journal of International Trade & Economic Development, 28(6), 649–667. https://doi.org/https://doi.org/10.1080/09638199.2018.1561745
- Jucevicius, R., & Juceviciene, P. (2015). Smart social system. In R. Jucevicius, J. Bruneckiene, & Gerd-Bodo von Carlsburg (Eds.), International Practices of Smart Development (pp. 39–56). Peter Lang.
- Jurčić, L., Franc, S., & Barišić, A. (2020). Impact of institutional quality on foreign direct investment inflow: Evidence from Croatia. Business Systems Research Journal, 11(1), 44–58. https://doi.org/https://doi.org/10.2478/bsrj-2020-0004
- Kiseľáková, D., Šofranková, B., Gombár, M., Čabinová, V., & Onuferová, E. (2019). Competitiveness and its impact on sustainability, business environment and human development of EU (28) countries in terms of Global Multi-Criteria Indices. Sustainability, 11(12), 3365. https://doi.org/https://doi.org/10.3390/su11123365
- Kita, P., & Šimberová, I. (2018). An overview of business models in the Czech chemical industry: A sustainable multiple value creation perspective. Entrepreneurship and Sustainability Issues, 6(2), 662–676. https://doi.org/https://doi.org/10.9770/jesi.2018.6.2(14)
- Kotler, P., Manrai, L. A., Lascu, D. N., & Manrai, A. K. (2019). Influence of country and company characteristics on international business decisions: A review, conceptual model and propositions. International Business Review, 28(3), 482–498. https://doi.org/https://doi.org/10.1016/j.ibusrev.2018.11.006
- Krammer, S. (2017). Science, technology, and innovation for economic competitiveness: The role of smart specialization in less-developed countries. Technological Forecasting and Social Change, 123, 95–107. https://doi.org/https://doi.org/10.1016/j.techfore.2017.06.028
- Lee, K. (2016). The conceptualization of country attractiveness: a review of research. International Review of Administrative Sciences, 82(4), 807–826. https://doi.org/https://doi.org/10.1177/0020852314566002
- Li, C. C., & Tanna, S. (2019). The impact of foreign direct investment on productivity: New evidence for developing countries. Economic Modelling, 80, 453–466. https://doi.org/https://doi.org/10.1016/j.econmod.2018.11.028
- White Paper of Lithuanian Regional Policy. (2017–2030). Lithuanian Regional Policy WHITE PAPER for harmonious and sustainable development (2017–2030). https://vrm.lrv.lt/uploads/vrm/documents/files/White_Paper.pdf
- Machado Junior, C., Nassif Mantovani Ribeiro, D. M., da Silva Pereira, R., & Bazanini, R. (2018). Do Brazilian cities want to become smart or sustainable?. Journal of Cleaner Production, 199, 214–221. https://doi.org/https://doi.org/10.1016/j.jclepro.2018.07.072
- Martin, C., Evans, J., & Karvonen, A. (2018). Smart and sustainable? Five tensions in the visions and practices of the smart-sustainable city in Europe and North America. Technological Forecasting and Social Change, 133, 269–278. https://doi.org/https://doi.org/10.1016/j.techfore.2018.01.005
- Nye, J. S. Jr, (2008). Public diplomacy and soft power. The Annals of the American Academy of Political and Social Science, 616(1), 94–109. https://doi.org/https://doi.org/10.1177/0002716207311699
- Piirainen, K. A., Tanner, A. N., & Alkaersig, L. (2017). Regional foresight and dynamics of smart specialization: A typology of regional diversification patterns. Technological Forecasting and Social Change, 115, 289–300. https://doi.org/https://doi.org/10.1016/j.techfore.2016.06.027
- Ramadani, V., Zendeli, D., Gerguri-Rashiti, S., & Dana, L. P. (2018). Impact of geomarketing and location determinants on business development and decision making. Competitiveness Review, 28(1), 98–120. https://doi.org/https://doi.org/10.1108/CR-12-2016-0081
- Snieska, V., Zykiene, I., & Burksaitiene, D. (2019). Evaluation of location's attractiveness for business growth in smart development. Economic Research-Ekonomska Istraživanja, 32(1), 925–946. https://doi.org/https://doi.org/10.1080/1331677X.2019.1590217
- Strzelczyk, W. (2015). Investment attractiveness measurement of the regions and versus general location of the enterprises. Economic and Regional Studies, 7(2), 5–25.
- Sušnik, J., & van der Zaag, P. (2017). Correlation and causation between the UN Human Development Index and national and personal wealth and resource exploitation. Economic Research-Ekonomska Istraživanja, 30(1), 1705–1723. https://doi.org/https://doi.org/10.1080/1331677X.2017.1383175
- Táncošová, J. (2019). The role of foreign direct investment in the economy of Slovakia. Entrepreneurship and Sustainability Issues, 6(4), 2127–2135. https://doi.org/https://doi.org/10.9770/jesi.2019.6.4(40)
- Varga, A., Sebestyén, T., Szabó, N., & Szerb, L. (2020). Estimating the economic impacts of knowledge network and entrepreneurship development in smart specialization policy. Regional Studies, 54(1), 48–59. https://doi.org/https://doi.org/10.1080/00343404.2018.1527026
- Vinod Kumar, T. M., & Dahiya, B. (2017). Smart economy in smart cities. In Vinod Kumar T. (Eds.), Advances in 21st Century Human Settlements. Springer.
- Younsi, M., & Bechtini, M. (2019). Does good governance matter for FDI? New evidence from emerging countries using a static and dynamic panel gravity model approach. Economics of Transition and Institutional Change, 27(3), 841–860. https://doi.org/https://doi.org/10.1111/ecot.12224