
Abstract
The challenge of creating a favourable business environment has motivated academics, international institutions and policy makers. An initiative that has recently been established to facilitate this path has involved the creation of ordered lists that classify the environment around companies and the ease of doing business. The World Bank’s DB measure is one such ranking system. This type of ranking has supported much research and many political decision-making processes. However, it is not common in these analyses to consider regional dynamics and how the results of such rankings and investigations should be interpreted considering regional specificities. The objective of this study is to evaluate the business environment and the production of wealth while considering the impacts of these regional dynamics. In particular, we study whether the DB sub-indicators are equally important regardless of a region’s level of economic development. The results are clear with evident configurations of dominant sub-indicators that are distinct in three regions. Our results show us that these rankings, and the design of public policies based on them, should consider regional specificities, thus refuting the idea that the design of public policies to improve the framework for companies should follow a "one fits all" intervention model.
JEL CODES:
1. Introduction
The challenge of creating a favourable business environment has motivated academics, international institutions and policy makers. One type of initiative established in recent years involves the creation of ordered lists that rank the environment around companies and the ease of doing business. The Global Competitiveness Report of the World Economic Forum and the World Bank’s Doing Business ranking are two examples of such rankings (Doshi et al., Citation2019).
A question that entities that publish such rankings and the academic community have not yet resolved concerns the analysis of regional dynamics that can be established by studying these rankings. The aim of this study is precisely to determine such regional dynamics. We intend to study, on a regional basis, whether sub-indicators of the Doing Business (DB) ranking are equally important regardless of stages of economic development in different regions.
This manuscript aims to fill the gap in the literature by studying 3 different groups of countries (African, Latin American and Organization for Economic Co-operation and Development (OECD) countries) representing different stages of economic development (Asongu & Odhiambo, Citation2019; Gasmi et al., Citation2013).For this purpose, the fuzzy-set qualitative comparative analysis (fsQCA) methodology is applied due to its great advantages in applying small databases and in multiple conjectural causation; in other words, there is not one solution but different combinations leading to the same outcome, resulting in equifinality (Berg-Schlosser et al., Citation2009). This research stems from previous studies, namely from Estevão et al. (Citation2020), in using the same conceptual framework and technique: the fsQCA method. Therefore, the six DB indicators applied in this previous study are also examined in the current manuscript. Thus, the comparability of results is feasible and latent.
The findings of this research suggest the existence of differences between configurations of GDP per capita within Africa, Latin America, and the OECD. Not only do the variables included in each configuration differ but also the number of available configurations. In other words, Africa and Latin America only show two configurations for higher gross domestic product (GDP) while the OECD presents six. These results support the notion that policy makers must avoid "one fits all" approaches with regards to a country’s regulations, reinforcing the idea of equifinality in macroeconomic policies.
This paper is organized as follows. It begins with a literature review, in which the background of this study is detailed, as well as the conceptual framework employed. The methodology section is divided into 3 subsections discussing the data analysis technique used (fsQCA); our data collection and variables; and our descriptive analysis and data calibration. After discussing the methods used, we explain our results in terms of necessary and sufficient conditions for the outcome of interest. Then, a detailed discussion of the results is presented followed by our conclusions and contributions. The last section of the manuscript discusses study limitations and further research.
2. Literature review
2.1. Background
The Doing Business (DB) report, an annual survey published since 2004 by the World Bank, applies an “Ease of doing business ranking” whose result is established based on the values of 10 sub-indicators: Starting a business; Dealing with construction permits; Getting electricity; Registering property; Getting credit; Protecting minority investors; Paying taxes; Trading across borders; Enforcing contracts; and Resolving insolvency. All reports and complementary documentation are available from the project site (World Bank, Citation2020).
In the year of the first DB report, Alfaro et al. (Citation2004) noted that many countries, both developed and emerging, were establishing investment agencies. In parallel, policies that included fiscal and financial incentives to attract foreign direct investment (FDI) as well as other initiatives that sought to improve the local regulatory environment and reduce the cost of doing business were also developed. Therefore, the DB provided an answer, in terms of creating a tool, to what was at the time a major concern of policy makers: developing public policies that promote investment and especially foreign direct investment. The Doing Business ranking is often used either by policy makers to establish investment-friendly frameworks or by business leaders in their investment decisions.
The methodology used is publicly available on the project web page (World Bank, Citation2020). The most important developments of this methodology and variables have been explored by different authors, and such publications are already available in academic journals. The most prominent author on this topic is Djankov, who has shown great progress in this stream of literature over the last decades together with various coauthors. Some examples of these works include (Djankov et al., Citation2002, Citation2008; Djankov et al., Citation2003; Djankov et al., Citation2007; Djankov et al., Citation2008; Djankov et al., Citation2010b; Djankov et al., Citation2010a).
Furthermore, several research studies have used DB results as primary data for different studies across diverse knowledge fields and applying a multiplicity of methodologies. For example, Van Stel et al. (Citation2007) used DB sub-indicators to relate them to data on business creation for a sample of 39 countries. Ho and Wong (Citation2007) also used DB data to study entrepreneurship and its impact on regulatory costs. On the other hand, Corcoran and Gillanders (Citation2015) related foreign direct investment and the DB ranking and found differences in this relationship across different regions. Morris and Aziz (Citation2011) also studied the relationship between FDI and DB ranking.
Additionally, Jerbashian and Kochanova (Citation2016) sought to relate good business environments and the use of information and communication technologies while Handoyo (Citation2017) sought to establish a relationship between values obtained by the DB measure and good public management behaviours. Finally, Lash and Batavia (Citation2019) sought to establish the relationship between economic development (measured by the DB ranking) and corruption.
One of the most recent works was developed by Bahhouth and Ziemnowicz (Citation2019), who show that even countries with relatively similar contexts, whether economic or geographic, can present very different business environments, resulting in different development responses.
The above examples use the DB ranking to assess the relative positioning of different countries in different dimensions of competitiveness. They focus on the analysis of regulatory environment issues. However, this use of the DB ranking has been subject to significant criticism, especially in relation to the first reports. Estevão et al. (Citation2020) analysed some of these criticisms while recognising that these initial evaluations preceded methodological changes to the survey.
Some of the initial criticisms have been overcome, but some authors continue to point out other problems. Michaels (Citation2009) and Høyland et al. (Citation2012) associate the DB ranking with a neoliberal agenda and a view of the law's utility for a market marked by laissez faire policies. More recently, McCormack (Citation2018) criticized the use of the ranking and argued that it should be replaced.
However, he acknowledges that these criticisms have not prevented the DB ranking from drawing the attention of politicians and policy makers across the globe. According to Rieger (Citation2019) and Broome et al. (Citation2018), rankings such the Doing Business measure create knowledge that is viewed as credible by and used alike by policymakers. This aspect is relevant because the use of the DB ranking in these circumstances is often unnecessary (see, for instance, European Commission (Citation2018), Insolvency Service (Citation2016) and, in reference to a more complex situation, impact assessment reports CSWDIA (Citation2016) and CSWDIA (Citation2017)).
This relatively uncritical use of DB reports by policymakers and their staff makes it more pertinent to conduct independent evaluations of DB methodologies and results. For Krever (Citation2013), these rankings were established as standards imposing practices required to obtain improvements. When operating as standards, they influence the design of reforms, creating normative views implicit in numerical values. Establishing a similar view, McCormack (Citation2018) presents a second criticism of the DB ranking related to the issue of local specificities that this ranking never considers. For the author, in the "real" world, cultural sensitivity is an important issue, and a single ranking is not compatible with the identification of local specificities. It is also possible to add to this criticism the question of regional or developmental differences. This specific problem - local/regional development - is at the heart of the present study.
For the political or commercial decision maker, the issue of improving the regulatory environment or investment is not seen within the logic of a single country. The political decision maker compares the regulatory framework of his country with that of neighbouring countries, and likewise, the commercial decision maker evaluates several alternative destinations for his investment. Therefore, it is likely that regional standards, in addition to national specificities, should also be assessed when analysing DB data.
Different authors have already highlighted the idea of regional specificities in the process of reforming institutional frameworks (e.g., Gasmi et al., Citation2013). Additionally, Corcoran and Gillanders (Citation2015) noted that although in some regions there is a significant relationship between FDI and a country's level in the DB ranking, this does not always occur; that is, in some regions, this relationship is not observed. The current lack of reflection on regional readings of the DB results, which in many cases leads to one fitting all solutions, is the research gap that this work will address. This is the central question of this research. The next section further develops this idea.
2.2. Conceptual framework
This research comes to light due to a further analysis of variables and their impacts on GDP per capita previously observed by Estevão et al. (Citation2020). Thus, the conceptual framework of the current research is based on the aforementioned authors. However, this study addresses previous criticisms by employing the new DB method in the analysis. In other words, variables dealing with construction permits, getting credit, protecting minority investors, paying taxes, trading across borders, and resolving insolvency are extracted from the new methodology in contrast to Estevão et al. (Citation2020).
Additionally, this research aims to add to the literature an analysis of three groups of countries (African, Latin American and Organization for Economic Co-operation and Development (OECD) countries) representing three different stages of economic development: low, medium, and high, respectively. The goal is to verify whether differences exist in the number of configurations and in configurations themselves for a higher GDP per capita following the ideals of Rieger (Citation2019). The classification of countries per group follows the DB methodology.
Last, the present study examines stages of economic development, as an analysis of single-year observations can be subject to year effects and financial fluctuations. Thus, this study considers the average of the mentioned variables as well as the average of the outcome variable, GDP per capita, as conducted by Djankov et al. (Citation2010b).
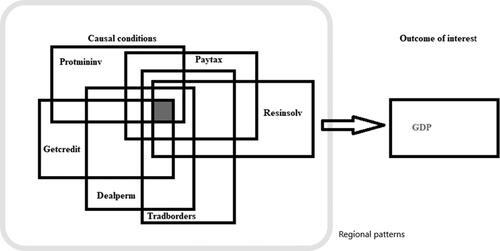
Thus, to a reference model previously used in Estevão et al. (Citation2020), a new layer of analysis is added to consider regional patterns (). Based on this previous work, it is expected that a high level of economic development in a country can provide more abundance of ‘recipes’ to increase GDP per capita. In other words, even if a country is not as strong as others in certain variables, the business environment can still improve GDP per capita. In the following sections, a more detailed analysis of these concepts is developed.
Figure 1. Conceptual framework (adapted from Estevão et al. (Citation2020)).
3. Methodology
3.1. Data analysis technique – fsQCA
Fuzzy-set qualitative comparative analysis (fsQCA) was chosen to identify conditions required for higher GDP based on entrepreneurship and business practices. This methodology, despite being recently developed, has been grown in popularity in different research areas such as in the entrepreneurship stream as verified by Kraus et al. (Citation2018).
The fsQCA identifies paths of configurations or conditions of variables that lead to an outcome. In other words, it identifies causal “recipes” instead of a unique independent variable (Park et al., Citation2017). According to Ragin (Citation2008b), such conditions can be necessary and/or sufficient. Necessary conditions are those that are always present in configurations. Sufficient conditions are those included in different configurations.
Hence, this methodology allows for multi-causality or for different sufficient conditions to determine a certain outcome. For the purposes of this research, this advantage is crucial. Recent research has adopted the same approach by identifying combinations or configurations of determinants of GDP using the DB indicators of Estevão et al. (Citation2020) conceptual framework. Finally, this technique is also especially relevant for the analysis of small samples, which are used in the present research (Greckhamer et al., Citation2013).
3.2. Data collection and variables
This paper builds on the recent research of Estevão et al. (Citation2020). Based on this research, the causal conditions of dealing with construction permits, getting credit, protecting minority investors, paying taxes, trading across borders, and resolving insolvency explain the outcome of interest – GDP per capita ().
Table 1. Variables description.
The present study was conducted not only for African countries but also for Latin American countries and the OECD as explained by the conceptual framework. Data were collected from the Doing Business report for all these variables and for all countries in the analysed regions. Observation years run from 2015 to 2018 and refer to years with data derived from the new DB methodology (reports for 2016 to 2019).
With respect to the outcome of interest, GDP per capita, data for each year were individually collected from the World Bank database, but a single average for the four years was computed to avoid year effects and bias problems. This methodology follows Djankov et al. (Citation2006) rationale.
3.3. Descriptive analysis and data calibration
This study examines different countries. Therefore, descriptive data are presented for each region. displays the descriptive statistics of the analysed DB variables and the GDP per capita for Africa, Latin America and the OECD (the 114 countries included in the sample) as well as the data calibration values for all variables.
Table 2. Descriptive (summary) statistics and calibration.
Based on the descriptive statistics, the 114 countries are grouped into broader groups: African, Latin American and OECD countries. The African countries present a GDP per capita of approximately 5,800 dollars with the lowest GDP per capita of 740 dollars found for the Central African Republic and the highest GDP per capita of 26,000 dollars found for Seychelles. Latin American countries a roughly three times higher GDP per capita (14,415.27$) on average. The range varies from $1,600 to $35,000. The OECD countries, on average, have a GDP per capita of approximately 40,000 dollars, and the standard deviation is approximately 14,000 dollars.
For data calibration, we transform the variables into values of between 0 and 1, i.e., fuzzy scores (Fiss, Citation2011). The degree of membership is reflected in fuzzy scores (Woodside & Zhang, Citation2013). Following the example given by Ragin (Citation2008a), cuts were made at 95%, 50% and 5% where 95% represents all membership cases, 50% denotes cases of ambiguity and 5% denotes cases of absence.
4. Results
This section presents a descriptive analysis of the data and describes the data calibration of the variables. Next, necessary conditions are identified, and detailed, and sufficient conditions are displayed for different combinations of GDP per capita for our main analysis.
4.1. Necessary conditions
The second step of the fsQCA method involves the identification of conditions that are necessary to explain a higher GDP. Both the presence and absence (∼ = indicates absence) of each variable were tested. For others, the need for high and low levels of each variable is a necessary condition for higher GDP per capita. shows that none of the regions presents values of consistency of higher than 0.8 among the analysed variables. In other words, the output shows that there are no necessary conditions according to (Fiss, Citation2011; Schneider et al., Citation2010). The authors state that a condition is considered “necessary” if it exceeds 0.9 and “almost always necessary” if it exceeds 0.8. Although some values are quite high, such as fsdealperm for Africa (0.774882) and fsresinsolv for the OECD (0.756902), none of the values are higher than the reference value. Hence, no variable alone explains higher values of GDP per capita. Thus, the next section analyses the configurations of variables that lead to higher values of GDP per capita in the different regions studied.
Table 3. Results of the necessary conditions.
4.2. Configurations for GDP per capita
As mentioned above, the main goal of this study is to identify “recipes” for a higher GDP per capita in Africa, Latin America, and OECD and to verify if differences exist between them. illustrates the configurations for each region and values of consistency and coverage per configuration for each region and group of countries. In the truth table, levels of consistency and values of Proportional Reduction Inconsistency (PRI) are analysed to determine outcome conditions required to avoid “false positives”, i.e., “solution terms in a fsQCA that show high levels of consistency and coverage without being supported by empirical evidence” (Schwellnus, Citation2013).
Table 4. Results of intermediate solutions (outcome GDP per capita Africa, GDP per capita Latin America and GDP per capita OECD).
First, for Africa, two configurations lead to higher values of GDP per capita. For both, variables fsxdealperm, fsxprovtmininv, and fsxresinsolv exhibit the same behaviour with the presence (●) of the former and the absence for the other two (O). However, fsxgc and fsxpaytax display the opposite behaviours. In configuration 1, fsxgetcredit is absent, and fsxpaytax is present. In the second configuration, the inverse behaviour is observed. Nevertheless, it is important to note that fsxpaytax is not a core condition in configuration 2, and it is the only non-core condition in all of Africa’s configurations. Finally, configuration 2 requires fsxtradborders to have a high value (presence), whereas in configuration 1, it is irrelevant.
For Latin America, two configurations lead to a higher GDP per capita. In both configurations, variables fsxprovtmininv and fsxresinsolv are present, but on the opposite side, variables fsxpaytax and fsxtradborders are absent. The major difference lies in variables fsxdealperm and fsxgetcredit. In configuration 1, both variables display an absent behaviour, while in configuration 2, both display a presence behaviour. In other words, in the first configuration, lower values of these variables are required while the second configuration requires the presence of higher values for these variables to achieve higher values of GDP per capita in these countries. Notably, all conditions of these configurations exhibit presence in the parsimonious solution; that is, they are core conditions except for fsxdealperm in configuration 1, which is considered peripheral, as it is not present in the abovementioned solution.
The last group considered in the analysis is the OECD. In contrast to Africa and Latin America, from which only two configurations were obtained, in the case of the OECD, the fsQCA method identifies six configurations that lead to higher GDP per capita. All configurations exhibit particularities; nonetheless, similarities can also be observed. First, variable fsxresinsolv must be present in 5 of the 6 solutions, and it is irrelevant in the other. Similarly, variable fsxtradborders is required in 5 solutions and irrelevant in the other, but in this case, lower values of this variable are expected (absence). Only solution 6 includes all variables, independent of behaviour, to lead to a higher GDP per capita. When observed closely, solutions 2, 3, 4 and 5 display similar behaviours. Starting with solution 5, all variables must have higher values except for fsxtradborders, which is irrelevant. For the other three, fsxtradborders must have lower values, causing fsxprovtmininv to be irrelevant in solution 2, fsxdealperm to be irrelevant in solution 3, and fsxgetcredit to be irrelevant in solution 4. However, for solution 2 to lead to higher GDP per capita, fsxpaytax must change behaviour and exhibit low values. However, this is not a core condition for the majority. Finally, configurations 1 and 6 can also be compared. In these configurations, the majority of variables exhibit absence behaviour where the variables must have low values for the solution to lead to higher GDP per capita. This applies with the exception of fsxpaytax (presence) and fsxresinsolv (irrelevant) in solution 1 and fsxprovtmininv (presence) and fsxresinsolv (presence) in solution 6.
To conclude, all of these results can be taken into account, as levels of consistency and coverage, both individual and overall, for the three groups of countries, follow the requirements recommended by Schneider and Wagemann (Citation2012).
5. Discussion
Given the goals of this study, the comparison of results of the three groups studied is crucial. From our descriptive analysis we found that GDP per capita in Africa is the lowest followed by those of Latin America and the OECD. These results were expected due to the particularities of the chosen groups as attested by Gasmi et al. (Citation2013) and Jovanovic and Jovanovic (Citation2018). In fact, the average GDP per capita of OECD countries is even higher than the highest GDP per capita of both African and Latin American countries. Nonetheless, configurations of higher GDP per capita for each of these groups represent the highest possible GDP per capita of each group (Woodside, Citation2016).
First, it is important to compare the results of the two regions of developing countries, i.e., Africa and Latin America. Although they are both mainly composed of developing countries, noticeable differences appear in the configurations’ and variables’ behaviours. While in Africa perceptions of the protection of minority interests and capacities to resolve insolvency situations are absent (low values), in Latin America, these are always present (high values). This contrasting result draws attention to governance issues and regulatory weaknesses found in Africa as previously attested by Gasmi et al. (Citation2013). In contrast, the high values of these variables found for all Latin American configurations resemble the high GDP per capita configurations of the OECD. Similarities between these groups have already been noted by Gasmi et al. (Citation2013), who find that Latin America is comparable to the OECD in terms of population in urban areas while it differs from Africa in terms of profitability, country risk, and regulatory power.
Africa and Latin America also differ from the OECD on the importance of trading across borders for higher GDP per capita. In Africa, in one of the configurations, trading across borders is essential to increasing GDP. For Latin America and the OECD, this variable is absent; that is, it has low levels or is irrelevant in all configurations. This finding indicates that for Latin America and the OECD, perceptions of high values are not required for a higher GDP. In fact, the configurations show low values for this variable. Thus, it is possible to conclude that for these two groups, perceptions of the time and costs required to export products are not an obstacle to increased GDP per capita while for Africa, this may be the case. This finding draws attention to previous research on foreign direct investment (FDI) in the poorest African countries (Corcoran & Gillanders, Citation2015), where higher values of FDI are not associated with higher levels of trading across borders. In a more recent study, Vučković et al. (Citation2020) call attention to the relevance of DB indicators for FDI investment and demonstrate which of these indicators lead to higher FDI values in several European countries. However, the authors find that trading across borders has a positive relation to FDI investment, which suggests that our findings on the relevance of this variable for macroeconomic performance only apply to certain contexts/regions.
Additional findings come to light when analysing the behaviour of variable paying taxes. In all of Latin America’s configurations, this variable only shows absence, i.e., low values, while in Africa and the OECD, it shows both presence and absence. This result brings to light the importance of regulations and governmental power in Latin American countries as previously pointed out by Djankov et al. (Citation2010b).
To conclude, variables dealing with construction permits and getting credit do not show a clear trend. In other words, they can be either present or absent depending on the configuration and country. However, in Africa, only a high frequency of deal permit contracts can lead to a higher GDP if the other conditions are met at the same time. This variable was previously analysed by Jitmaneeroj (Citation2016), who found dealing with construction permits to be one of the priorities that can contribute to improving the business regulatory environment but to not be at the top of the list. In fact, this variable is ranked ninth among the most important priorities out of ten.
6. Conclusions and contributions
The results obtained reveal differences between regions and specifically between Africa and Latin America (2 configurations) when compared to the OECD (6 configurations). Nevertheless, similarities between Latin America and the OECD are also seen, e.g., DB indicators “resolving insolvency” and “trading across borders” present the same behaviour.
These results make important contributions to the literature at different levels. First, this study reinforces the idea that there is an important gap between Africa and Latin America. Latin America is more like the OECD in terms of the behaviour of variables in configurations and mainly in terms of high values for resolving insolvency and the protection of minority interests and low values for trade across borders, clearly distinguishing this region from Africa’s inverse values.
Therefore, it is not appropriate to compare the DB ranking of an African country vis-à-vis the results of a country in Latin America. We must consider the specific regional environments of each country.
Nonetheless, Latin America is still in a limited stage of economic development, as only two configurations for higher GDP per capita were found as in Africa. On the other hand, the OECD is in an advanced stage of economic development as demonstrated by the number of configurations leading to a higher GDP per capita. As suggested by Estevão et al. (Citation2020), a high level of economic development in a country could provide more means to increase GDP per capita, which was found in this research. A country can be weaker in certain variables but still have a business environment that favours GDP improvements, and a snowball effect can then result (Gasmi et al., Citation2013).
As another important contribution of the present study, we identify relevant variables for each group. This is extremely important for decision makers, as the limited resources of countries impact improvements in all variables, making the identification of crucial variables an important differentiating factor. Hence, in Africa, the focus should be on dealing with construction permits, and in Latin America, the focus should be on protecting minority interests and the capacity to resolve insolvency. The OECD has “multiple cards to play” and more options than the other two regions. Nonetheless, decision makers in the OECD should pay special attention to resolving insolvencies as in Latin America, because this is not only required to improve legal security, but it is also present in 5 of the 6 solutions identified in this study.
7. Limitations and further research
This study is subject to several limitations. The first concerns the groups of countries included in the analysis, which were selected based on the DB methodology. Heterogeneities of countries included in each group as well as cultural differences between the groups may have introduced bias into the results. Further research could adopt different methodologies such as econometric techniques using fixed or random effects to check the robustness of our results.
Second, the availability of only 4 years of data based on the new methodology limited the number of observations considered and the generalization of our results. Thus, further research should apply different methodologies to check the robustness of our results (e.g., cluster analysis for the identification of other patterns).
Additionally, interesting findings may emerge if other groups of countries are included in further research. For example, Asian countries have dissimilar levels of economic development, which could bring challenging results to light. The adopted framework can also be applied to study other important factors such as FDI or the competitiveness index.
Acknowledgements
We thank Ricardo Rodrigues for his comments.
Disclosure statement
No potential conflict of interest was reported by the author(s).
Additional information
Funding
References
- Alfaro, L., Chanda, A., Kalemli-Ozcan, S., & Sayek, S. (2004). FDI and economic growth: The role of local financial markets. Journal of International Economics, 64(1), 89–112. https://doi.org/https://doi.org/10.1016/S0022-1996(03)00081-3
- Asongu, S. A., & Odhiambo, N. M. (2019). Challenges of doing business in Africa: A systematic review. Journal of African Business, 20(2), 259–268. https://doi.org/https://doi.org/10.1080/15228916.2019.1582294
- Bahhouth, V., & Ziemnowicz, C. (2019). Meeting the global challenges of doing business in the five candidate countries on the road to join the European Union. Journal of the Knowledge Economy, 10(3), 1297–1318. https://doi.org/https://doi.org/10.1007/s13132-018-0531-3
- Berg-Schlosser, D., de Meur, G., Rihoux,B., & Ragin, C. (2009). Qualitative comparative analysis (QCA) as an approach. In B. Rihoux, & C. Ragin (Eds.), Configurational comparative methods: Qualitative comparative analysis (QCA) and related techniques. Thousand Oaks: SAGE Publications.
- Broome, A., Homolar, A., & Kranke, M. (2018). Bad science: International organizations and the indirect power of global benchmarking. European Journal of International Relations, 24(3), 514–539. https://doi.org/https://doi.org/10.1177/1354066117719320
- Contractor, F. J., Dangol, R., Nuruzzaman, N., & Raghunath, S. (2020). How do country regulations and business environment impact foreign direct investment (FDI) inflows? International Business Review, 29(2), 101640. https://doi.org/https://doi.org/10.1016/j.ibusrev.2019.101640
- Corcoran, A., & Gillanders, R. (2015). Foreign direct investment and the ease of doing business. Review of World Economics, 151(1), 103–126. https://doi.org/https://doi.org/10.1007/s10290-014-0194-5
- CSWDIA. (2016). Commission staff working document impact assessment accompanying the document proposal for a directive of the European parliament and of the council on preventive restructuring frameworks, second chance and measures to increase the efficiency of restructuring, insolvency and discharge procedures and amending Directive 2012/30/EU. Council of the European Union.
- CSWDIA. (2017). Commission staff working document impact assessment accompanying the document proposal for a regulation of the European parliament and of the council on establishing a single digital gateway to provide information, procedures, assistance and problem solving services and amending regulation (EU) No 1024/2012. Council of the European Union.
- Djankov, S., McLiesh, C., & Shleifer, A. (2007). Private credit in 129 countries. Journal of Financial Economics, 84(2), 299–329. https://doi.org/https://doi.org/10.1016/j.jfineco.2006.03.004
- Djankov, S., McLiesh, C., & Ramalho, R. M. (2006). Regulation and growth. Economics Letters, 92(3), 395–401. https://doi.org/https://doi.org/10.1016/j.econlet.2006.03.021
- Djankov, S., Freund, C., & Pham, C. S. (2010a). Trading on time. Review of Economics and Statistics, 92(1), 166–173. https://doi.org/https://doi.org/10.1162/rest.2009.11498
- Djankov, S., Gasner, T., McLiesh, C., Ramalho, R., & Shleifer, A. (2010b). The effect of corporate taxes on investment and entrepreneurship. American Economic Journal: Macroeconomics, 2(3), 31–64. https://doi.org/https://doi.org/10.1017/CBO9781107415324.004
- Djankov, S., Hart, O., McLiesh, C., & Shleifer, A. (2008). Debt Enforcement around the world. Journal of Political Economy, 116(6), 1105–1149. https://doi.org/https://doi.org/10.1086/595015
- Djankov, S., La Porta, R., Lopez-de-Silanes, F., & Shleifer, A. (2002). The regulation of entry. The Quarterly Journal of Economics, 117(1), 1–37. https://doi.org/https://doi.org/10.1162/003355302753399436
- Djankov, S., La Porta, R., Lopez-de-Silanes, F., & Shleifer, A. (2003). Courts. The Quarterly Journal of Economics, 118(2), 453–517. https://doi.org/https://doi.org/10.1162/003355303321675437
- Djankov, S., La Porta, R., Lopez-de-Silanes, F., & Shleifer, A. (2008). The law and economics of self-dealing. Journal of Financial Economics, 88(3), 430–465. https://doi.org/https://doi.org/10.1016/j.jfineco.2007.02.007
- Doshi, R., Kelley, J. G., & Simmons, B. A. (2019). The power of ranking: The ease of doing business indicator and global regulatory behavior. International Organization, 73(03), 611–643. https://doi.org/https://doi.org/10.1017/S0020818319000158
- Estevão, J., Lopes, J. D., Penela, D., & Soares, J. M. (2020). The doing business ranking and the GDP. A qualitative study. Journal of Business Research, 115, 435–442. https://doi.org/https://doi.org/10.1016/j.jbusres.2019.11.067
- European Commission. (2018). A comparative overview of public administration characteristics and performance in EU28. European Union.
- Fiss, P. C. (2011). Building better causal theories: A fuzzy set approach theories to typologies in organization research. Academy of Management Journal, 54(2), 393–420.
- Gasmi, F., Maingard, A., Noumba, P., & Recuero Virto, L. (2013). The privatization of the fixed-line telecommunications operator in OECD, Latin America, Asia, and Africa. One Size Does Not Fit All. World Development, 45, 189–208. https://doi.org/https://doi.org/10.1016/j.worlddev.2012.11.005
- Greckhamer, T., Misangyi, V. F., & Fiss, P. C. (2013). Chapter 3 The two QCAs: From a Small-N to a Large-N set theoretic approach. Research in the sociology of organizations (Vol. 38). Emerald Group Publishing Limited. https://doi.org/https://doi.org/10.1108/S0733-558X(2013)0000038007
- Handoyo, S. (2017). An exploratory study on the relationship of public governance and ease of doing business. Asia Pacific Management and Business Application, 6(2), 75–88. https://doi.org/https://doi.org/10.21776/ub.apmba.2017.006.02.2
- Ho, Y. P., & Wong, P. K. (2007). Financing, regulatory costs and entrepreneurial propensity. Small Business Economics, 28(2-3), 187–204. https://doi.org/https://doi.org/10.1007/s11187-006-9015-0
- Høyland, B., Moene, K., & Willumsen, F. (2012). The tyranny of international index rankings. Journal of Development Economics, 97(1), 1–14. https://doi.org/https://doi.org/10.1016/j.jdeveco.2011.01.007
- Insolvency Service. (2016). A review of the corporate insolvency framework: A consultation on options for reform. Insolvency Service.
- Jerbashian, V., & Kochanova, A. (2016). The impact of doing business regulations on investments in ICT. Empirical Economics, 50(3), 991–1008. https://doi.org/https://doi.org/10.1007/s00181-015-0953-8
- Jitmaneeroj, B. (2016). A new approach to prioritizing SME regulation reforms. Journal of Small Business and Enterprise Development, 23(3), 854–872. https://doi.org/https://doi.org/10.1108/JSBED-11-2015-0161
- Jovanovic, B., & Jovanovic, B. (2018). Ease of doing business and FDI in the ex-socialist countries. International Economics and Economic Policy, 15(3), 587–627. https://doi.org/https://doi.org/10.1007/s10368-017-0377-3
- Kraus, S., Ribeiro-Soriano, D., & Schüssler, M. (2018). Fuzzy-set qualitative comparative analysis (fsQCA) in entrepreneurship and innovation research – the rise of a method. International Entrepreneurship and Management Journal, 14(1), 15–33. https://doi.org/https://doi.org/10.1007/s11365-017-0461-8
- Krever, T. (2013). Quantifying Law: legal indicator projects and the reproduction of neoliberal common sense. Third World Quarterly, 34(1), 131–150. https://doi.org/https://doi.org/10.1080/01436597.2012.755014
- Lash, N. A., & Batavia, B. (2019). Corruption and doing business in emerging markets. Asian Economic and Financial Review, 9(11), 1279–1289.
- McCormack, G. (2018). Why ‘doing business’ with the world bank may be bad for you. European Business Organization Law Review, 19(3), 649–676. https://doi.org/https://doi.org/10.1007/s40804-018-0116-4
- Michaels, R. (2009). Comparative law by numbers? Legal origins thesis, doing business reports, and the silence of traditional comparative law. American Journal of Comparative Law, 57(4), 765–796.
- Morris, R., & Aziz, A. (2011). Ease of doing business and FDI inflow to Sub-Saharan Africa and Asian countries. Cross Cultural Management: An International Journal, 18(4), 400–411. https://doi.org/https://doi.org/10.1108/13527601111179483
- Park, Y. K., Sawy, O., & Fiss, P. (2017). The role of business intelligence and communication technologies in organizational agility: A configurational approach. Journal of the Association for Information Systems, 18(9), 648–686. http://www-bcf.usc.edu/∼fiss/Park,ElSawy,&FissJAIS2017.pdf https://doi.org/https://doi.org/10.17705/1jais.00001
- Ragin, C. C. (2008a). Measurement versus calibration: A set-theoretic approach. In J. M. Box-Steffensmeier, H. E. Brady, & D. Collier (Eds.), The Oxford Handbook of Political Methodology (pp. 1–31). Oxford: OxfordUniversity Press.
- Ragin, C. C. (2008b). Redesigning Social Inquiry. (C. U. of C. Press, Ed.). Chicago: University of Chicago Press. https://doi.org/https://doi.org/10.7208/chicago/9780226702797.001.0001
- Rieger, A. (2019). Doing business and increasing emissions? An exploratory analysis of the impact of business regulation on CO2 emissions. Human Ecology Review, 25(1), 69–85. https://doi.org/https://doi.org/10.22459/HER.25.01.2019.04
- Schneider, C. Q., & Wagemann, C. (2012). Set-Theoretic Methods for the Social Sciences: A Guide to Qualitative Comparative Analysis (Strategies for Social Inquiry). Cambridge: Cambridge University Press. https://doi.org/https://doi.org/10.1017/cbo9781139004244
- Schneider, M. R., Schulze-Bentrop, C., & Paunescu, M. (2010). Mapping the institutional capital of high-tech firms: A fuzzy-set analysis of capitalist variety and export performance. Journal of International Business Studies , 41(2), 246–266. https://doi.org/https://doi.org/10.1057/jibs.2009.36
- Schwellnus, G. (2013). Eliminating the influence of irrelevant cases on the consistency and coverage of necessary and sufficient conditions in fuzzy-set QCA. Paper presented at the 7th ECPRGeneral Conference, Bordeaux, 4-7 september 2013. http://ecpr.eu/filestore/paperproposal/99d7fbea-b604-4251-847cf8e33c82cb41.pdf
- Van Stel, A., Storey, D. J., & Thurik, A. R. (2007). The effect of business regulations on nascent and young business entrepreneurship. Small Business Economics, 28(2-3), 171–186. https://doi.org/https://doi.org/10.1007/s11187-006-9014-1
- Vučković, M., Bobek, V., Maček, A., Skoko, H., & Horvat, T. (2020). Business environment and foreign direct investments: The case of selected European emerging economies. Economic Research-Ekonomska Istrazivanja, 33(1), 243–266. https://doi.org/https://doi.org/10.1080/1331677X.2019.1710228
- Woodside, A. G. (2016). The good practices manifesto: Overcoming bad practices pervasive in current research in business. Journal of Business Research, 69(2), 365–381. https://doi.org/https://doi.org/10.1016/j.jbusres.2015.09.008
- Woodside, A., & Zhang, M. (2013). Cultural diversity and marketing transations: Are market integration, large community size, and world religions necessary for fairness in ephemeral exchanges? Psychology & Marketing, 30(3), 263–276. https://doi.org/https://doi.org/10.1002/mar
- World Bank. (2020). Doing Business. World Bank Group. https://www.doingbusiness.org/en/doingbusiness