
 ?Mathematical formulae have been encoded as MathML and are displayed in this HTML version using MathJax in order to improve their display. Uncheck the box to turn MathJax off. This feature requires Javascript. Click on a formula to zoom.
Abstract
Earnings management is one of the most challenging, debated and controversial topics in finance and financial management. Organisational, legislative, and social norms regarding the ethics of earnings management may vary significantly, with the views of top management and economic environment playing significant roles in shaping the organisational social norm. Thus, the aim of this research is to assess if earnings management is the common practice of enterprises within V4 countries. A novel approach of the selection process to assess the ability of selected earnings management detection models was applied. To highlight discrepancies and similarities among the countries, the non-parametric alternative of analysis of variance was applied. The research confirmed that enterprises do manipulate earnings, typical is upward manipulation. Furthermore, the research unveiled the extent of manipulation with earnings in unique country samples and thus emphasised the importance of both corporate and national ethical principles and managerial decisions, which affect corporate financial reporting quality. However, it is increasingly challenging to identify various aspects and incentives which forced enterprises operating at the global level to smooth and inflate earnings to improve earnings presented in the financial statements and to misinterpret financial results.
Introduction
Earnings management (earnings manipulation) is the use of accounting techniques to produce financial statements that present an overly positive view of corporate business activities and financial position (Ye, Citation2007). As defined by Healy (Citation1985), earnings management is reasonable and legal management decision-making and reporting intended to achieve stable and predictable financial results. The importance of earnings management was underlined by Schipper (Citation1989) whose research focused on three issues: defining the object of earnings management, exploring conditions giving rise to earnings management and designing of empirical tests. McNichols and Wilson (Citation1988) remind that earnings management helps to achieve specific targets involving the manipulation of accruals through the discretionary choices of accrual accounting. A change in total accruals (T.A.s) is consistent with the accumulation of discretionary accruals (D.A.) produced by managing earnings (Legenzova et al., Citation2017). Kang (Citation2005) clarifies that D.A.s are non-obligatory expenses that are yet to be realised but are recorded in the account books and measure performance and position of a company by recognising economic events regardless of when cash transactions occur (Dechow & Dichev, Citation2002). The empirical research on earnings management has been marked by a few events that have had a great impact on the knowledge of earnings management; the most important is the introduction of non-discretionary accruals (N.D.A.s; Jones, Citation1991), which are understood as obligatory expenses that are yet to be realised but are already recorded in the account books (Bartov et al., Citation2000). Dechow et al. (Citation1995) contributed greatly to the development of earnings management as they modified the original Jones model (1991) to eliminate a conjectured tendency to measure D.A.s with an error when discretion is used over revenues. Callao and Jarne (Citation2010) claim that this study is a key advance in earnings management measuring. Lastly, the sophisticated model of Kothari et al. (Citation2005) was introduced calculating the D.A.s in the linear-performance-matching model. Some other studies focus mainly on the theoretical aspects of earnings management, studies such as Healy and Wahlen, (Citation1999) reporting that enterprises of various industries are lured by divergent incentives to manage earnings in order to declare necessary financial stability. Dechow and Skinner (Citation2000) consider earnings management a choice of an accounting norm that tries to mask true economic performance. Yaping (Citation2005) or Rath and Sun (Citation2008) reviewed earnings management literature and emphasised the main strengths of the studies published. As a result, the concept of earning management is still topical and of interest in financial and accounting literature and this subject assures the importance of this topic among researchers.
The main objective of the article is to assess the ability of selected earnings models applied in the national environment of Visegrad group countries to reveal the earnings manipulation using linear regression detection models and to extend the academic and scientific knowledge on earnings management. The mutual comparison of the countries is weighty as the countries with similar economic, political and social development differ in the way of the earnings management perception and detection. All four nations in the Visegrad group are high-income countries with a very high Human Development Index. V4 countries have enjoyed more or less steady economic growth for over a century. If counted as a single nation state, the Visegrad Group would be the fifth largest economy in Europe and the twelfth largest in the world. Based on gross domestic product per capita estimated figures for the year 2018, the most developed country in the grouping is the Czech Republic, followed by Slovakia, Poland and Hungary. Whereas, there have been no significant studies on earnings management in Slovakia, Hungary and the Czech Republic, there has been lots of research and studies carried out in Poland. Gierusz (Citation2010) focused the research on the mapping of the different valuation methods in accounting having a significant impact on the enterprise results. Brzeszczyński et al. (Citation2012) and Welc (Citation2011) investigated earnings manipulation among Polish companies providing evidence that manipulation with earnings is provided by Polish stock market companies. Strojek-Filus and Piosik (Citation2013) analysed the relations between the phenomenon of earnings management and financial reporting policy. Grabinski and Vladu (Citation2015) examined the impact of International Financial Reporting Standards (I.F.R.S.) and G.A.A.P. standards on the quality of accounting information. Niszczota (Citation2015) tested the inter-country variation in the corporate tendency to conform and explain the differences in perception of earnings management. Few studies and researches reveal the linking between the earnings management and the portions of primary and secondary shares sold in initial public offerings (e.g., Cieslik, Citation2016; Lizińska & Czapiewski, Citation2018; Sosnowski, Citation2017, Citation2018; Sosnowski & Wawryszuk-Misztal, Citation2019). As investigated by Callao et al. (Citation2014), Poland is a pioneer in developing models of earnings manipulation detection (with more than 10 models) considering the V4 countries, compared to other three countries where the issue of earnings manipulation is still unexplored.
The complex view on the countries and a huge database of enterprises allow exploring earnings management in details and contribute to the original outputs of the research. The purpose of the article is to clarify the phenomenon of earnings management considering the unique country samples of Visegrad. Legal, economic, political and ethical suppositions of the countries help understand the incentives of earnings manipulation. Thus, to achieve the objectives of the article, two hypotheses were tested:
The differences in earnings management among countries are statistically significant.
There are significant differences in earnings manipulation over the years.
The article is divided into four main parts. The theoretical background depicts the most relevant and recent studies addressing the issue of earnings management. The Research methodology section describes the data set of enterprises entering the analysis and the linear regression detection models used to reveal the manipulation with corporate earnings. This section also specifies the methodological steps of empirical research. The research results section is focused on the description of all findings, resulting in the suggestion of the model, which should be used in the specific conditions of V4 countries to detect problems with earnings manipulation. It also answers the hypothesis about the significant differences in earnings management among the countries and in different years. The final section unveils the major findings and suggests the future orientation of the research in this field.
1. Theoretical background
The term earnings management was first used by Hepworth (Citation1953). Since then, the investigation on earnings management has made significant progress. The work of Healy (Citation1985) should be mentioned as the author who used the average T.A.s for the first time to estimate the D.A., and therefore to estimate earnings management. During the following years, authors increasingly treated the issue of earnings management. The research focuses on the identification of the D.A.s based on the relation between T.A.s and hypothesised explanatory factors applying the highly influential and significant models, which are based on the determination of T.A.s and changes in T.A.s (Collins et al., Citation2017). As portrayed by Lo et al. (Citation2017), T.A. is defined by annual changes in key accounting variables – receivable accounts, inventories, payable accounts and depreciation. Selected detection econometric models assume that D.A.s are linearly dependent on the annual change in revenues, receivables, long-term tangible assets, cash flow or return on assets (different variables used in considered models). The calculation of accrual earnings management is represented by the model, introduced by Jones (Citation1991), using the regression approach to control non-discretionary factors influencing accruals, specifying a linear relation between T.A.s and changes in selected variables (revenues and tangible fixed assets). Jeter and Shivakumar (Citation1999) modified the original Jones model – they defined operating cash flow as a non-discretionary part of earnings management – and thus improved the model considering the detection of the earnings manipulation in enterprises with extremely high cash flows. Kasznik (Citation1999) modified the original Jones model adding the annual changes in operating cash flow as another independent variable of the model. Key (Citation1997) improved the model using the variable intangible assets describing the expected relation between intangible assets and depreciation as a part of the N.D.A. Dechow and Sloan (Citation1991) introduced an industry based model to measure normal accruals because enterprises within the same industry face the same incentives for discretionary behaviour. Teoh et al. (Citation1998) were geared to short-term accrual, which is easier to manipulate. The short-term accrual is defined as a difference in changes in non-financial current assets and changes in operating current assets. The non-discretionary part of the short-term accrual is determined by the increase of the equity offering. The model of Kothari et al. (Citation2005) introduces the performance-matching model that develops the Jones model and modified Jones model by controlling for corporate operating performance. This sophisticated model calculates accrual earnings management for each enterprise incorporating the lagged return of assets ratio into the Jones model and thus determines the D.A. in the linear-performance-matching model.
The latest research results have proved that authors focused on different issues and perspectives of earnings management. Kouaib et al. (Citation2018) focus on the moderating effects of mandatory I.F.R.S. adoption on the relationship between education and experience of top management and earnings management. Pereira and Gaspar Alves (Citation2017) analyse how accounting standards and the mandatory adoption of I.F.R.S. and I.A.S. affect earnings management in Portuguese listed companies. Accounting standards specify how companies must maintain and report their accounts to create a common accounting language, so that businesses and their financial statements can be consistent and reliable from company to company and country to country (Bartosova et al., Citation2019). Their results suggest that after the adoption of these standards there are still indications of earnings management in non-financial listed companies. The research of Ugrin et al. (Citation2017) shows that earnings management increased amongst enterprises in Europe post-I.F.R.S. adoption, but the association between I.F.R.S. adoption and earnings management is not uniform across countries. The study of Godsell et al. (Citation2017) examines earnings management in those countries that initiate an anti-dumping investigation pursuing the protectionist tariffs that a domestic government imposes on foreign imports that it believes are priced below fair market value. The authors declare that earnings management increases when accounting data directly affect the magnitude of tariffs imposed on the trade investigation and decreases with the increasing number of petitioning enterprises. Astami et al. (Citation2017) investigate the role of culture and audit quality on managerial decisions regarding accounting accruals using the cross-sectional modified Jones model. The interrelationships between national culture and accounting practices were revealed also in the research of Paredes and Wheatley, (Citation2017) and Ferramosca and Allegrini (Citation2018). The effect of government affiliation on the performance and real earnings management on privately held enterprises was surveyed by Ding et al. (Citation2018). They found out, that the politically affiliated enterprises are more likely to be engaged in earnings manipulation. However, the finding of Liu et al. (Citation2018) reveal, that institutional blockholders deter opportunistic financial reporting and these activities are the most evident among domestic institutional blockholders. Specific results were achieved by Gul et al. (Citation2018), Zalata et al. (Citation2018) and Saona et al. (Citation2019) who investigated the gender diversity effect of earnings manipulation. They unveil that the presence of female directors deters managers form managing earnings. The impact of types of managers was discussed by Capalbo et al. (Citation2018) and Baker et al. (Citation2019) providing the evidence that enterprises with narcissistic leaders engage in accruals management to manage earnings upwards. The consequences of earnings management from an innovation perspective and corporate long-term performance are examined in the research outputs of Lizińska and Czapiewski, (Citation2018), Bereskin et al. (Citation2018), Li et al. (Citation2019) or Donatella et al., (Citation2019).
Moreover, there is a wide spectrum of studies from Europe presenting the ways of the earnings management measuring. Callao et al. (Citation2017) assert that only a few studies focused on earning management were conducted in the period from 1996 to 2017. They alert that the studies based their research on small samples rather than a large sample.
From this point of view, the results of the study may be perceived as extraordinary, as more than 11,000 enterprises were considered (using the data from the Amadeus database). The complex view on the enterprises and huge database allow exploring the earnings management issues in details and contribute to the original outputs of the research.
2. Research methodology
The focus is on the identification of the D.A.s based on the relation between T.A.s and hypothesised explanatory factors. We use the models, which are based on the determination of T.A.s and changes in T.A.s. The selection and calculation of detection models are conditioned by the availability of the required financial data.
The Amadeus database supplied by Bureau van Dijk was used to gain key financial indicators of business entities operating in the period of 2014 to 2017. Each country offers an independent sample, which allows us to compare the results from different countries. However, as the countries were developed under the same conditions, there is a precondition of their similar perception of earnings management. Nevertheless, specific cultural and legal aspects of each country do play a significant role. The enterprises entering the analysis have to meet several criteria: the value of total assets is minimum 3,000,000 EUR; the value of total sales minimum 2,000,000 EUR and the value of net income (profit or loss for a period) is at least 100,000 EUR. The database of 11,105 enterprises was formed. There was a need to sort the data and discard incomplete and missing data and eliminate outliers. shows the sample selection procedure.
Table 1. Sample selection.
The research is realised in the following methodological steps:
(1) The manipulation with earnings is investigated based on the following models (). Models are based on the calculation of T.A.:
(1)
(1)
where:
annual change in receivables accounts
Table 2. Description of analysed earnings management models.
annual change in inventories
annual change in payable accounts
depreciation
All models assume that D.A.s are linearly dependent on annual changes of considered variables and almost all models are scaled by (total lagged assets), which is used as a deflator to avoid problems with heteroscedasticity.
(2) To calculate the models, the linear regression models were applied. The dependent variable (T.A.) was calculated as indicated in Equationequation (1)(1)
(1) , independent variables were determined based on the model () using the financial data from the Amadeus database.
Running the linear regression, the basic information about each model in each year was detected – the significance of the model and its variables, model quality measured by R squared and the regression coefficients. Identifying the most appropriate earnings model in each country, the computed regression coefficients were then used to calculate the D.A.s in individual years.
(3) To determine which model is the most appropriate to detect earnings management in each country, the assessing criteria have to be judged – adjusted R squared (Weisberg, Citation1985), predicted sign of variables (Key, Citation1997), standard deviation of the variables (McNichols, Citation2000) and significance level of the model (Kothari et al., Citation2005) and its variables (Ye, Citation2007).
(4) The most appropriate model is then used to calculate the D.A.s, using the coefficients of the calculated regression equation, for every enterprise in the data set and each year. The sign, magnitude and dimension of earnings management were calculated using the proportional ratio and means of absolute values of positive and negative D.A.s.
(5) The hypothetical sample of enterprises, which do not manipulate earnings (D.A. of these enterprises equals to zero) was formed.
(6) The normality of the data set was tested to identify whether to use parametric or non-parametric tests in further analysis.
(7) To test if the selected countries manipulate earnings, their accruals are compared with a hypothetical sample of companies that do not manage earnings. Using the non-parametric Kruskal-Wallis test (the normal distribution was not confirmed – three-year average values of D.A.s are not normally distributed as the p-value of the Kolmogorov-Smirnov test is below the significance level; see ), it may be determined if there is a significant difference (at a significance level 0.05) among the samples of companies (Slovak, Polish, Hungarian or Czech enterprises vs hypothetical sample of enterprises). The p-value below the value of the significance level reveals statistically significant differences in earnings manipulation between the country enterprises and the hypothetical sample of enterprises. The mean ranks are shown to reveal the lowest and highest manipulation within the countries.
Table 3. Kolmogorov-Smirnov test of normality.
(8) To test if the level of manipulation changes in the flow of years, the non-parametric Friedman test was calculated. If there is a significant difference among the D.A.s in individual years, the p-value of the Friedman test is less than the significance level indicating that the manipulation with earnings changes over the years.
3. Research Results
The research problem includes the application of several models used to detect the earnings manipulation, based on the linear regression analysis, which is the most commonly used method for detecting earnings management (Hoglund, Citation2010). However, several studies have clarified that non-linear specifications might be warranted to detect earnings management, e.g., Ball and Shivakumar (Citation2006), Kothari et al. (Citation2005). So far, there have not been many attempts outside the multiple linear regression approaches to solve the non-linearity, which is the reason for the use of linear regression models to detect earnings management in selected countries. Analysing all 11,105 enterprises in the database it was proved that the modified Jones model proposes significant results estimating the D.A.s compared to other models (Svabova et al., Citation2020).
The relevance of the models was assessed by the value of adjusted R squared, predicted sign of observed variables and their standard deviations, significance level of each model and its variables. The adjusted R squared compares the descriptive power of regression models, thus, the results over time and tendencies among models may be compared. The higher the value of adjusted R squared, the better the explaining ability of the model. In general, adjusted R squared of earnings management models does not achieve high values, but a lot of data can be generated also with low R squared as discussed in the studies of Neter and Wasserman (Citation1974), Locke and Wellalage (Citation2014), etc. Detecting the earnings management practices in the period of three years, the average values are considered. The highest explanation power measured by R squared was achieved by Jeter and Shivakumar model (9.45%), followed by Kothari (5.79%) and Jones modified (5.67%) models. All remaining models did not exceed the 5% value. The predicted sign of variables compares the expectations of the development of the variables with their real values. The match in signs indicates better explanation ability of the model variable and thus more accurate detection of earnings management. Each variable has different expectations of development; the negative development is expected for long-term tangible and intangible assets, cash flow and return on assets, the positive development for annual changes in revenues and receivables. The most problematic is the expectation of positive development of presented variables as the match of expected and real values was proved no more than in two periods and only for Key, Jeter and Shivakumar and Jones modified models. Standards deviation is a measure that is used to quantify the amount of dispersion of a set of data value and assesses the effectiveness of the model. Low values of standard deviation demonstrate that the data are very close to the mean value and thus the model is better to explain the issue of earnings manipulation (the limit value of standard deviation is 20%). The Jones model calculated for V4 countries has moderate values of standard deviations of individual variables; the average value of standard deviation of the variable long-term tangible assets presents only 4.30% from the value of the coefficient. The average standard deviation of the second variable of the model, changes in revenues, represents 20.44% (which is slightly over the limit value). The modified Jones model proved optimal values of standard deviation of individual variables − 9.80% for the variable ( and only 4.25% for the long-term tangible assets. Low value of standard deviation is achieved also in the industry based model (the average standard deviation of the median value of T.A.s is 5.68%), Kasznik model (standard deviation of
presents 16.14% from the value of the coefficient,
4.25% and
19.42%) and Teoh, Welch and Wong model (low standard deviation of the variable (
achieving the value of 11.02%). The other models – Jeter and Shivakumar, Key and Kothari models – failed in achieving the optimal values of standard deviation and do not prove sufficient explanatory power. Considering the significance level of the model and its variables, the truthfulness of results is evaluated. If the model itself or its variables are not statistically significant at the given significance level (set at the level of 5%), then this model (variable) does not explain the manipulation with earnings sufficiently. Despite the fact that all models can be determined to be statistically significant in all analysed periods, variable
is not statistically significant in several models (Jones, Jeter and Shivakumar, Kasznik and Key models). Summarising the results of the evaluated criteria it is evident, that the Jones modified model meets the requirements of all considered criteria and is appropriate to be used to detect earnings management in the Visegrad environment.
Thus, the modified Jones model was applied in each country to calculate the D.A.s which are used to detect the earnings manipulation; results are depicted in .
Figure 1. Manipulation with earnings by discretionary accruals.
Source: Authors’ research.
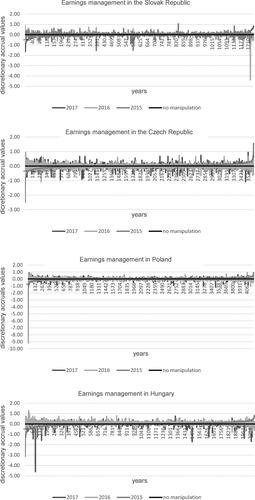
The results show that even though some authors consider earnings management to be unethical (e.g., Bruns & Merchant, Citation1990; Carpenter & Reimers, Citation2005; Elias, Citation2004) it is a common practice of enterprises and they do manipulate earnings legally within the determined accounting principles (Ipino & Parbonetti, Citation2017). Enterprises do not manipulate earnings if the value of D.A.s is zero (dark black line in ), also discussed by Jackson (Citation2018). However, the upward and downward manipulation is more typical for the enterprises, as the D.A.s of enterprises are significantly different from zero. The study of Pham et al. (Citation2019) uncovers and confirms the crucial role of D.A.s in the process of earnings management signalling. The overall situation may be described as follows. The sign of manipulation is given by the proportional ratio of companies with the positive or negative sign of calculated D.A.s to the total number of companies. summarises the percentage of companies with positive and negative D.A.s in each year and the mean value.
Table 4. Discretionary accruals in enterprises.
In each year, the percentage of positive D.A.s exceeds the percentage of negative D.A.s, which means that enterprises do prefer upwards manipulation of earnings. The mean value of positive D.A.s proves that almost 60% of enterprises tend to inflate their earnings to portray their financial reporting better than it is. The magnitude of earnings manipulation divulges that the absolute values of negative D.A.s are higher than the absolute values of positive D.A.s () indicating that if the enterprises manage earnings downwards, the manipulation is much more extensive than the upward manipulation.
Table 5. Magnitude of earnings management.
If the absolute values of means of positive or negative D.A.s are multiplied by the percentage of the cases with positive or negative D.A.s, the dimension of the earnings management may be calculated ().
Table 6. Dimension of earnings management.
Considering each year it was confirmed that the dimension of manipulation by increasing earnings is more significant than the downward manipulation.
However, the aim is to find out if there are any statistically significant differences in earnings management among enterprises of diverse countries and if the manipulation changes over the years. Using the non-parametric Friedman test, the significant differences in the earnings manipulation over the years were detected. The p-value equals to zero, which is below the significance level 0.05 and thus the distribution of D.A.s over the years is not the same. Assessing the means ranks of the Friedman test, there was a gradual increase in the manipulation of earnings between 2015 and 2016 with a slight decrease in 2017 ().
Table 7. Mean ranks of Friedman´s two-way analysis of variance.
The increase in the manipulation of earnings in 2016 might be a consequence of the decrease in the volume of gross domestic product (annual rate of change). These results are confirmed also in the study of Habib et al. (Citation2013) who claim that managers of distressed firms engage more in income-decreasing earnings management practices compared to their healthy firm counterparts. The gross fixed capital formation was negative in 2016 (increasing again in 2017) explaining that the new value-added in the economy is consumed rather than invested. The negative development of gross domestic product challenged managers to maintain the stability of enterprises (Sosnowski, Citation2018). In addition, the findings of Lisboa and Kacharava (Citation2018) suggest that inauspicious development has an impact on corporate tendency to manage financial results, however, the country effect is not statistically significant. Nevertheless, it is in divergence with the study of Geiger et al. (Citation2006) who confirm that perception of earnings management differs across countries.
Thus, using the non-parametric Kruskal-Wallis test, the significant differences between the enterprises and a hypothetical sample of enterprises were calculated. As the p-value is zero, there is very strong evidence to suggest that there are significant differences in earnings management among the countries. Callao et al. (Citation2014) confirmed that emerging countries show comparable economic development and their research did not detect differences in the perception of earning management. The mean ranks declare that Poland (PL) is the biggest manipulator of earnings, followed by Hungary (HU) and the Czech Republic (CZ). The lowest manipulation with earnings was detected in Slovakia (SK) (). Ostertagova et al. (Citation2014) explain that the Kruskal-Wallis test uses the ranks of the data, which are used in place of the raw data. Thus, the mean ranks are determined as differences of the sum of squares between the ranks in the specific group and the average rank.
Table 8. Mean ranks of the Kruskal-Wallis test.
Dunn’s post hoc tests are carried out on each pair of groups, adjustments to the p-value have to be made (test statistic is a dimensionless quantity). The Bonferroni adjustment is to multiply each Dunn´s p-value by the total number of realised tests (Field, 2013). The pairwise comparison shows the results of the Dunn-Bonferonni tests on each pair group, significance values were adjusted by the Bonferroni correction (Adj. Sig.) for multiple tests ().
Table 9. Pairwise comparison of groups.
The pairwise tests considered six pairs of country groups. The results verify strong evidence (adj. sig. is below the significance level) of differences almost between all groups of countries, except for one pair of countries (Hungary vs Czech Republic) where there was no evidence of a difference. The results are confirmed also by the mean ranks of the Kruskal-Wallis test, which are very close to each other ().
Figure 2. Pairwise comparison of group.
Source: Authors’ research.
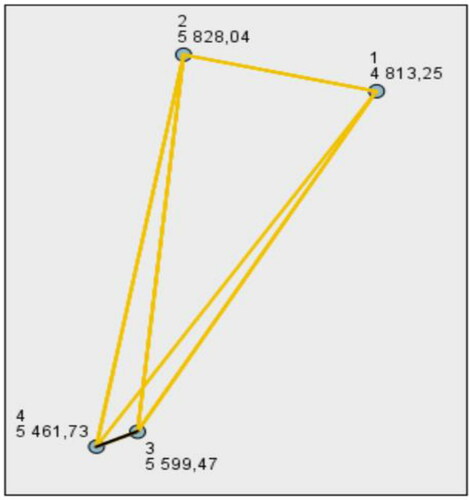
Significant differences between pairs are highlighted using an orange line to join the two different groups in the diagram, which shows the mean rank of each country; no differences by a black line. Each node shows the sample average rank of groups.
The differences can be explained by ethical, social and legal factors of each country. Following the annual reports of Global Competitiveness Index (G.C.I.; Janoskova & Kral, Citation2019; Schwab, Citation2016, Citation2017, Citation2018) of these countries, many differences can be found both in crucial macroeconomic indicators, i.e., the unemployment rate, inflation, GDP per capita and development of partial sectors of the economy, mainly the financial, business and institutional sectors. Determinants of economic growth of these countries are in details portrayed in the paper by Simionescu et al. (Citation2017). As no differences are evident considering Hungary and Czech Republic, it can be explained by a very similar development in the macroeconomic environment (similar to Sosnowski, Citation2017). Both countries have a higher level of inflation in each year compared to Poland and Slovakia for which deflation was typical in 2015 and 2016. Moreover, the levels of financial market development and business sophistication are much closer to each other compared to the other two countries. The Czech Republic and Hungary identically identified same most problematic factors of the inner market; corruption, tax rates, tax regulations, policy instability. G.C.I. index measures also the ethicality of each country using a 1- to 7-scale ().
Table 10. Ethicality indicator.
It portrays the average value of each country considering three indicators related to earnings management: ethical behaviour of enterprises, the strength of auditing and reporting standards and strength of investor protection. It is worth mentioning that whereas the three-year-average values of investor protection and strength of auditing standards reach relatively high values. The ethical behaviour of enterprises is slightly over the average of 3.5 verifying the unethical behaviour of enterprises, which is declared by results of this research – earnings management is the common practice of enterprises.
5. Conclusion
The research on smoothing and inflating of earnings in Visegrad group countries brings interesting results. The extensive calculations revealed that the modified Jones model is the most appropriate to detect earnings manipulation in these countries. Moreover, the upwards manipulation is typical for all countries over the years under investigation, however, the downward manipulation is significantly higher than the upward one. The increase in the manipulation of earnings in 2016 might be a consequence of the decrease in the volume of gross domestic product. The research also revealed that there are significant differences in the perception of earnings management among the countries – Poland is the biggest manipulator of earnings, whereas Slovakia the smallest. There are no statistically significant differences in earnings management between the Czech Republic and Hungary arising from their very similar development in the macro environment and problematic factors of the inner market.
The fact that countries have been developed in the same conditions, there are differences in earnings manipulation. It seems that cultural, social, and legal circumstances of each country, have a significant influence on the perception of earnings manipulation. On the other hand, changes in the macroeconomic environment influence business activities of enterprises, their financial stability, efficiency and credibility. Significant changes in macroeconomic environment bring various initiatives and challenges to enterprises, motivating them to manage earnings to adjust their financial results and thus produce financial statements that present an overly positive view of corporate business activities and financial position. Thus, there is a need to develop the tools necessary to identify earnings management techniques to protect the market or investors from financial risk due to distorted information.
The attempt was to detect earnings management considering the unique samples of V4 market. Despite the notable findings, it would be beneficial to unveil the manipulation with earning in wider scope considering the economic groupings (Eurozone, Visegrad countries, transition economies, etc.) or categorisation of enterprises from different angles – considering the sector of operation, ownership or legal form. The initial research is focused on linear regression, however, some authors argue that the relationship between accruals and performance is non-linear. An alternative approach using non-linear regression models or neural networks has to be considered in further research as well as the use other instrumental variable models which are well abreast with developments in this research area.
Disclosure statement
No potential conflict of interest was reported by the authors.
Additional information
Funding
References
- Astami, E. W., Rusmin, R., Hartadi, B., & Evans, K. (2017). The role of audit quality and culture influence on earnings management in companies with excessive free cash flow: Evidence from the Asia-Pacific region. International Journal of Accounting & Information Management, 25(1), 21–42. https://doi.org/https://doi.org/10.1108/IJAIM-05-2016-0059
- Baker, T. A., Lopez, T. J., Reitenga, A. L., & Ruch, G. W. (2019). The influence of CEO and CFO power on accruals and real earnings management. Review of Quantitative Finance and Accounting, 52(1), 325–345. https://doi.org/https://doi.org/10.1007/s11156-018-0711-z
- Ball, R., & Shivakumar, L. (2006). The role of accruals in asymmetrically timely gain and loss recognition. Journal of Accounting Research, 44(2), 207–242. https://doi.org/https://doi.org/10.1111/j.1475-679X.2006.00198.x
- Bartosova, V., Pshenichnikov, V. V., Ievtushenko, G., Petrova, L., & Ovchar, P. (2019). Accounting of transaction in electronic money: International trends. Academy of Accounting and Financial Studies Journal, 23(2), 1–6.
- Bartov, E., Gul, F., & Tsui, J. (2000). Discretionary-accruals models and audit qualifications. Journal of Accounting and Economics, 30(3), 421–452. https://doi.org/https://doi.org/10.1016/S0165-4101(01)00015-5
- Bereskin, F., Hsu, P. H., & Rotenberg, W. (2018). The real effects of real earnings management: Evidence from innovation. Contemporary Accounting Research, 35(1), 525–557. https://doi.org/https://doi.org/10.1111/1911-3846.12376
- Bruns, J. W., & Merchant, K. A. (1990). The dangerous morality of managing earnings. Management Accounting, 71, 22–25.
- Brzeszczyński, J., Gajda, J., & Schabek, T. (2012). Earnings management in Polish companies. Comparative economic research. Central and Eastern Europe, 14(3), 137–150. https://doi.org/https://doi.org/10.2478/v10103-011-0023-1
- Callao, S., Jarne, J., & Wroblewski, D. (2014). The development of earnings management research. A review of literature from three different perspectives. Zeszyty Teoretyczne Rachunkowości, 2014(79(135), 135–177. https://doi.org/https://doi.org/10.5604/16414381.1133395
- Callao, S., & Jarne, J. (2010). Have IFRS affected earnings management in the European Union? Accounting in Europe, 7(2), 159–189. https://doi.org/https://doi.org/10.1080/17449480.2010.511896
- Callao, S., Jarne, J., & Wroblewski, D. (2017). Detecting earnings management investigation on different models measuring earnings management for emerging Eastern European countries. International Journal of Research - Granthaalayah, 5(11), 222–259. https://doi.org/https://dx.doi.org/10.5281/zenodo.1095448.
- Capalbo, F., Frino, A., Lim, M. Y., Mollica, V., & Palumbo, R. (2018). The impact of CEO narcissism on earnings management. Abacus – Abacus, 54(2), 210–226. https://doi.org/https://doi.org/10.1111/abac.12116
- Carpenter, T. D., & Reimers, J. L. (2005). Unethical and fraudulent financial reporting: Applying the theory of planned behavior. Journal of Business Ethics, 60(2), 115–129. https://doi.org/https://doi.org/10.1007/s10551-004-7370-9
- Cieslik, R. (2016). Earnings management as a factor for underpricing initial public offerings: Evidence form the Warsaw Stock Exchange. Problemy Zardadzania – Management Issues, 14(4), 103–113. https://doi.org/https://doi.org/10.7172/1644-9584.63.7
- Collins, D. W., Pungaliya, R. S., & Vijh, A. M. (2017). The effects of firms growth and model specification choices on tests of earnings management in quarterly settings. The Accounting Review, 92(2), 69–100. https://doi.org/https://doi.org/10.2308/accr-51551
- Dechow, P., & Dichev, I. (2002). The quality of accruals and earnings: The role of accrual estimation errors. The Accounting Review, 77(s-1), 35–59. https://doi.org/https://doi.org/10.2308/accr.2002.77.s-1.35
- Dechow, P. M., & Skinner, D. J. (2000). Earnings management, reconciling the views of accounting academics, practitioners and regulators. Accounting Horizons, 14(2), 235–250. https://doi.org/https://doi.org/10.2308/acch.2000.14.2.235
- Dechow, P., & Sloan, R. (1991). Executive incentives and the horizon problems: An empirical investigation. Journal of Accounting and Economics, 14(1), 51–89. https://doi.org/https://doi.org/10.1016/0167-7187(91)90058-S
- Dechow, P., Sloan, R., & Sweeney, A. (1995). Detecting earnings management. The Accounting Review, 70(2), 193–225.
- Ding, R., Li, J., & Wu, Z. (2018). Government affiliation, real earnings management, and firm performance: The case of privately held firms. Journal of Business Research, 83, 138–150. https://doi.org/https://doi.org/10.1016/j.jbusres.2017.10.011
- Donatella, P., Haraldsson, M., & Tagesson, T. (2019). Do audit firm and audit costs/fees influence earnings management in Swedish municipalities? International Review of Administrative Sciences, 85(4), 673–691. https://doi.org/https://doi.org/10.1177/0020852317748730
- Elias, R. Z. (2004). The impact of corporate ethical values on perception of earnings management. Managerial Auditing Journal, 19(1), 84–98. https://doi.org/https://doi.org/10.1108/02686900410509839
- Ferramosca, S., & Allegrini, M. (2018). The complex role of family involvement in earnings management. Journal of Family Business Strategy, 9(2), 128–141. https://doi.org/https://doi.org/10.1016/j.jfbs.2018.01.001
- Geiger, M., ÓConnel, B., Clikeman, P., Ochoa, E., Witkowski, K., & Basioudis, I. (2006). Perception of earnings management: The effects of national culture. Advances in International Accounting, 19, 175–199. https://doi.org/https://doi.org/10.1016/S0897-3660(06)19007-8
- Gierusz, J. (2010). Historical cost or fair value - Valuation dilemmas in accounting. Theoretical Journal of Accounting, 62(118), 111–126.
- Godsell, D., Welker, M., & Zhang, N. I. N. G. (2017). Earnings management during antidumping investigations in Europe: Sample-wide and cross-sectional evidence. Journal of Accounting Research, 55(2), 407–457. https://doi.org/https://doi.org/10.1111/1475-679X.12166
- Grabinski, K., & Vladu, A. B. (2015). Earnings management under Polish GAAP versus IFRS: Evidence from an emerging market. African J. of Accounting, Auditing and Finance, 4(4), 294–311. https://doi.org/https://doi.org/10.1504/AJAAF.2015.075121
- Gul, A. A., Nekhili, M., Nagati, H., & Chtioui, T. (2018). Beyond gender diversity: How specific attributes of female directors affect earnings management. The British Accounting Review, 50(3), 255–274. https://doi.org/https://doi.org/10.1016/j.bar.2017.09.001
- Habib, A., Bhuiyan, B. U., & Islam, A. (2013). Financial distress, earnings management and market pricing of accruals during the global financial crisis. Managerial Finance, 39(2), 155–180. https://doi.org/https://doi.org/10.1108/03074351311294007
- Healy, P. (1985). The effects of bonus schemes on accounting decisions. Journal of Accounting and Economics, 7(1–3), 85–107. https://doi.org/https://doi.org/10.1016/0165-4101(85)90029-1
- Healy, P., & Wahlen, J. (1999). A review of the earnings management literature and its implications for standards setting. Accounting Horizons, 13(4), 365–383. https://doi.org/https://doi.org/10.2308/acch.1999.13.4.365
- Hepworth, S. R. (1953). Periodic income smoothing. The Accounting Review, 28(1), 32–39.
- Hoglund, H. (2010). Detecting earnings management using neural networks. Hanken School of Economics.
- Ipino, E., & Parbonetti, A. (2017). Mandatory IFRS adoption: The trade-off between accrual-based and real earnings management. Accounting and Business Research, 47(1), 91–121. https://doi.org/https://doi.org/10.1080/00014788.2016.1238293
- Jackson, A. B. (2018). Discretionary accruals: Earnings management….or not? Abacus, 54(2), 136–153. https://doi.org/https://doi.org/10.1111/abac.12117
- Janoskova, K., & Kral, P. (2019). An in-depth analysis of the summary innovation index in the V4 countries. Journal of Competitiveness, 11(2), 68–83. https://doi.org/https://doi.org/10.7441/joc.2019.02.05
- Jeter, D., & Shivakumar, L. (1999). Cross-sectional estimation of abnormal accruals using quarterly and annual data: Effectiveness in detecting event specific earnings management. Accounting and Business Research, 29(4), 299–319. https://doi.org/https://doi.org/10.1080/00014788.1999.9729590
- Jones, J. (1991). Earnings management during import relief investigations. Journal of Accounting Research, 29(2), 193–228. https://doi.org/https://doi.org/10.2307/2491047
- Kang, S. H. (2005). A conceptual and empirical evaluation of accrual prediction models. http://ssrn.com/abstract=147259
- Kasznik, R. (1999). On the association between voluntary disclosure and earnings management. Journal of Accounting Research, 37(1), 57–81. −https://doi.org/https://doi.org/10.2307/2491396
- Key, K. (1997). Political cost incentives for earnings management in the cable television industry. Journal of Accounting and Economics, 23(3), 309–337. https://doi.org/https://doi.org/10.1016/S0165-4101(97)00012-8
- Kothari, S., Leone, A., & Wasley, C. (2005). Performance match discretionary accrual measures. Journal of Accounting and Economics, 39(1), 163–197. https://doi.org/https://doi.org/10.1016/j.jacceco.2004.11.002
- Kouaib, A., Jarboui, A., & Mouakhar, K. (2018). CEOs´ accounting-based attributes and earnings management strategies under mandatory IFRS adoption. Journal of Applied Accounting Research, 19(4), 608–625. https://doi.org/https://doi.org/10.1108/JAAR-04-2017-0051
- Legenzova, R., Levišauskaitė, K., & Kundelis, E. (2017). Estimating and impact of base erosion and profit shifting (BEPS) countermeasures – A case of business group. Oeconomia Copernicana, 8(4), 621–642. https://doi.org/https://doi.org/10.24136/oc.v8i4.38
- Li, W., Ng, J., Tsang, A., & Urcan, O. (2019). Country-level institutions and management earnings forecasts. Journal of International Business Studies, 50(1), 48–82. https://doi.org/https://doi.org/10.1057/s41267-018-0190-4
- Lisboa, I., & Kacharava, A. (2018). Does financial crisis impact earnings management evidence from Portuguese and UK. European Journal of Applied Business and Management, 4(1), 80–100.
- Liu, C., Chung, C. Y., Sul, H. K., & Wang, K. N. (2018). Does hometown advantage matter? The case of institutional blockholders monitoring on earnings management in Korea. Journal of International Business Studies, 49(2), 196–221. https://doi.org/https://doi.org/10.1057/s41267-017-0093-9
- Lizińska, J., & Czapiewski, L. (2018). Towards economic corporate sustainability in reporting: What does earnings management around equity offerings mean for long-term performance? Sustainability, 10(12), 4349. https://doi.org/https://doi.org/10.3390/su10124349
- Lo, K., Ramos, F., & Rogo, R. (2017). Earnings management and annual report readability. Journal of Accounting and Economics, 63(1), 1–25. https://doi.org/https://doi.org/10.1016/j.jacceco.2016.09.002
- Locke, S. M., & Wellalage, N. H. (2014). The capital structure of Sri Lankan companies: A quantile regression analysis. Journal of Asia-Pacific Business, 15(3), 211–230.
- McNichols, M., & Wilson, P. (1988). Evidence of Earnings Management from the Provision for Bad Debts. Journal of Accounting Research, 26, 1–32. https://doi.org/https://doi.org/10.2307/2491176
- McNichols, M. (2000). Research design issues in earnings management studies. Journal of Accounting and Public Policy, 19(4–5), 313–345. https://doi.org/https://doi.org/10.1016/S0278-4254(00)00018-1
- Neter, J., & Wasserman, W. (1974). Applied linear statistical models: Regression, analysis of variance and experimental designs. Irwing.
- Niszczota, P. (2015). Social desirability bias and earnings management around the world. International Journal of Management and Economics, 47(1), 56–70. https://doi.org/https://doi.org/10.1515/ijme-2015-0028
- Ostertagova, E., Ostertag, O., & Kovac, J. (2014). Methodology and application of the Kruskal-Wallis test. Applied Mechanics and Materials, 611, 115–120. www.scientific.net/AMM.611.115 https://doi.org/https://doi.org/10.4028/www.scientific.net/AMM.611.115
- Paredes, A. A. P., & Wheatley, C. (2017). The influence of culture on real earnings management. International Journal of Emerging Markets, 12(1), 38–57. https://doi.org/https://doi.org/10.1108/IJoEM-12-2014-0218
- Pereira, A., & Gaspar Alves, M. (2017). Earnings management and European regulation 1606/2002: Evidence from non-financial Portuguese companies listed in Euronext. Revista de Contabilidad – Contabilidad, 20(2), 107–117. https://doi.org/https://doi.org/10.1016/j.rcsar.2017.05.002
- Pham, H. Y., Chung, R. Y. M., Roca, E., & Bao, B. H. (2019). Discretionary accruals: Signalling or earnings management in Australia? Accounting & Finance, 59(2), 1383–1413. https://doi.org/https://doi.org/10.1111/acfi.12275
- Rath, S., & Sun, L. (2008). The development of earnings management research. International Review of Business Research Papers, 4(2), 265–277.
- Saona, P., Muro, L., San Martin, P., & Baier-Fuentes, H. (2019). Board of director´s gender diversity and its impact on earnings management: An empirical analysis for elect European Firms. Technological and Economic Development of Economy, 25(4), 634–663. https://doi.org/https://doi.org/10.3846/tede.2019.9381
- Schipper, K. (1989). Commentary on earnings management. Accounting Horizons, 3(4), 91–102.
- Schwab, K. (2016). The Global Competitiveness Reports 2016–2017. World Economic Forum.
- Schwab, K. (2017). The Global Competitiveness Report 2017–2018. World Economic Forum.
- Schwab, K. (2018). The Global Competitiveness Reports 2018. World Economic Forum.
- Simionescu, M., Lazányi, K., Sopková, G., Dobeš, K., & Balcerzak, A. P. (2017). Determinants of economic growth in V4 countries and Romania. Journal of Competitiveness, 9(1), 103–116. https://doi.org/https://doi.org/10.7441/joc.2017.01.07
- Sosnowski, T. (2017). Earnings management and the floatation structure? Empirical evidence from Polish IPOs. Equilibrium, 12(4), 693–709. https://doi.org/https://doi.org/10.24136/eq.v12i4.36
- Sosnowski, T. (2018). Earnings management in the private equity divestment process on Warsaw Stock Exchange. Equilibrium, 13(4), 689–705. https://doi.org/https://doi.org/10.24136/eq.2018.033
- Sosnowski, T., & Wawryszuk-Misztal, A. (2019). Diversity of management and supervisory board and accuracy of management earnings forecasts in IPO prospectuses. Ekonomia i Prawo, 18(3), 347–363. https://doi.org/https://doi.org/10.12775/EiP.2019.024
- Strojek-Filus, M., & Piosik, A. (2013). An assessment of the application of earnings management objectives and instruments in financial reporting – Evidence of survey research result. Scientific Annals of the Alexandru Ioan Cuza University of Iasi Economic Sciences, 60(2), 331–356. https://doi.org/https://doi.org/10.2478/aicue-2013-0022
- Svabova, L., Valaskova, K., Durana, P., & Kliestik, T. (2020). Dependency analysis between various profit measures and corporate total assets for Visegrad group´s business entities. Organizacija, 53(1), 80–90. https://doi.org/https://doi.org/10.2478/org-2020-0006
- Teoh, S., Welch, I., & Wong, T. (1998). Earnings management and the underperformance of seasoned equity offerings. Journal of Financial Economics, 50(1), 63–99. https://doi.org/https://doi.org/10.1016/S0304-405X(98)00032-4
- Ugrin, J. C., Mason, T. W., & Emley, A. (2017). Culturés consequence: The relationship between income-increasing earnings management and IAS/IFRS adoption across cultures. Advances in Accounting, 37, 140–151. https://doi.org/https://doi.org/10.1016/j.adiac.2017.04.004
- Weisberg, S. (1985). Applied Linear Regression. Wiley.
- Welc, J. (2011). Are Polish public companies 'cooking the books'? The evidence from annual earnings thresholds. International Business & Economics Research Journal (IBER), 10(3), 83–90. https://doi.org/https://doi.org/10.19030/iber.v10i3.4104
- Yaping, N. (2005). The theoretical framework of earnings management. Canadian Social Science, 1(3), 32–38. https://doi.org/http://dx.doi.org/10.3968/j.css.1923669720050103.004
- Ye, J. (2007). Accounting accruals and tests of earnings management. Baruch College, 1–45.
- Zalata, A. M., Tauringana, V., & Tingbani, I. (2018). Audit committee financial expertise, gender, and earnings management: Does gender of the financial expert matter? International Review of Financial Analysis, 55, 170–183. https://doi.org/https://doi.org/10.1016/j.irfa.2017.11.002