
Abstract
The manipulation of Euro Interbank Offered Rate (Euribor) is a problem with great impact on international financial markets. This paper focuses on two aspects of the Euribor benchmark rate for the period 2004–2018: the specific features that make the Index more vulnerable to manipulation and the potential for Index manipulation over the studied period. To address the first aspect, we examine the range and the standard deviation of daily quotes, as well as the panel banks’ quote submissions to the Euribor administrator, the maximum and minimum quotes and the daily variation of submissions. As a result, we found a group of five banks with similar and extreme submission patterns, which might be a sign of manipulation. Regarding the second aspect, changes are made in the quotes submitted by panel banks by switching minimum and maximum daily quotes. Thus, potential for Euribor manipulation is measured as the difference between the observed Euribor rate and the estimated rate recalculated with adjusted quotes. The results indicate that potential for Euribor manipulation is higher when the number of banks in the panel is lower, when there are many banks involved in the manipulation of the Index, and in times of financial distress.
1. Introduction
The likely manipulation of two prominent market benchmark interest rates such as Euribor (Euro Interbank Offered Rate) and Libor (London Interbank Offered Rate) is a relevant problem that has affected financial markets in recent years.
First, it should be stressed that benchmark rate-fixing is not a trivial issue. According to European Commission estimates, Euribor is the benchmark rate for financial contracts with a total nominal value of about €180 quintillion (European Central Bank, Citation2019). These contracts are financial derivatives and mortgages.
Thus, in order to put into context why and how Euribor manipulation took place, it is necessary to examine the Euribor rate-setting process and the possible incentives for Index alteration.
According to the managing body of Euribor, the European Money Markets Institute, the Euribor benchmark rate is computed on the basis of panel banks’ estimated rate at which they deem a main bank would borrow from another main bank in the Eurozone interbank market (EMMI, Citation2013). This quote is submitted and the Index is fixed as the average rate after discarding the top 15% and bottom 15% quotes submitted. Note that the Index setting process involves panel banks’ subjective perceptions rather than real operations data. Therefore, this provides two potential incentives to manipulate Libor and Euribor.
Provided that panel banks are also investors in derivatives tied to these indices, there is a clear incentive to move the relevant index in the direction that favours their positions. Boot et al. (Citation2017) explain this incentive and provide transcripts of bank management talks as a clear sign of Euribor manipulation.
Another incentive to manipulate arises in times of crisis and consists of panel banks submitting lower rates than their actual cost of financing, with the intention of appearing a more solvent position. This is due to the fact that these contributions are public and can be regarded as a measure of the financing cost of these entities. This second incentive to manipulate is explained by McConnell (Citation2013) for the Libor index.
It was not until June 2012 that manipulation became relevant worldwide after the fine of 200 million dollars by the Commodity Futures Trading Commission of the United States to Barclays Bank for false quote contributions both in Libor and Euribor (CFTC, Citation2012). This situation led the European Commission to undertake an investigation that made clear the involvement of Barclays Bank, Crédit Agricole, HSBC, JP Morgan Chase, Deutsche Bank, Royal Bank of Scotland and Société Générale in the manipulation of Euribor (European Commission, Citation2013, Citation2016).
This paper includes a descriptive analysis of Euribor benchmark rate focussing on quotes provided by panel banks, which is the actual means of manipulation as recognised by incumbent banks. This descriptive analysis includes everything from graphing the data to calculating features of interest as the percentage of times bank contributions have been excluded from the calculation over time. Additionally, a study is carried out on Euribor potential of manipulation by the panel banks, modifying the contributions of the panel banks, assuming hypothetical manipulations. After examination of both aspects, the conclusions drawn on the manipulation of Euribor highlight the factors that have facilitated fraudulent actions. In the light of these conclusions, it is hoped that Euribor administrators will take the right decisions to improve the Euribor rate-setting process, who would be the main entity interested in the conclusions.
In reference to the contributions to literature, this study is one of the few focussed exclusively on Euribor manipulation. In addition, it reinforces some of the proposals made in the literature and proposes a novel line of investigation based on the results obtained from the contribution patterns of the condemned banks that include advanced techniques.
The paper is structured as follows: in Section 2, the literature on the manipulation of interest rate benchmarks is reviewed. In Section 3, the data and the methodology are described. In Section 4, the results are presented. And finally, in Section 5, the main conclusions are put forward.
2. Theoretical framework
Specialized literature on this subject ranges from the first work that dealt with anomalies in Libor (Mollenkamp & Whitehouse, 2008), to the most recent research on the manipulation of benchmark interest rates (Jordanoska & Lord, Citation2020).
After a thorough examination of literature on the manipulation of Euribor and Libor, three types of research works have been identified: those that analyse the manipulation suffered by the reference indices without offering any alternatives; those that propose methodological changes in these indices or their replacement by other market benchmarks and those that support keeping current methodology in place while preventing manipulation with other measures. In addition, there are certain research works published by international institutions as International Organization of Securities Commissions (2013), European Securities Market Authority-European Banking Authority (Citation2013), EMMI (Citation2015), Financial Stability Board (Citation2014), EMMI (Citation2017) and EMMI (Citation2018).
In addition, to clarify the relationship of the manipulation of financial benchmarks with other references from other markets and with regulation, see Verstein (Citation2015) and Fletcher (Citation2016).
2.1. Studies on manipulation of market benchmark interest rates without offering any alternatives
The study by Mollenkamp and Whitehouse (2008) is the first to detect that some panel banks provide lower than expected quotes to Libor as compared to those extrapolated from the Credit Default Swaps. Other research works have performed the same kind of analysis (Abrantes-Metz et al., Citation2012) or have reached the same conclusion after comparing Libor panel banks quotes with the interest rates at which these banks actually borrowed from the Fed (Kuo et al., Citation2012).
Snider and Youle (Citation2012) expose how manipulated contributions could benefit panel banks in their derivative positions, showing the high frequency of contributions outside the calculation window from alleged manipulators.
In addition, Chen (Citation2014) highlights the easy prediction by panel banks of cut-off points and the variability in the combination of banks within the computation range for Libor. Likewise, Gandhi et al. (Citation2018) analyse the relationship between the quotes submitted by panel banks and their market positions tied to Libor, showing relationships leading to potential manipulations. Finally, Frunza (Citation2013) has emphasised the importance of cartel manipulation.
2.2. Studies that propose methodological changes or replacement by other benchmarks
Among the works that propose methodological changes or the replacement of the index, there are authors who maintain the median is a statistic harder to manipulate than the current trimmed mean (Youle, Citation2014). Also, the median including prior day quotes in benchmark rate-setting might as well be harder to manipulate than the current trimmed mean (Eisl et al., Citation2017). Other research works include a number of alternatives such as Wheatley (Citation2012a) and Wheatley (Citation2012b), while other authors just propose benchmark replacement with indicators such as the Overnight Index Swap (Brousseau et al., Citation2013) or the General Collateral Finance Repurchase Agreement Index (Hou & Skeie, Citation2014). Abrantes-Metz (Citation2012) and Duffie and Dworczak (Citation2018) propose that benchmark rates be calculated with interest rates of real market operations, or at least that subjective quotes be supported with real operations data (Evans & Abrantes-Metz, Citation2012).
Finally, it should be noted that regulatory changes must ensure an Euribor average value and volatility similar to those observed in the past to avoid affecting all financial products referenced to the benchmark.
2.3. Studies that support keeping current methodology while preventing manipulation
Among research works that propose keeping the current methodology, giving possible solutions to minimise manipulation, the following stand out. Snider and Youle (Citation2012) propose increasing the number of panel banks to make manipulation harder, making submitted quotes anonymous and tracking those quotes up to 60 days after submission.
In addition, Duffie and Stein (Citation2015) advise the increase of sanctions to make manipulation more expensive. Coulter et al. (Citation2018) develop a mechanism for banks to be incentivized to provide honest quotes, which consists of giving the possibility to any panel bank to offer another panel bank an interbank loan at the interest rate they have submitted, having the ability to report the possible rejections.
3. Methodology
3.1. Data and general methodology
The data used in this study are the daily quotes of panel banks and the long-term value of Euribor from January 2004 to November 2018. This period has been chosen because it was the total information provided by the Euribor managing body, EMMI (Citation2019).
As for Euribor terms, the study focuses on three-month and twelve-month terms provided that Euribor three-month term is the rate most derivatives are tied to, and the Euribor twelve-month term is the rate most mortgage loans are linked to.
A refinement of the original data has been carried out at the outset of the study in order to ensure robustness of subsequent analysis. Consequently, a function has been programmed with VBA software to recalculate the long-run index by entering daily quotes. This previous step has facilitated the detection of errors in the data. Once these deficiencies were corrected, it was possible to replicate the long-run value of the index for all terms considered. Thus, a data validation process has been carried out.
Finally, the same procedure of programming calculations automatically for each day throughout period of study with VBA has been followed in the descriptive analysis and in the study of the manipulation potential.
3.2. Descriptive analysis
This section covers the descriptive analysis of the data, defining the basic characteristics of data and detecting possible anomalies.
3.2.1. Subperiods under analysis
Both in this analysis and in the subsequent study of the manipulation potential, the period under review is divided into four subperiods in order to see the differences among them in terms of manipulation while highlighting the influence of the financial situation in each subperiod. The studied period has been divided into the Pre-Crisis (02/01/2004–08/08/2007), Global Financial Crisis (09/08/2007–07/05/2010), Sovereign Debt Crisis (08/05/2010–30/06/2014) and Post-Crisis (01/07/2014–30/11/2018). A similar division is made by Ballester et al. (Citation2016) for the study of bank CDS.
Regarding the choice of the cut-off points between subperiods, these are based on Zorgati et al. (Citation2019), European Central Bank (Citation2009), Drudi et al. (Citation2012) and the European Commission (Citation2019). These cut-off points have been chosen arbitrarily, because no consensus has been found in the literature.
3.2.2. Euribor long-term performance, the panel of banks and the range and standard deviation of quotes
As presented in , Euribor performance for both terms is very similar. There is a prolonged increase in Euribor in the first half of the financial crisis, followed by a sharp decrease in a few months until its stabilisation about 2010. During the sovereign debt crisis there is a slight rebound followed by a gradual drop until it goes into negative values for both tenors.
Figure 1. Euribor performance for 3-month and 12-month terms, evolution of the panel banks, and range and standard deviation of quotes for 3-month 12-month terms (2004-2018).
Source: Own elaboration on EMMI (Citation2019).
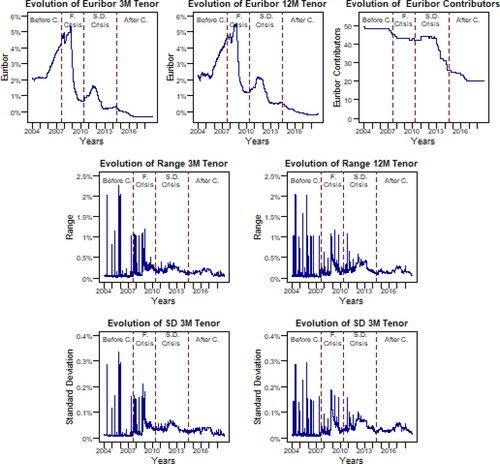
In this regard, highlights the large reduction in the number of panel banks throughout the analysis period. At the beginning of 2004, there were almost 50 banks in the panel, while at the end of 2018 the panel comprised only 20 banks. This circumstance is due to the fact that, after the convictions of banks for manipulation, the managing authority tightened the requirements to be a member of the panel. Another reason was the loss of interest of some banks in being contributors after the manipulation scandal.
Prior to conducting the study, it was assumed that the lower the number of panel banks, the greater the potential for manipulation by panel banks, because each bank quote has greater leverage over the Index computation.
Another aspect analysed is the range and standard deviation of daily quotes over the study period. The purpose of range and standard deviation analysis is to detect abnormal quote deliveries signalling unexpected behaviour that may entail manipulation.
Concerning the quotes range and standard deviation, the high ranges observed in for both terms throughout the Pre-crisis are rather striking because greater similarity in the quotes was expected in that subperiod. However, the differences detected during the financial crisis are predictable due to the uncertainty situation and the different solvency situations of panel banks. As for the quotes standard deviations, they follow a trend which is similar to that of their range.
The data analysis reveals that both the anomalies not represented (days 02/06/2004 and 08/14/2006) and those observed in are caused by a panel bank that delivers an abnormal quote (extremely large) for the day, pretending it is a mistake. This finding has been investigated by the European Securities Market Authority (Citation2013), which also warns of the anomalies of 06/02/2004 and 08/14/2006, which it describes as an error by the panel bank, because the quotes are between 44% and 55.5%. However, it admits that those are the quotes used in the computation of Euribor on that day. Additionally, it mentions other minor anomalies by panel banks that provide quotes which are 1% or more apart from the rest of panel banks’.
Therefore, according to the European Securities Market Authority (Citation2013), the Index has been computed assuming the quotes that cause the anomalous ranges and standard deviations in are correct. Consequently, the anomalies may be due to either bank errors in the provision of quotes or possible attempts to manipulate the Euribor benchmark rate. Therefore, anomalous quotes are not dropped and are the focus of the present study.
3.2.3. Analysis of panel quotes patterns
This subsection deals with one of the problems of Euribor manipulation. Although the current Euribor rate-setting process eliminates the 15% top and bottom quotes, a panel member that consistently provides false extreme quotes would end up modifying the Euribor computation range. This is precisely what the European Securities Market Authority (Citation2013) demonstrates. Therefore, a high frequency of quotes outside the calculation range delivered by the same panel member may be an indicator of attempted manipulation.
It should be noted that to program this analysis, the provisions of the European Banking Federation (Citation2012) have been followed, which highlights that discarding the upper and lower 15% values leads to the elimination of a number of panel banks’ quotes. Therefore, the quotes that were likely to be excluded are taken as discarded.
Thus, each of the banks comprising the panel has been monitored during the 15-year study period. Daily data are collected on quotes submitted by each bank, evaluating whether the provided quote is within the computation range, or is in the top or bottom 15% excluded from Index computation. Banks that stayed in the panel for any periods shorter than 18 months out of a 15-year study period (10% of the total period), have been eliminated as it is too short a period to draw any conclusions. The elimination of these banks is a subjective decision to shorten the calculation execution time, but it is not significant because none was convicted. These excluded banks are Caisse Nationale, CDC, Dekabank, IXIS and Unione di Banche Italiane.
After the elimination of these banks, all 52 remaining banks have stayed in the Euribor panel from 2004 to 2018, but not all during the entire period. shows the percentage of top and bottom quotes that are likely to be excluded and the percentage of quotes that have been taken into account in the Index computation for each bank.
Table 1. Percentage of quotes above high cut-off point (TOP), within computation range (IN) and below low cut-off point (BOTTOM) over the study period.
includes the banks convicted of manipulation, and it is observed that, out of 7 convicted banks, all except Royal Bank of Scotland present a percentage of quotes potentially out of the computation range greater than that of quotes within it. However, this is not a sign of manipulation by itself for there are other relevant factors such as the bank condition and the economic environment at any given time. This is the reason why there are unconvicted banks with high rates of quotes that fall both above and below the Index computation range. It is remarkable that there is a relatively balanced number of quotes provided by convicted banks which fall above and below the computation range. This could be a sign of quote differing manipulation trends depending on each bank’s investment position.
It is likely that the short presence of Royal Bank of Scotland (RBS) in the study period makes its participation in the Index manipulation an odd event, conversely to the rest of convicted banks. Therefore, RBS involvement is harder to detect from the mere inclusion or exclusion of quotes in the computation range. Additionally, according to the European Commission (Citation2013), RBS was, among convicted banks, the bank involved in the manipulation for the shortest period of time.
A period of special interest for studying the percentage of contributions within and outside the calculation is that in which the manipulation took place (2007–2013). In this sense, the percentages above and below the cut-off points (top and bottom) are obtained for that period and presented in a radar plot () in order to visually identify the manipulation patterns of the panel banks.
Figure 2. Comparison of the contribution behaviour of the banks of the panel in the manipulation period (2007-2013).
Source: Own elaboration on EMMI (Citation2019).
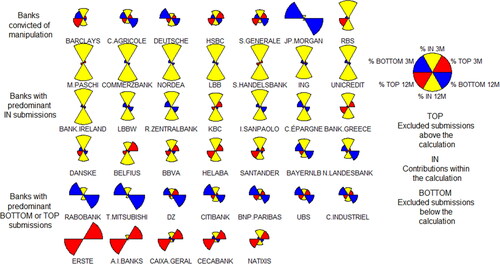
As can be seen in , five of the seven manipulator banks show very similar contribution patterns significantly different from the rest. In addition, these patterns are characterised by a very similar percentage of submissions into and out of the calculation from range.
Finally, note that the high percentage of quotes discarded is due to low quote variability during some subperiods. That is, there are periods where many banks’ quotes are alike and not too far apart from other panel banks’ quotes. Thus, the following section will focus on extreme values for daily quotes.
3.2.4. Extreme quotes analysis
This subsection complements the analysis of quotes that are in and out of the computation range. In this vein, we study both the percentage of extreme quotes by each panel bank that are either in the top-3 values or in the bottom-3 values for each computation day, and the number of non-extreme values. This information highlights the extreme quote patterns and attempts to clarify their possible association with anti-competitive practices.
The results in show a high percentage of non-extreme quotes. Note that four of the banks with about 40% extreme quotes are convicted of manipulation (Barclays Bank, Deutsche Bank, JP Morgan Chase and Société Générale).
Table 2. Percentage of quotes in the top-3 values (TOP), non-extreme values (IN) and bottom-3 values (BOTTOM).
It is difficult to identify illegal anti-competitive practices resulting from the specific financial situation of each bank just by relying on a descriptive analysis. However, any measures the Index administrator might take to curb manipulation should pay special attention to the ranking of quotes delivered by each bank.
3.2.5. Analysis of quotes’ daily differences
In this subsection, the absolute value of the change in daily quotes provided by each bank is examined in order to find possible sudden changes in quotes. In light of the results obtained in terms of average variation of daily quotes, convicted banks seem to be in tune with the rest of the banks.
Thus, it is likely that banks with cartel-like behaviour could manipulate the Index on a daily basis without large fluctuations in their quotes. In fact, these two approaches would be consistent with the ease of prediction of cut-off points proposed by Chen (Citation2014), or with the possibility of a manipulation of lesser effect but more frequent indicated by Eisl et al. (Citation2017) respectively.
3.3. Potential of manipulation
The term manipulation is defined as any actions concerning quotes submission by panel banks that not only differs from true and honest, but also causes a distortion effect on prices (or interest rates), following the approach of Kyle and Viswanathan (Citation2008).
Thus, the manipulation potential of Euribor from 2004 to 2018 is assessed applying a methodology similar to that used by Eisl et al. (Citation2017) but expanded and focused on Euribor. The possibility of manipulation has been examined by replacing the minimum with maximum daily quotes for each single bank; and then up to four banks in hypothetical cartel form (upward manipulation). Later, the potential for manipulation is analysed following the inverse process, replacing maximum with minimum quotes (downward manipulation).
Next, the Euribor rate is recalculated, and the resulting difference between the registered value of the Index and the recalculated value with adjustments is the potential for Euribor manipulation. The assumption of the hypothetical cartel is not far from reality as can be read in European Commission (Citation2016). In addition, the decision to assume up to a maximum of four banks in collusion is motivated by going beyond what is stated by Eisl et al. (Citation2017), since a supposed larger cartel is composed of three banks.
4. Results
This section explores results of the Index manipulation potential and its development. This study intends to measure the potential for manipulation of Euribor throughout the study period, as well as to assess the potential of manipulation with alternative methodologies.
4.1. Mean and standard deviation of manipulation potential
The results for upward and downward manipulation potential are presented in .
Table 3. Potential for manipulation of Euribor.
Accordingly, in , with respect to the total period, there is an average potential for manipulation that ranges from 0.0016% for a single bank to 0.0064% for a cartel of four banks for any three-month term. Similarly, the variability measured by the standard deviation is within the range 0.0013% and 0.0048% for the same term. For 12-month terms, the respective figures go from 0.0022% to 0.0083% average potential, and standard deviation within the range 0.0016% and 0.0054%. In short, the manipulation potential is greater the greater the number of banks hypothetically involved in manipulation.
Out of all subperiods under study, the highest potential for manipulation and the most variable values take place during the Debt crisis and the Global financial crisis subperiods.
In the Global financial crisis, the average level of manipulation potential for a single bank is 0.0024% for a 3-month term (0.0026% for a 12-month term) while for a cartel of four banks it is 0.0095% for a 3-month term (0.0102% for a 12-month term). That is, in that period four banks could, on average, alter the Euribor by about 0.01% (1 basic point), and in view of the high standard deviation of 0.0079% 3-month term (0.008% for 12-month term) it is feasible that on certain days the potential was well above 0.01%. Unsurprisingly, the results indicate that the potential for manipulation is greater in periods of crisis than in periods of stability.
Likewise, from the comparison between the Pre-crisis period and the Post-crisis period, the expectation is confirmed that the lower the number of panel banks, the greater the potential for manipulation. This is due to the fact that in the Pre-crisis subperiod (according to ) the number of panel banks is in the range 45–50 whereas in the Post-crisis subperiod it is in the range 20–25, both subperiods being stable. These results are in line with those obtained by Eisl et al. (Citation2017) for 3-month Euribor from 2005 to 2012.In the case of the potential for manipulation of Euribor downwards, the same fundamental conclusions are drawn as from the analysis of upward manipulation.
Finally, from the comparison of both manipulation types, no important differences are found.
4.2. Daily potential for manipulation
This subsection describes the characteristics of potential for manipulation on a daily basis. For this purpose, the time series of the differences between the observed (historical) Euribor rate and the recalculated benchmark rate are presented in for 3-month and 12-month terms both for upward and downward manipulation potential.
Figure 3. Potential for upward and downward manipulation, for 3-month and 12-month terms.
Source: Own elaboration.
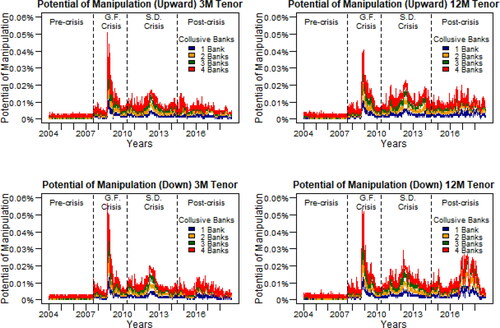
On a comparative basis, shows very similar upward manipulation potential for both 3-month and 12-month terms. The remarkable difference is that during the Global financial crises subperiod, the 3-month Euribor presents more extreme values for potential for upward manipulation than the 12-month rate. On the other hand, the 3-month Euribor rate is more likely to be manipulated at very specific points in time but, on average, it is less likely to be manipulated than the 12-month rate ().
In addition, the results presented in are confirmed in , both in terms of the potential for manipulation in different subperiods and the incidence of the gradual reduction in the number of panel members. The reduction of the number of banks comprising the panel is what keeps the potential for manipulation at the same level throughout Sovereign debt crisis and Post-crisis subperiods. This is the case because, although in the Post-crisis subperiod there is more stability in quote submissions, the number of panel banks was gradually reduced.
Similarly, from it can be inferred that the potential for downward manipulation and upward manipulation develop in similar terms.
In summary, the greater the number of banks involved in the potential manipulation, the greater the effect, the results presented in and in being statistically significant with a 1% One-Sample T-Test ().
Table 4. One sample t-test results.
4.3. The potential for manipulation of the median and the mode
In the literature, many authors propose a change in rate-setting methodology to reduce the potential for Euribor manipulation. In this sense, the same procedure is followed in the study of the potential for manipulation of the trimmed mean (current methodology), the median and the mode in the same way as done in Section 4.1. This section is important because it contains an example of two possible methodological changes, highlighting the problems that could arise from the Euribor administration applying those changes.
The results are displayed in , for upward and downward manipulation.
Table 5. Potential for manipulation of trimmed mean, median and mode.
The data in show that for both terms (3-month and 12-month) the upward manipulation potential is much lower for the median and the mode than for the trimmed mean, especially for the mode case.
However, also shows a much higher standard deviation for the mode as compared to that of the trimmed mean. In other words, these two alternative methodologies have a lower potential for manipulation in average terms, but much more variable mode, which could make it difficult for Euribor administrators to control these kind of illegal actions.
These techniques are selected for their simplicity and for their lower vulnerability to manipulation. In fact, the median is proposed by Youle (Citation2014). As for the mode, it was expected that its manipulation would be very complex because it would require foreseeing which quote submission would be the most frequent. Note that results in for downward potential are similar to upward, thereby supporting the conclusions drawn previously. In this respect, a high standard deviation for the mode is observed again. Thus, it is found that this is the case in periods of disparate quote submissions within panel banks, or when a cartel of just two, three or four banks is able to submit extreme equal quotes and cause the mode of submissions for a given day to be an extreme value. This results in that, over the few days when the optimal conditions occur, the potential for manipulation is either upward or downward and up to 5 basic points, thus explaining the high standard deviations.
4.4. Analysis of differences between the observed Euribor rate and the rate calculated on the basis of the median and the mode
Since the proposed rate-setting techniques have lower potential for manipulation than current Euribor rate-setting methodology, an additional requirement is contemplated in this subsection. For a hypothetical change of calculation method to be acceptable, the resulting benchmark rate must be very similar to the observed (historical) Euribor rate, to ensure that the future the value of the new benchmark rate will not differ significantly from the rate computed with the current Euribor rate-setting methodology.
This requirement is essential to make any methodological changes feasible, otherwise the disruptive shock in the financial markets would be worse than the manipulation of benchmark rates.
In order to test this requirement, the differences between the observed Euribor rate and that calculated with the median and mode are calculated for each subperiod.
As shown on , the average differences between median rates computed over the total period with observed Euribor rates are 0.0026% for 3-month term and 0.0028% for 12-month term. The corresponding values for the mode are 0.0041% and 0.0045%. That is, for both rate-setting methods proposed, the Euribor benchmark rate value would have been different. Note that the differences soar in crisis subperiods. The average differences for the median in the Global financial crisis subperiod are 0.0035% and 0.0037% for 3-month and 12-month terms, respectively. In the case of the mode, the average differences in the Global financial crisis subperiod are 0.0084% and 0.0089% for 3-month and 12-month terms, respectively.
Table 6. Mean and standard deviation of differences between observed Euribor rates and rates computed with the median and the mode for 3-month and 12-month terms.
Therefore, these differences have a great potential impact on financial markets. In fact, in the case of the mode, this difference is on average near 1 basic point during the Global financial crisis. Additionally, in consideration of the values observed for the standard deviation, it is concluded that there is high variability in the differences, which indicates that the deviations between observed Euribor rates and recalculated rates are not stable.
Finally, this sizeable difference leads us to question whether the change of Euribor current calculation method to any of the two methodologies proposed is feasible.
5. Conclusions
Given the great impact of the Euribor benchmark rate on many economic agents, the main objective of this paper is to study the potential for Euribor manipulation in general and, more specifically, the characteristics of quote submissions by panel banks. The ultimate goal is to put forward considerations and suggestions for improvement that Euribor administrators might find helpful.
Prior to the study of the potential for manipulation, a descriptive analysis provides certain indications of the manipulation of Euribor. Accordingly, past Euribor performance and panel display patterns, daily ranges, and standard deviations are examined throughout the study period. The quote submissions by each panel member are also analysed relative to the Euribor calculation range and the variability of daily submissions by each individual bank. According to our descriptive analysis, all convicted banks seem to have similar quote submission patterns among them and slightly different ones from non-convicted banks’, except for RBS for reasons already mentioned. The in-depth analysis of quote submission patterns indicates that it is possible to distinguish two types of banks: convicted banks and non-convicted banks. This is in line with the discovery of Frunza (Citation2013) for Libor. In particular, it has been obtained that out of the seven convicted banks, a total of five banks have a similar quote submission pattern, consisting of providing extreme quote values either above or below the Euribor daily calculation range.
Additionally, this study evaluates the possible impact of illegal actions on the benchmark rate. To this end, certain adjustments are made on observed (historical) quote submissions assuming hypothetical manipulations, measuring the difference between the observed Euribor benchmark rate and the rate recalculated with adjusted quotes.
The results suggest that the larger the number of banks involved in cartel behaviour, the greater the potential for manipulation, and they may alter the benchmark rate by more than one basic point. The potential for manipulation is greater in times of crisis than in periods of stability and it is also higher the smaller the number of banks in the panel. As shown before, there are rate-setting methodologies, such as the median and the mode, that are less vulnerable to fraud and manipulation, but the substantial difference between the observed Euribor rate and the recalculated rate is a major hindrance to methodological change. All these findings coincide with the conclusions of Eisl et al. (Citation2017).
Consequently, the Euribor Administrators should consider increasing the number of panel banks, so that the relative importance of submissions by each individual bank are diminished and the potential for manipulation is reduced. In addition, the Administrators must closely monitor the rate-setting process in times of crisis, as uncertainty in credit markets will intensify the effects of manipulation. As a last recommendation, it is proposed that the Administrators examine submission patterns and take quick action if suspicious patterns are detected and sustained over time. The use of novel techniques for the detection of patterns that could indicate cases of manipulation is recommended, such as Machine Learning techniques capable of discriminating possible manipulative and non-manipulative banks after learning from past data.
The main limitations of the study are that computationally advanced techniques have not been used to detect manipulation patterns and that the manipulation potential has been defined subjectively but following the literature.
Finally, future research on potential manipulation of benchmark rates could focus on the following questions. It would be worth trying to identify manipulative and non-manipulative banks with Machine Learning techniques applied to quote submission patterns. In addition, a research work such as the present one could be done on the Libor benchmark rate for the same study period.
Disclosure statement
No potential conflict of interest was reported by the authors.
Additional information
Funding
References
- Abrantes-Metz, R. (2012). Why and how should the Libor be reformed? (Working Paper No. 2094542). New York University. https://papers.ssrn.com/sol3/papers.cfm?abstract_id=2094542
- Abrantes-Metz, R., Kraten, M., Metz, A., & Seow, G. (2012). Libor manipulation? Journal of Banking & Finance, 36(1), 136–150.
- Ballester, L., Casu, B., & González-Urteaga, A. (2016). Bank fragility and contagion: Evidence from the bank CDS market. Journal of Empirical Finance, 38(Part A), 394–416. https://doi.org/https://doi.org/10.1016/j.jempfin.2016.01.011
- Boot, N., Klein, T., & Schinkel, M. P. (2017). Collusive benchmark rates fixing (DIW Berlin Discussion Paper No. 1715). Deutsches Institut fü rWirtschaftsforschung. SSRN (2018). https://doi.org/https://doi.org/10.2139/ssrn.3109308
- Brousseau, V., Chailloux, A., Durré, A. (2013). The LIBOR scandal: What’s next? A possible way forward. Retrieved June 17, 2019, from VOX CEPR Policy Portal, Columns, By Date, 2013, View all 47 columns: https://voxeu.org/article/libor-scandal-and-reform
- CFTC. (2012). RELEASE number 6289-12. Retrieved June 16, 2019, from CFTC, ‘News, Events & Podcasts’, Press Releases: https://www.cftc.gov/PressRoom/PressReleases/pr6289-12
- Chen, J. (2014). Libor’s poker: Interbank borrowing costs and strategic reporting. [Working Paper. 16413999]. Haas School of Business, UC Berkeley. https://pdfs.semanticscholar.org/1095/c9e84cb6b3173ab7e93baa9095b3427e687b.pdf
- Coulter, B., Shapiro, J., & Zimmerman, P. (2018). A mechanism for LIBOR. Review of Finance, 22(2), 491–520. https://doi.org/https://doi.org/10.1093/rof/rfx045
- Drudi, F., Durré, A., & Mongelli, F. (2012). The interplay of economic reforms and monetary policy: The case of the Eurozone. JCMS: Journal of Common Market Studies, 50(6), 881–898. https://doi.org/https://doi.org/10.1111/j.1468-5965.2012.02290.x
- Duffie, D., & Dworczak, P. (2018). Robust benchmark design (Working Paper No. 20540). National Bureau of Economic Research.
- Duffie, D., & Stein, J. (2015). Reforming LIBOR and other financial market benchmarks. Journal of Economic Perspectives, 29(2), 191–212. https://doi.org/https://doi.org/10.1257/jep.29.2.191
- Eisl, A., Jankowitsch, R., & Subrahmanyam, M. (2017). The manipulation potential of Libor and Euribor. European Financial Management, 23(4), 604–647. https://doi.org/https://doi.org/10.1111/eufm.12126
- EMMI. (2013). Euribor code of conduct. Retrieved June 16, 2019, from EMMI, Euribor, Euribor Reform, Overview of the Euribor Reform: Main Measures: https://www.emmi-benchmarks.eu/assets/files/Euribor_code_conduct.pdf
- EMMI. (2015). Consultative position paper on the evolution of Euribor. Retrieved June 16, 2019, from EMMI, Euribor, Euribor Reform, Overview of the Euribor Reform: Main Measures: https://www.emmi-benchmarks.eu/assets/files/Euribor_Paper.pdfc
- EMMI. (2017). Pre-live verification program outcome and way forward. https://www.emmi-benchmarks.eu/assets/files/D0246B-2017_PLVP%20public%20report%20and%20way%20forward_FINAL.pdf
- EMMI. (2018). Consultation paper on a hybrid methodology for Euribor. Retrieved June 18, 2019, from https://www.emmibenchmarks.eu/assets/files/D00832018 Consultation y brid Euribor_full.pdf
- EMMI. (2019). Retrieved June 2019, from EMMI, Euribor, Rates, Data: https://www.emmi-benchmarks.eu/euribor-org/euribor-rates.html
- European Banking Federation. (2012). Frequently asked questions about Euribor. https://www.emmi-benchmarks.eu/assets/files/Euribor FAQs Final.pdf
- European Central Bank. (2009). The financial crisis and the response of the ECB. Retrieved June 21, 2019, de ECB, Home, Media, Speeches, by date, 2009, June 12, 2009: https://www.ecb.europa.eu/press/key/date/2009/html/sp090612.en.html
- European Central Bank. (2019). Why are benchmark rates so important? Retrieved June 15, 2019, from European Central Bank, Explainers, Tell me more: https://www.ecb.europa.eu/explainers/tell-memore/html/benchmark_rates_qa.en.html
- European Commission. (2013). AMENDED1 - Antitrust: Commission fines banks €1.49 billion for participating in cartels in the interest rate derivatives industry. Retrieved June 16, 2019, from European Commission, Press services, Press releases and notifications, Press releases database(link): http://europa.eu/rapid/press-release_IP-13-1208_en.htm
- European Commission. (2016). Antitrust: Commission fines Crédit Agricole, HSBC and JPMorgan Chase €485 million for euro interest rate derivatives cartel. Retrieved June 16, 2019, from European Commission, Press services, Press releases and notifications, Press releases database(link): http://europa.eu/rapid/press-release_IP-16-4304_en.htm
- European Commission. (2019). Financial assistance to Portugal. Retrieved June 16, 2019, from Home, ‘Business, Economy, Euro’, ‘Economic and fiscal policy coordination’, ‘EU financial assistance’, ‘Which EU countries have received assistance?’: https://ec.europa.eu/info/business-economy-euro/economic-and-fiscal-policy-coordination/eu-financial-assistance/which-eu-countries-have-received-assistance/financial-assistance-portugal_en#
- European Securities Market Authority. (2013). Report on the administration and management of Euribor. Retrieved June 15, 2019, from https://www.esma.europa.eu/sites/default/files/library/2015/11/eba_bs_2013_002_annex_1.pdf
- European Securities Market Authority-European Banking Authority. (2013). ESMA-EBA principles for benchmark setting processes in the EU. https://www.esma.europa.eu/sites/default/files/library/2015/11/2013-659_esma-eba_principles_for_benchmark-setting_processes_in_the_eu.pdf
- Evans, D., Abrantes-Metz, R. (2012). Replacing the LIBOR with a transparent and reliable index of interbank borrowing: Comments on the Wheatley review of LIBOR initial discussion paper (Working Paper No. 620). Chicago Institute for Law and Economics. https://chicagounbound.uchicago.edu/cgi/viewcontent.cgi?article=1421&context=law_and_economics
- Financial Stability Board. (2014). Market participants group on reforming interest rate benchmarks final report. https://www.fsb.org/wp-content/uploads/r_140722b.pdf?page_moved=1
- Fletcher, G. G. S. (2016). Benchmark regulation. Iowa Law Review, 102, 1929.
- Frunza, M. (2013). Market manipulation and moral hazard: Can the Libor be fixed? Working Paper No. 2207703. Dartmouth College. http://ssrn.com/abstract=2207703
- Gandhi, P., Golez, B., Jackwerth, J., Plazzi, A. (2018). Financial market misconduct and public enforcement: The case of Libor Manipulation (Swiss Finance Institute Research Paper No. 17-53). Swiss Finance Institute. https://papers.ssrn.com/sol3/papers.cfm?abstract_id=2342075
- Hou, D., & Skeie, D. (2014). LIBOR: Origins, economics, crisis, scandal and reform (Staff Report No. 667). Federal Reserve Bank of New York.
- Jordanoska, A., & Lord, N. (2020). Scripting the mechanics of the benchmark manipulation corporate Scandals: The ‘Guardian’ paradox. European Journal of Criminology, 17(1), 9–30. https://doi.org/https://doi.org/10.1177/1477370819850124
- Kuo, D., Skeie, D., Vickery, J. (2012). A comparison of Libor to other measures of bank borrowing costs (Working Paper). Federal Reserve Bank of New York.
- Kyle, A., & Viswanathan, S. (2008). Price manipulation in financial markets how to define illegal price manipulation. American Economic Review: Papers & Proceedings, 98(2), 274–279.
- McConnell, P. (2013). Systemic operational risk: The LIBOR manipulation scandal. The Journal of Operational Risk, 8(3), 59–99.
- Mollenkamp, C., & Whitehouse, M. (2008, May 29). Study casts doubt on key rate. Wall Street Journal. https://www.wsj.com/articles/SB121200703762027135
- Snider, C., & Youle, T. (2012). The fix is in: Detecting portfolio driven manipulation of the Libor [Working Paper No. 2189015]. UCLA/University of Minnesota. http://ssrn.com/abstract=2189015
- Verstein, A. (2015). Benchmark manipulation. BCL Review, 56, 215.
- Wheatley, M. (2012a). The Wheatley review of Libor: Initial discussion paper. HM Treasury. https://assets.publishing.service.gov.uk/government/uploads/system/uploads/attachment_data/file/191763/condoc_wheatley_review.pdf
- Wheatley, M. (2012b). The Wheatley review of Libor: Final report. HM Treasury. https://www.gov.uk/government/publications/the-wheatley-review
- Youle, T. (2014). How much did manipulation distort the Libor? (Working Paper). University of Minnesota. https://editorialexpress.com/cgi-bin/conference/download.cgi?db_name=NASM2014&paper_id=995.
- Zorgati, I., Lakhal, F., & Zaabi, E. (2019). Financial contagion in the subprime crisis context: A copula approach. The North American Journal of Economics and Finance, 47, 269–282. https://doi.org/https://doi.org/10.1016/j.najef.2018.11.014