
 ?Mathematical formulae have been encoded as MathML and are displayed in this HTML version using MathJax in order to improve their display. Uncheck the box to turn MathJax off. This feature requires Javascript. Click on a formula to zoom.
Abstract
Co-patents are outcomes of R&D collaboration, which has been proven with higher-quality. Does this mean that high-quality patents should also extend their advantage to the technology market? Based on the transaction cost theory, we use the China National Intellectual Property Administration (CNIPA) database and logit model to explore the effect of co-ownership on firms’ patent commercialization and the factors of co-patents that affect their commercialization. Our findings illustrate that co-ownership has a negative impact on patent commercialization. In addition, the co-owner’s nature, country, and co-patent’s industry influence the commercialization of co-patents. Firstly, a company and a university or research institution’s co-owned co-patents are less likely to be commercialization than a company and a company co-owned co-patents. Secondly, multi-countries co-owned co-patents are less likely to be commercialization than a single-country co-owned co-patents. Thirdly, co-patents in high technology (high-tech) industries are less likely to be commercialization than co-patents in non-high-tech industries. This paper supports policymakers in implementing policies to promote the co-patents’ commercialization. Meanwhile, our paper suggests that to pursue the economic value of the R&D collaborative intellectual property fruits, R&D collaborative intellectual property fruits are not be encouraged to be applied as the co-patents.
1. Introduction
It is a significant phenomenon that increasingly more co-patents which jointly owned by two or more appliers were developed during the past 40 years (Belderbos et al., Citation2010; Hagedoorn, Citation2003). For example, in the United States, the proportion of the number of co-patents, in the total number of patent applications increased from 0.20% in the early 1980s to approximately 8.00% by the end of the 1990s (Kroll & Mallig, Citation2009). In China, the proportion of the number of co-patents in the total number of patent applications rose from 5.60% in 1985 to 7.40% in 2019.Footnote1 In Europe, the proportion of the number of co-patents in the total number of patent applications was 3.80% in 1978, while it was 6.30% in 2009 (Wade, Citation2014).
Given this significant phenomenon, scholars have provided insightful knowledge about it. The existing literature’s topics related to the co-patents mainly focus on the incentive for arranging the intellectual property in the R&D collaboration process as co-patents (Agostini & Caviggioli, Citation2015), co-patents’ high quality (Belderbos et al., Citation2014; Briggs, Citation2015; Hagedoorn et al., Citation2003; Paradiso & Pietrowski, Citation2009; Wade, Citation2014), and co-patents’ negative effect on company’s market value (Liu et al., Citation2019). As for the incentive for co-patents arising, firstly, during the R&D collaboration process, the collaborative technology and relationship are complex that may make it difficult to divide the innovation fruit clearly (Agostini & Caviggioli, Citation2015). Secondly, co-patent would like to be used as an important signal to manifest the desirable strategic alliance incentive between partners (Belderbos et al., Citation2014). As for the co-patents’ quality, the researching results indicated that co-patents have a positive impact on patent quality (Belderbos et al., Citation2014). Moreover, the multicountry co-ownership of a patent positively impacts patent quality than patents co-owned within a single country (Belderbos et al., Citation2014; Briggs, Citation2015; Hagedoorn et al., Citation2003; Paradiso & Pietrowski, Citation2009; Wade, Citation2014). As for the effect of co-patents on a company’s market value, Belderbos et al. (Citation2014) and Lv et al. (Citation2018) indicated the co-patent intensity is negatively correlated with a company’s market value, although a co-patent with a university is associated with a higher market value.
However, patents also have become popular ‘goods’ in the technology market, and how these co-patents behave in the technology market is still understudied. It is well known that innovations are crucial for economic growth, and the important value of an innovation is increasing in the economic value that it creates (Svensson, Citation2007; Tian et al., Citation2020). Wade (Citation2014) indicated that co-patents are high-quality innovation. From the perspective of increasing the circulation of high-quality intellectual property resources in the technology market and enlarge the public welfare and increase the economic value of patents (Pinto et al., Citation2019), co-patents are likely to be encouraged to flow actively (Briggs & Wade, Citation2014; Funk, Citation2013; Tvaronavičienė & Černevičiūtė, Citation2015). However, tension may exist between hope and reality. On the one hand, co-owners have the same right to own and exploit the invention on their behalf according to the patent law (Belderbos et al., Citation2014). This complex co-ownership induces a negative relationship between the number of co-patents and the owner’s market value (Belderbos et al., Citation2010; Citation2014; Lv et al., Citation2018). On the other hand, the law of most countries such as European countries, except for France, and the law of Japan, China, Korea, and Taiwan has a regulation that each patent’s owner needs prior consent with other co-owners in the co-patent’s utilization, sole license, exclusive license or assignment to a third party (Hashimoto et al., Citation2012), which may induce a constrained effect on the co-patent’s commercialization for inducing the intellectual property infringement risk, according to the transaction cost theory. In this situation, the effect of co-ownership on a firm’s patents’ commercialization and the factors of co-patents that affect their commercialization are worth a discussion. However, we rarely found any papers that refer to our topic in the existing literature.
In this study, we address this gap by taking Chinese co-patents as the case. We empirically explore the effect of co-ownership on a firm’s patents’ commercialization and the factors of co-patents that affect their commercialization by using the China National Intellectual Property Administration (CNIPA) database. This study finds that co-ownership has a negative impact on the commercialization of patents. In addition, the co-owner’s nature, country, and co-patent’s industry influence the commercialization of a co-patent. On the one hand, a company and a university or research institution’s co-owned co-patents are less likely to be commercialized on the technology market than a company and a company co-owned co-patents. On the other hand, multi-countries co-owned co-patents are less likely to be commercialized on the technology market than single-country co-owned co-patents. Moreover, co-patents belonging to high-tech industries are less likely to be commercialized on the technology market than co-patents belonging to non-high-tech industries.
Our study makes several contributions to the literature and provides implications for policymakers and practitioners. First, our research enlarges and enriches the commercialization theory of patents. We find that there exist different commercial degrees between co-patents and single-owner patents, which have never been referred to in the existing literature. Co-ownership has a negative impact on the commercialization of patents. The co-patents become inconsequential for commercialization and good quality as an advantage cannot play their role. Second, our research indirectly supports that applying the intellectual property of R&D collaboration fruits as co-patents is not a firm’s best option. The existing literature got this point on the aspect of co-patents’ negative effect on the company’s market value and performance. Our research strengthens this point from the perspective of patents’ commercialization, which gives the scholars and practitioners a new viewing angle to concern this problem. For practitioners, our paper provides advice for firms to properly arrange R&D achievement based on their commercial goals. At the same time, from the point of enlarging the public welfare and increasing the economic value of patents, our paper inspires policymakers to adjust patent administrative regulations to promote the flowing of co-patents in the technology market.
The structure of this paper is organized as follows. Following this introduction, we review the relevant literature and introduce four hypotheses in Section 2. Then, the methodology is shown in Section 3. In Section 4, the empirical results are presented and discussed. In Section 5, we make a robust analysis. Finally, we conclude the main findings and discuss some theoretical and managerial implications, limitations in the last section.
2. Literature review and hypotheses
Our hypotheses deduction is based on transaction cost theory. The transaction cost theory was first put forward by Coase et al. (Coase, Citation1937). It was mentioned that firms and the market traders need to pay extra costs due to asymmetric information in the real market. Besides, contracts in an uncertain environment are sometimes incomplete and must be frequently renegotiated.
According to the literature,‘patent’s commercialization’ means that the owner of the patent obtains income from a patent, which includes converting a patented technology generating new product and getting income in the internal firm, patent licensing, and patent sale (Svensson, Citation2007). Our paper focuses on patent’s licensing and sale, for it is difficult to observe and trace a firm using their patents to create income in the internal firm. Licensing means the patent’ owner gives the right to licensees for using the technology with some prepaid fee (Palomeras, Citation2007), but the patent’s ownership does not be changed. Differently, the sale means the patent owner loses all rights and the potential liabilities on the patent with a one-off payment (Serrano, Citation2010). The enforcement rules of co-patents in the world can be classified into two categories. In the United States and France, the patent laws relevant to co-patents and single -owner patents are nearly the same, and the commercialization of co-patents does not need prior consent with other co-owners in co-patents’ utilization, license, or assignment to a third party unless there is another existing agreement (Paradiso & Pietrowski, Citation2009). In European countries, except for France, and in Japan, China, Korea, and Taiwan, the patent laws relevant to co-patents and single-owner patents are different. Each patent’s owner needs to reach prior consent with other co-owners for the co-patent’s utilization, license, or assignment to a third party (Hashimoto et al., Citation2012). For example, Chinese patent law emphasizes that ‘unless other agreements exist, the co-owner can exploit the patent benefit alone in common licensing, and the benefit should be shared by all co-owners while other commercial modes need to obey the unanimous rule’.Footnote2 The license can be classified as the common license, the sole license, and the exclusive license. In China, sole licenses and exclusive licenses are the main license methods. As a result, the unanimous rule can limit the number of patent co-owners and prevent one partner from seeking benefits for itself at the expense of sacrificing other co-owners’ benefit by the sole license, exclusive license, and the patent trade. Based on these, Sun and Cao (Citation2011) declare that it has a negative effect on co-patents’ commercialization from the perspective of transaction costs. The transaction costs include the search cost, negotiation cost, contract cost, service cost, risk cost, etc. (Cheng & Lee, Citation2011; Chiles & McMackin, Citation1996; Dyer, Citation1997). First, the technical complexity of co-patents will increase the contract and service costs (Winkelbach & Walter, Citation2015). Second, if one co-owner wants to license or sell a co-patent, he must obtain an agreement with another co-owner of this co-patent according to the patent law or he will face the intellectual property infringement risk. In this process, a negotiation cost will be incurred, and the unanimous rule would greatly increase the negotiation cost of commercialization because different co-owners have different opinions on the economic value of co-patents and different attitudes on patent licensing and sale. Third, the co-ownership of co-patents can induce an uncertainty risk due to asymmetric information for buyers or licensees and reduce their desire to buy or obtain licensing (Belderbos et al., Citation2014; Lv et al., Citation2018). Compared to a single-owner patent, the contract, service, and negotiation costs of co-patents are higher, which means that the transaction cost of a co-patent is higher than the transaction cost of a single-owner patent. Thus, we formulate the following hypothesis.
Hypothesis 1: Co-patents will be less likely to be commercialized than single-owner patents.
The types of co-owners are diversified (Belderbos et al., Citation2014), and different organizations have different objectives for R&D collaboration and different attitudes on the commercialization of co-patents. The companies, universities, and research institutions are the core force on the road of technology innovation.
As for the co-owners that are companies and university/research institutions, a contradiction always exists on the first option about the academic and commercial demands. Commercial profit is the main goal for companies, which usually avoid high risky research with strong commercial purposes, and it tends to make the R&D achievements commercialize as soon as possible. Although university technology transfer to the sustainable development of universities and society is important (Paniccia & Baiocco, Citation2018), universities/research institutions tend to do research projects in a long period and less predictability (Gregorio & Shane, Citation2003), which means that the commercialization pace of co-patents is slowed down for further continuous deep study. Moreover, universities/research institutions are enthusiastic about publishing their breakthrough ideas as quickly as possible, while firms’ commercialization incentives need the breakthrough hidden and delay published (Blumenthal et al., Citation1997; Stern, Citation2004). As a result, as for the universities/research institutions, either there will be a high negotiation cost for co-patent commercialization or universities/research institutions will not agree to make the co-patent commercialization at all. Thus, we formulate the following hypothesis:
Hypothesis 2: The company and universities/research institutions’ co-patents are less likely to be commercialized than co-patents among companies.
From the perspective of co-owners’ geographical distribution, co-patents can be classified as multi-countries co-owned and single country co-owned (Briggs, Citation2015). First, co-patents have not only more claims and backward citations within and outside of the firm but also more novel technology combinations (Lv et al., Citation2018), which is more likely to induce an intellectual property infringement problem (Holbrook, Citation2016; Lemley, Citation2005), because different countries patent laws are different and have a legal territory limit (Torremans, Citation2016). Once the co-patent is commercialized, the partners will worry about the patent infringement problem induced from the unfamiliar foreign environment. Second, if the co-patents of multi-countries co-owned do not apply for the protection from the foreign country according to the Paris Convention approach or the Patent Cooperation Treaty,Footnote3 their commercialization will be limited. Third, because of distance, the co-patents of multi-countries co-owned will have a higher communication cost (Gao et al., Citation2015). These reasons will greatly increase the negotiation cost and do not benefit co-patents’ commercialization. Thus, we formulate the following hypothesis:
Hypothesis 3: Multi-countries’ co-owned co-patents are less likely to be commercialized than a single country’s co-owned co-patents.
From the perspective of industries, co-patents can be divided into belonging to high-tech industries and belonging to non-high-tech industries. High-tech industries always represent the advanced technologies developed and are an important factor for the driving force of economic development and upgrading the industrial structure in a science and technology-based economy. The government tends to give some political and financial support for these high-tech industries. For example, in China, the Torch Program for high-tech industries has been carried out since the 1980s, of which, the subsidy was given to promote the R&D actives, and about 60.17 billion Yuan are spent during the past three decades (Hong et al., Citation2016). The co-patents application is a strong signal for R&D collaboration actives. The co-patents which belong to the high-tech industries will bring more attraction for government subsidy and political support. Due to this, the co-patent’s owner tends to hold it rather than license or trade it. Thus, we formulate the following hypothesis:
Hypothesis 4: Co-patents belonging to high-tech industries are less likely to be commercialized than co-patents belonging to non-high-tech industries.
3. Materials and methods
3.1. Data sources
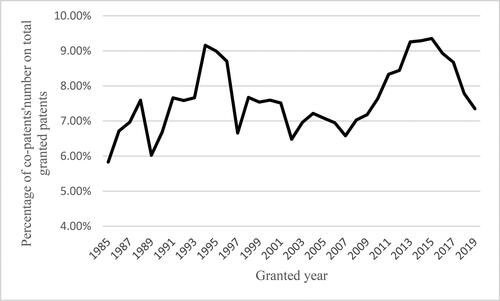
Empirical data come from the China National Intellectual Property Administration (CNIPA). The Patent Law of China was implemented in 1985, and the CNIPA began to formally record the patent’s information this year.Footnote4 We downloaded data on the internet http://epub.sipo.gov.cn/gjcx.jsp. After choosing the application year interval from 1985 to 2019, the patent’s detailed information is shown on the net. Then we manual sort the information of patents we need, such as applied number, applier’ name, granting year, the number of applicants, classification, PCT, law information, etc. If the number of applicants is two or more, a patent is regarded as a co-patent, and otherwise, it is a single-owner patent. We made the basic statistics of co-patents according to the CNIPA. The total number of granted invention co-patents is 212,113 from 1985 to 2019. The percentage of co-patents on the total granted invention patents fluctuates between 5% and 10% from 1985 to 2019, which is shown in .
Figure 1. Percentage of co-patents in total granted invention patents, 1985–2019.
The number of co-patent applicants is between 2 and 27. The percentage of co-patents whose number of applicants is 2 is 82.32%, which is the largest proportion in the total granted co-patents. The co-patents that have three applicants have a percentage of approximately 13.32%, and other co-patents have a percentage of approximately 4.36%, which is shown in . In our paper, we choose the co-patents whose applicants’ number is 2 to finish our empirical analysis because this choice represents the main group and is feasible for the control variables.
Table 1. The distribution of the number of co-patent applicants and co-owner’s country.
The co-owners’ country can be divided into domestic and foreign cooperation and domestic and domestic cooperation, which is also shown in Table1. Domestic-domestic cooperation co-patents have the largest proportion, which is 83.15%, while the proportion of domestic -foreign cooperation co-patents is 3.21%.
The co-owners’ nature can be classified into the cooperation between companies, between a company and a university or research institution, between a company and an individual, between individuals, and between an individual and a university or research institution, etc. The distribution of co-owners’ nature is shown in . In this group, the company-company cooperative co-patents have the largest proportion, which is 50.19%. The company-university/research institution cooperative co-patents have the second-ranked proportion, which is 25.83%. In this paper, our focus is discussing the joint company co-patents. This choice represents the main group and is feasible for the control variables.
Table 2. The distribution of the cooperative co-owner’s nature.
For co-patents, the patent licensing data begins in 2002, and patent trading data begins in 2007. Our paper chooses 2002–2019 as the observation year window. To verify Hypotheses 1, we choose the co-patents whose applicants’ number is 2 and the applicants including companies as our treated group samples. After dropping invalid data such as unpaid, expired, and invalid patents before 2002, we obtain 145,089 co-patents as our treated group samples. To detect the influence of co-ownership on the patents’ commercialization, we compare co-patent commercialization with single-owner patents. We use patent variables such as the number of claims, the patent scope, PCT. application, and some firm variables, such as firm size as our chosen criteria, and a nearest-neighbor 1:1 Propensity Score Matching (PSM) is used to identify our untreated group sample. Then we combined the treated and untreated group and convert these groups as the patent-year observations sample from 2002 to 2019. We let a patent stay in our sample if this patent does not expire, be invalid, licensed, or traded before and in the observation year, otherwise, this year is regarded as its deadline year and it will be removed in the subsequent observation years. At last, 4,865,588 patent-year observations from 2002 to 2019 is our final sample.
To verify Hypotheses 2–4, we select the co-patents whose co-owners’ nature is between companies and between a company and a university/research institution. Besides, we select the co-patents whose co-owners’ country types are domestic and foreign, and domestic and domestic. We get 2,000,884 patent-year observations from 2002 to 2019 are our final sample patents.
3.2. Variables
3.2.1. Dependent variable
We use the status as the dependent variable to describe the condition of a patent and it is set as the dummy variable. We set status as 0 when a patent is held by the firm in the observation year; we set status as 1when a patent is sold or licensed by the firm in the observation year.
3.2.2. Independent variables
We set the dummy variable co-patent, co-owner’s nature, co-owner’s country, high-tech industries as independent variables. If the number of patent applicants is equal to two, this patent is regarded as a co-patent and is coded as 1; otherwise, it is coded as 0. If the co-patents are co-owned between companies, the co-owners’ nature is coded as 0. If the co-patents are co-owned by a company and a university or research institution, the co-owners’ nature is coded as 1. The co-owners’ country is coded as 0 if the co-patent is co-owned by a single country or is coded as 1 if the co-patent is co-owned by multi-countries. If the co-patents belong to high-tech industries, the high-tech industries is coded as 1; otherwise, it is coded as 0. Here, the high-tech industries are identified according to the classification criteria published by the China Science and Technology Statistics website.Footnote5
3.2.3. Control variables
Co-patents are co-owned between companies and between a company and a university/research institution. If the co-patents’ co-owners are companies, we control the first applicant’s variables. If the co-patents’ co-owners are a company and a university/research institution, we control the company’s variables.
Patent scope (Scope): Patent scope reflects the broadness of the technological range which the patent covers (Palomeras, Citation2007). The patent scope is calculated by taking the number of patent technological classifications based on the international patents classification (IPC) (Lerner, Citation1994).
Number of patent claims (Claims): Claims are essential to a patent as they prescribe the limits of what is attempted to be protected and it can reflect the patent’s value, which will influence the patent’s commercialization (Tong & Frame, Citation1994).
Core vs. non-core technologies (Core). Firms are more likely to license or sell their non-core technologies (Jeong et al., Citation2013). We use the patent share (PS) and the firm’s revealed technology advantage (RTA) to identify the patent belong to the core or non-core technologies (Ljungberg et al., Citation2013). PS and RTA are calculated as EquationEquations (1)(1)
(1) and Equation(2)
(2)
(2) :
(1)
(1)
(2)
(2)
where Pij is the number of valid patents in the technological field i owned by firm j.
The core vs. non-core technologies is the dummy variable. If the patent share is more than 3% and the RTA is more than 2%, the technology is the core technology and set as 1. Otherwise, technology is non-core technology and set as 0 (Gambardella et al., Citation2007).
Patent Cooperation Treaty Application (PCT): The Patent Cooperation Treaty (PCT.) is the international treaty that defines the patent rights granted between the contracting states. A PCT. patent will be popular in the international technology market (Sternitzke, Citation2009). If a patent has PCT, it is coded as 1, otherwise, it is coded as 0.
Competition (Competition): Competitive structure like a firm’s monopolistic position or perfect competition in the technology market may affect the patent commercialization. Competition is measured as the share of the patents held by the top four applicants in each four-digit IPC patent class (Gambardella et al., Citation2007).
Firm size (portfolio): Gambardella et al. (Citation2007) regarded that the firm size will impact the commercialization of patents. The firm size is positive correction with the patent portfolio size (Arora & Fosfuri, Citation2003), and we calculate this variable by taking the number of valid patents owned by the firm in the observation year (Chang, Citation2011).
Year dummy is set to control the time-fixed effects. Technology class dummy is set for controlling the technology domain effects. Industry dummy is set for controlling the industry effect. We control the patent’s first industry.
To minimize the influence of extreme observations, all continuous variables are winsorized at the 1% level in both tails. A full list of the variables and their brief descriptions are presented in .
Table 3. The variables and their brief descriptions.
3.3. Model development
In our paper, the dependent variable is a dummy with two categories, so we choose the logit model, which is seen in EquationEquation (2)(2)
(2) to finish our empirical analysis (Schmidt & Strauss, Citation1975). In this model, we set those patents which are held by the firm as a reference group and the coefficients of patents commercialization (license or sale) are the comparative results based on this reference group.
(3)
(3)
Selection bias in the treated sample may bring the endogenous problem, to relieve this problem, we follow the Heckman two-step method (Heckman, Citation1979). We choose the government implementing policy for supporting the medium- and long-term scientific and technology-developing national programFootnote6 as our instrument variable, which affects whether the focal patent is the co-patent but does not influence the commercialization of the focal patent. In this policy, industry, universities, and research institutions are encouraged, and subsidies are supported for R&D collaboration and co-innovation, which will promote R&D collaboration and the creation of co-patents. We set this instrument variable (IV) as the dummy variable. This policy was implemented in 2006. We code this dummy variable 1 if the observation year was after or included 2006, and otherwise, we code it 0.
4. Results
shows the descriptive statistics and correlations for all variables used in the full sample. The correlation coefficients are all below 0.3, indicating that there is no multicollinearity problem.
Table 4. Descriptive statistics (full sample).
presents the results of the logit regression models of the full sample to test Hypotheses 1, which are shown below.
Table 5. Results of the logit (full sample).
Hypothesis 1 predicts that compared to single-owner patents, co-patents are less likely to be commercialized on the technology market. In Model 1, the result of the probit regression is reported. The instrument variable has a significant and positive influence on the likelihood of whether a firm will put a patent as a co-patent, which indicates that we choose a proper instrument variable. Models 2 are the baseline models in which the control variables and inverse Mills ratio are involved. The coefficients of control variables are all significant. In Models 3, the independent variable co-patent and inverse Mills ratio are added. The coefficients on co-patents are significantly negative (β = −0.286, p < 0.01). Hypothesis 1 is supported.
Hypotheses 2–4 are developed based on the within-group difference of the treated groups. presents the descriptive statistics and correlations for all variables used in the treated group samples. The correlation coefficients are all below 0.6, indicating that there is no multicollinearity problem.
Table 6. Descriptive statistics (treated sample).
presents the results of the logit regression of the treated sample to test Hypotheses 2–4, which is shown below.
Table 7. Results of the logit (treated sample).
Hypothesis 2 predicts that compared to the co-patents whose co-owners are companies, the co-patents whose co-owners are a company and a university or research institution are less likely to be commercialized on the technology market. Model 4 is the baseline model that only includes the control variables. The coefficients of all control variables are significant. In Model 5, the independent variable of the co-owner’s nature is added to test Hypotheses 2. The coefficients of the co-owner’s nature are negative and significant in Model 5 (β = −0.217, p < 0.01). Hypothesis 2 is supported.
Hypothesis 3 predicts that compared to single-country co-owned co-patents, multi-countries’ co-owned co-patents are less likely to be commercialized on the technology market. In Model 6, the independent variable of the co-owner’s country is added. The coefficients of the co-owner’s country are negative and significant in Model 6a (β = −0.380, p < 0.01). Hypothesis 3 is supported.
Hypothesis 4 predicts that compared to co-patents belonging to non-high-tech industries, co-patents belonging to high-tech industries are less likely to be commercialization on the technology market. In Model 7, the independent variable of the high-tech industries is added. The coefficients of the high-tech industries are negative and significant in Model 7 (β = −2.125, p < 0.01). Hypothesis 4 is supported.
5. Robustness analyses
We conducted robustness tests for our main results using an alternative sample and alternative model selection. First, we use a nearest-neighbor 1:3 PSM instead of the previous 1:1 PSM to identify our untreated group sample to keep our sample different. Second, we change the previous model to the multinomial logit model (Schmidt & Strauss, Citation1975) which is seen in EquationEquation (4)(4)
(4) . We code our dependent variable as three categories instead of two alternatives of dummy variables. It is coded as 0 when a patent is held by the firm in the observation year; it is coded as 1 when a patent is licensed in the observation year; it is coded as 2 when a patent is sold in the observation year. If a patent is licensed or sold in the same year, we choose the early date event as the patent’s condition. Some patents are licensed or sold several times, and we choose their first licensed or sold event as our observed event. Patents being held are still chosen as a reference group. The coefficients of the licensed or sold category are the respectively comparative results based on this reference group. The model is shown in EquationEquation (4)
(4)
(4) . These results are shown in (full samples) and (treated samples), from which we can observe that these results support all our hypotheses.
(4)
(4)
where j = 1 is the reference group.
Table 8. Robustness check results of the mlogit (full sample).
Table 9. Robustness check results of the mlogit (treated sample).
6. Conclusion and discussion
Our empirical analysis result supports our hypotheses and answers the previously noted questions of what is the influence of co-ownership on patents’ commercialization and which factors of co-patents affect their commercialization. The results show that co-ownership has a negative impact on patents’ commercialization. In addition, a company and a university or research institution’s co-owned co-patents are less likely to be commercialization on the technology market than company and company co-owned co-patents. Furthermore, multi-countries co-owned co-patents are less likely to be commercialization on the technology market than single-country co-owned co-patents. At the same time, co-patents belonging to the high-tech industries are less likely to be commercialization on the technology market than co-patents belonging to the non-high-tech industries.
Our study delivers contributions to the extant literature (Lemley & Feldman, Citation2016; Love et al., Citation2018; Motohashi, Citation2008; Wu et al., Citation2015). On the one hand, our paper extends the patents’ commercialization literature by exploring the co-patent’s license and trade. The licensing and selling of single-owner patents have been studied extensively (Banerjee & Poddar, Citation2019; Chintagunta et al., Citation2018; Gambardella et al., Citation2007; Jeong et al., Citation2013; Srivastava & Wang, Citation2015). However, some special features of co-patents could make co-patents’ commercialization different from single-owner patents. These details are less likely to be referred to in the extant literature. Our paper filling this gap explores this problem. On the other hand, our conclusion firstly indirectly supports the existing literature’ idea that arranging the R&D collaborative fruits as co-patents is not the best option for companies from the perspective of commercialization (Belderbos et al., Citation2010; Hagedoorn, Citation2003). The existing literature illustrates this point from co-patent’s negative effect on the company’s market value and performance but rarely refer to the patents’ commercialization.
This paper also has important implications for policymakers and practitioners. Firstly, our conclusion can give inspiration for policymakers. Having a high quality, co-patents should be encouraged to flow actively for enlarging the public welfare and increase the economic value of patents. But our result indicated that co-patents cannot commercialize as well as single-owned patents. Here, we should not ignore the effect the government policy. Policymakers should implement some policies to promote the co-patents’ commercialization. For example, the ‘unanimity principle’ of co-patents’ commercialization can be relieved or deleted in the patent law. Also, some policies can be made to encourage the co-patents’ flowing, especially for co-patents belonging to high-tech industries. Secondly, for the practitioners, our paper suggests that for pursuing the economic value of the R&D collaborative fruits, R&D collaborative intellectual property fruits are not be encouraged to be applied as the co-patents. Instead, it is encouraged to be applied as the single-owner patent. However, sometimes, it is unavoidable to apply R&D collaborative fruits as a co-patent, in this condition, applying co-patent with a larger patent scope and having Patent Cooperation Treaty (PCT.) will facilitate their commercialization to some extent. Furthermore, if some companies just want to federally apply co-patents for getting the government’s policy or subsidy supporting and don’t have an interest in the patent’s commercialization, it is better to choose a university/research institution as the R&D collaborator, compared to firms.
This study is not without limitations. Firstly, with our present database, it is difficult to observe and trace the company’s co-owned technology transforms into income in the internal company. Thus, in this paper, we mainly talk about the co-patents’ commercialization with license and sale in the external technology market. In further research, we plan to use a questionnaire to explore the co-patents’ internal commercialization. Secondly, as we have mentioned in this paper, the patent laws relevant to commercialization are different between China, Europe, and the United States. So, it is necessary to make a comparison on co-patents’ commercialization with the situation in the USA, Europe, and China, which can enrich our systematic research about our topic, the ‘commercialization of co-patents’. However, this comparison research needs comparable datasets with the same sample framework and the definitions of variables. So, a new dataset and framework are needed to build. We will make this work in future studies.
Disclosure statement
The authors declare no conflict of interest.
Additional information
Funding
Notes
1 The data come from the China National Intellectual Property Administration (CNIPA).
2 This regulation comes from article 15 of the patent law of the People's Republic of China (amended in 2008).
3 Information source: https://www.rws.com/insights/the-paris-convention-versus-the-pct/
4 Information source: http://cponline.cnipa.gov.cn/
6 Information source: http://www.gov.cn/jrzg/2006-02/09/content_183787.htm
References
- Agostini, L., & Caviggioli, F. (2015). R & D collaboration in the automotive innovation environment: An analysis of co-patenting activities. Management Decision, 53(6), 1224–1246.
- Arora, A., & Fosfuri, A. (2003). Licensing the market for technology. Journal of Economic Behavior Organization and Environment, 52(2), 277–295.
- Banerjee, S., & Poddar, S. (2019). To sell or not to sell’: Licensing versus selling by an outside innovator. Economic Modelling, 76, 293–304. https://doi.org/https://doi.org/10.1016/j.econmod.2018.08.006
- Belderbos, R., Cassiman, B., Faems, D., Leten, B., & Looy, B. V. (2014). Co-ownership of intellectual property: Exploring the value-appropriation and value-creation implications of co-patenting with different partners. Research Policy, 43(5), 841–852. https://doi.org/https://doi.org/10.1016/j.respol.2013.08.013
- Belderbos, R., Faems, D., Leten, B., & Looy, B. V. (2010). Technological activities and their impact on the financial performance of the firm: Exploitation and exploration within and between firms. Journal of Product Innovation Management, 27(6), 869–882. https://doi.org/https://doi.org/10.1111/j.1540-5885.2010.00757.x
- Blumenthal, D., Campbell, E. G., Anderson, M. S., Causino, N., & Louis, K. S. (1997). Withholding research results in academic life science. Evidence from a national survey of faculty. JAMA, 277(15), 1224–1228. https://doi.org/https://doi.org/10.1001/jama.1997.03540390054035
- Briggs, K. (2015). Co-owner relationships conducive to high quality joint patents. Research Policy, 44(8), 1566–1573. https://doi.org/https://doi.org/10.1016/j.respol.2015.05.011
- Briggs, K., & Wade, M. (2014). More is better: Evidence that joint patenting leads to quality innovation. Applied Economics, 46(35), 4370–4379. https://doi.org/https://doi.org/10.1080/00036846.2014.957446
- Chang, S. B. (2011). Using patent analysis to establish technological position: Two different strategic approaches. Technological Forecasting & Social Change, 79(1), 3–15.
- Cheng, C.-F., & Lee, A.-H. (2011). The influences of relationship marketing strategy and transaction cost on customer satisfaction, perceived risk, and customer loyalty. African Journal of Business Management, 5(13), 5199–5209.
- Chiles, T. H., & McMackin, J. F. (1996). Integrating variable risk preferences, trust, and transaction cost economics. Academy of Management Review, 21(1), 73–99. https://doi.org/https://doi.org/10.5465/amr.1996.9602161566
- Chintagunta, P. K., Qin, M. S., & Vitorino, M. A. (2018). Licensing and price competition in tied-goods markets: An application to the single-serve coffee system industry. Marketing Science, 37(6), 883–911. https://doi.org/https://doi.org/10.1287/mksc.2018.1114
- Coase, R. H. (1937). The nature of the firm. Economica, 4(16), 386–405. https://doi.org/https://doi.org/10.1111/j.1468-0335.1937.tb00002.x
- Dyer, J. H. (1997). Effective interim collaboration: How firms minimize transaction costs and maximise transaction value. Strategic Management Journal, 18(7), 535–556. https://doi.org/https://doi.org/10.1002/(SICI)1097-0266(199708)18:7<535::AID-SMJ885>3.0.CO;2-Z
- Funk, M. (2013). Patent sharing by US universities: An examination of university joint patenting. Economics of Innovation & New Technology, 22(4), 373–391.
- Gambardella, A., Giuri, P., & Luzzi, A. (2007). The market for patents in Europe. Research Policy, 36(8), 1163–1183. https://doi.org/https://doi.org/10.1016/j.respol.2007.07.006
- Gao, X., Chen, Y., Song, W., Peng, X., & Song, X. (2015). Regional university-industry knowledge flow: A study of Chinese academic patent licensing data. Open Journal of Social Sciences, 03(02), 59–73. https://doi.org/https://doi.org/10.4236/jss.2015.32009
- Gregorio, D. D., & Shane, S. (2003). Why do some universities generate more start-ups than others? Research Policy, 32(2), 209–227.
- Hagedoorn, J. (2003). Sharing intellectual property rights—An exploratory study of joint patenting amongst companies. Industrial and Corporate Change, 12(5), 1035–1050. https://doi.org/https://doi.org/10.1093/icc/12.5.1035
- Hagedoorn, J., Kranenburg, H. V., & Osborn, R. N. (2003). Joint patenting amongst companies: Exploring the effects of inter-firm R&D partnering and experience. Managerial & Decision Economics, 24(2/3), 71–84.
- Hashimoto, T., Tanaka, Y., & Adrian, A. (2012). Managing joint R&D: An investigation into joint patent applications in Japan, USA and Europe. International Journal of Technology Transfer & Commercialisation, 11(3/4), 137–155.
- Heckman, J. J. (1979). Sample selection bias as a specification error. Econometrica, 47(1), 153–161. https://doi.org/https://doi.org/10.2307/1912352
- Holbrook, T. R. (2016). Boundaries, extraterritoriality, and patent infringement damages. Notre Dame L. Rev, 92(4), 1745–1794.
- Hong, J., Feng, B., Wu, Y., & Wang, L. (2016). Do government grants promote innovation efficiency in China’s high-tech industries? Technovation, 57, 4–13.
- Jeong, S., Lee, S., & Kim, Y. (2013). Licensing versus selling in transactions for exploiting patented technological knowledge assets in the markets for technology. The Journal of Technology Transfer, 38(3), 251–272. https://doi.org/https://doi.org/10.1007/s10961-012-9252-0
- Kroll, H., & Mallig, N. (2009, November). Regional patterns of co-patenting by technological fields, a Europe - US comparison. Atlanta Conference on Science and Innovation Policy. IEEE.
- Lemley, M. A. (2005). Inducing patent infringement. UC Davis Law Review, 39, 225.
- Lemley, M. A., & Feldman, R. (2016). Patent licensing, technology transfer, and innovation. American Economic Review, 106(5), 188–192. https://doi.org/https://doi.org/10.1257/aer.p20161092
- Lerner, J. (1994). The importance of patent scope: An empirical analysis. Veterinary Record, 25(2), 319–333.
- Liu, W., Tao, Y., Yang, Z., & Bi, K. (2019). Exploring and visualizing the patent collaboration network: A case study of smart grid field in China. Sustainability, 11(2), 465–483. https://doi.org/https://doi.org/10.3390/su11020465
- Ljungberg, D., Bourelos, E., & McKelvey, M. (2013). Academic inventors, technological profiles and patent value: An analysis of academic patents owned by Swedish-based firms. Industry & Innovation, 20(5), 473–487. https://doi.org/https://doi.org/10.1080/13662716.2013.824193
- Love, B. J., Richardson, K., Oliver, E., & Costa, M. (2018). An empirical look at the brokered market for patents. Market for Patents, 83(2), 359–410.
- Lv, D. D., Zeng, P., & Lan, H. (2018). Co-patent, financing constraints, and innovation in SMEs: an empirical analysis using market value panel data of listed firms. Journal of Engineering and Technology Management, 48, 15–27.
- Motohashi, K. (2008). Licensing or not licensing? An empirical analysis of the strategic use of patents by Japanese firms. Research Policy, 37(9), 1548–1555. https://doi.org/https://doi.org/10.1016/j.respol.2007.12.014
- Palomeras, N. (2007). An analysis of pure-revenue technology licensing. Journal of Economics & Management Strategy, 16(4), 971–994. https://doi.org/https://doi.org/10.1111/j.1530-9134.2007.00164.x
- Paniccia, P., & Baiocco, S. (2018). Co-evolution of the university technology transfer: Towards a sustainability-oriented industry. Sustainability, 10(12), 4675–4704. https://doi.org/https://doi.org/10.3390/su10124675
- Paradiso, R. J., & Pietrowski, E. (2009). Dilemmas of joint patent ownership. New Jersey Law Journal, 197, 912–913.
- Pinto, M. M. A., Kovaleski, J. L., Yoshino, R. T., & Pagani, R. N. (2019). Knowledge and technology transfer influencing the process of innovation in green supply chain management: A multicriteria model based on the DEMATEL method. Sustainability, 11(12), 3485–3518. https://doi.org/https://doi.org/10.3390/su11123485
- Schmidt, P., & Strauss, R. P. (1975). The prediction of occupation using multiple logit models. International Economic Review, 16(2), 471–486. https://doi.org/https://doi.org/10.2307/2525826
- Serrano, C. J. (2010). The dynamics of the transfer and renewal of patents. The RAND Journal of Economics, 41(4), 686–708. https://doi.org/https://doi.org/10.1111/j.1756-2171.2010.00117.x
- Srivastava, M. K., & Wang, T. (2015). When does selling make you wiser? Impact of licensing on Chinese firms’ patenting propensity. The Journal of Technology Transfer, 40(4), 602–628. https://doi.org/https://doi.org/10.1007/s10961-014-9354-y
- Stern, S. (2004). Do scientists pay to be scientists? Management Science, 50(6), 835–853. https://doi.org/https://doi.org/10.1287/mnsc.1040.0241
- Sternitzke, C. (2009). The international preliminary examination of patent applications filed under the Patent Cooperation Treaty—A proxy for patent value? Scientometrics, 78(2), 189–202. https://doi.org/https://doi.org/10.1007/s11192-007-1837-x
- Sun, M. J., & Cao, X. M. (2011). Patent co-ownership——Economic analysis of transaction and license. Journal of University of Science & Technology Beijing, 22(4), 116–119.
- Svensson, R. (2007). Commercialization of patents and external financing during the R&D phase. Research Policy, 36(7), 1052–1069.
- Tian, X. L., Kou, G., & Zhang, W. K. (2020). Geographic distance, venture capital and technological performance: Evidence from Chinese enterprises. Technological Forecasting and Social Change, 158, 120155. https://doi.org/https://doi.org/10.1016/j.techfore.2020.120155
- Tong, X., & Frame, J. D. (1994). Measuring national technological performance with patent claims data. Research Policy, 23(2), 133–141. https://doi.org/https://doi.org/10.1016/0048-7333(94)90050-7
- Torremans, P. (2016). Jurisdiction for cross-border intellectual property infringement cases in Europe. Common Market Law Review, 53(6), 1625–1645.
- Tvaronavičienė, M., & Černevičiūtė, J. (2015). Technology transfer phenomenon and its impact on sustainable development. Journal of Security and Sustainability Issues, 5(1), 87–97. https://doi.org/https://doi.org/10.9770/jssi.2015.5.1(7)
- Wade, M. (2014). More is better: evidence that joint patenting leads to quality innovation. Applied Economics, 46(35), 4370–4379.
- Winkelbach, A., & Walter, A. (2015). Complex technological knowledge and value creation in science-to-industry technology transfer projects: The moderating effect of absorptive capacity. Industrial Marketing Management, 47, 98–108. https://doi.org/https://doi.org/10.1016/j.indmarman.2015.02.035
- Wu, Y., Welch, E. W., & Huang, W.-L. (2015). Commercialization of university inventions: Individual and institutional factors affecting licensing of university patents. Technovation, 36-37, 12–25. https://doi.org/https://doi.org/10.1016/j.technovation.2014.09.004