
 ?Mathematical formulae have been encoded as MathML and are displayed in this HTML version using MathJax in order to improve their display. Uncheck the box to turn MathJax off. This feature requires Javascript. Click on a formula to zoom.
Abstract
This paper examines dynamic spillovers and connectedness between global covid-19 occurrences and the Global FX market. We specifically analyse the spillovers using six most traded currency pairs in the world utilizing daily data for the period December 31, 2019 to April 10, 2020. The paper employs the Diebold and Yilmaz (DY hereafter) (2009, Citation2012) approach to compute the spillover indexes. We also consider the rolling window analyses to capture the secular and cyclical movement in the financial markets over the period of consideration. Our findings indicate high degree of interdependence between the global covid-19 occurrences and returns volatility of the majorly traded currency pairs. Interestingly, both the returns and volatility spillover indexes exhibit both trend and bursts over the period of pandemic. Our results are robust to the different VAR lag structure. Policymakers are advised to monitor the effects of global COVID-19 announcement and assess the net effect of financial market volatility on the behaviour of the global FX markets in order address new and enhanced risks caused by the upsurge of the COVID-19 pandemic.
1. Introduction
With the advent of the global COVID-19 pandemic in December 2019, various world economies have been adversely affected. Occurrences such as plummeting equities, crippling global economic activities and surge in market volatility amongst others have become prevalent across the world (Baker et al., Citation2020). Assessing the economic impact of this crisis becomes expedient from a policy standpoint as the crisis unfolds with extreme speed.
The outbreak of the COVID-19 pandemic has been unprecedented and its effect on the world economy has been severe. This can be categorized into three main channels namely; Demand Shock, triggered by quarantines, travel restrictions, and global disruption which have hampered consumer goods & services, tourism, hospitality, and more; Supply Shock, evident from disruptions in global supply chains without a clear resolution point and Financial Shock, as limited cash flow and liquidity threaten to sink enterprises in an economic environment where the global financial safety net is strained and international cooperation is in declining health (see Grenier, Citation2020).
A report by Zeidan (Citation2020) indicates rich nations have spent over $9 trillion on tackling the economic fallout from COVID-19 with more spending on the way as governments try to ensure there is a functioning economy after the pandemic. The damage done is projected to surpass the financial crisis and maybe even the Great Depression proving to be the worst economic crisis in the last 70 years. The outbreak of the COVID-19 pandemic has been unprecedented and its effect on world market has been reflected in foreign exchange market. Surprisingly, the dollar has been a safe haven for everyone. However, emerging markets have borne the brunt of the rush for dollars. For example, the British pound fell more than 10 percent, Indonesia's rupiah lost almost 14 percent of its value since the beginning of the year, the Russian rouble and Mexican peso have lost about 20 percent of their value, amongst others. Moreso, the increasing level of global financial integration accentuated by rapid technological advances have significantly enhanced the processing of financial services globally. While this facilitates trade among nations, its associated risks and uncertainties also pose a major concern. More prominently, when financial markets become more internationally integrated, the chances of spillover effect or contagion effect become more eminent (see Fasanya & Akinde, Citation2019; Salisu et al., Citation2018). Motivated by these concerns, this study examines the dynamic spillovers and connectedness between covid-19 occurrences and returns of majorly traded currency pairs in the world.
A number of researches have been conducted on volatility movement among various asset/stock classes and their reactions to macro news and global crisis with most focusing on the US and European stock markets. However, with the recent emergence of the COVID-19 pandemic, we are presented with a new opportunity to investigate the dynamic spillovers and connectedness between covid-19 occurrences and returns of the world’s most traded currency pairs as little or no study have been carried out on this. It is the limited nature and paucity of such work in existing literature that has spurred us to investigate the returns and volatility spillovers in the global currency market and its reaction to the global pandemic.
Motivated by these concerns, this study measures the dynamic spillovers and connectedness between global foreign exchange (FX) markets and COVID-19 occurrences using most traded currency pairs in the world. These currencies are The Euro and US Dollar (EUR/USD) (nicknamed ‘euro’), The US Dollar and Japanese Yen (USD/JPY) (nicknamed ‘gropher’), The US Dollar and Swiss Franc (USD/CHF) (nicknamed ‘swissie’), The British Pound and US Dollar (GBP/USD) (nicknamed ‘cable’), The US Dollar and Canadian Dollar (USD/CAD) (nicknamed ‘loonie’), and The Australian Dollar and US Dollar (AUD/USD) (nicknamed ‘aussie’). These currency pairs, along with their various combinations (such as EUR/GBP, GBP/JPY and EUR/JPY) account for more than 95% of all speculative trading in global FX (Salisu et al., Citation2018). Due to the volume of foreign exchanges of these currency pairs, they are more likely to be susceptible to higher risks and uncertainties than the less traded currencies. Policy makers must therefore develop an in depth understanding of returns and volatility spillovers in the foreign exchange market to enable policy to focus closely on smoothing out the effects of shocks to the transmission channel.
In addition, the nature of the currency market may pose some downsides such as; volatile capital flows which may result in increased currency market volatility and vulnerability to fluctuation of global financial markets which may be particularly harmful for foreign exchange investors. Moreover, it is plausible that integration within foreign exchange markets may indicate the absence of potential diversification opportunities and this may pose an exposure to risk, as these integration makes the market more susceptible to greater loss due to financial contagion in a crisis situation. This study is therefore very significant and timely as information about linkages within the foreign exchange market in the face of the COVID-19 pandemic will provide valuable information to stakeholders in the foreign exchange market, which may help in portfolio formulation.
From the policy perspective, there are compelling reasons for investigating the returns and volatility spillovers in the global currency market and its reaction to the global pandemic. First, ‘information about the intensity of these spillovers provides useful insights to portfolio investors on how to diversify their portfolio investments in order to maximize returns’ (Fasanya & Akinde, Citation2019; Salisu et al., Citation2018). Second, information about volatility transmissions would prove useful to policy makers in identifying likely currencies which may be vulnerable to higher risks. Third, as pointed out by Diebold and Yilmaz (Citation2012), information about volatility transmissions would be useful in providing early warning signs for budding crises, and to track the evolvement of existent crises.
This study makes a methodological contribution by adopting Diebold and Yilmaz (Citation2012) approach to quantify the returns and volatility transmissions in the foreign exchange market. To the best of our knowledge, no previous study has adopted the Diebold and Yilmaz (Citation2012) methodology to investigate this dynamic relationship and connectedness between COVID-19 occurrence and the global foreign exchange market. The Diebold and Yilmaz (Citation2012) approach provides a simple and intuitive measure of interdependence of asset returns and volatilities by exploiting the generalized vector autoregressive framework of Koop et al. (Citation1996) and Pesaran and Shin (Citation1998), which produces variance decompositions that are unaffected by ordering. This is an improvement on the Diebold and Yilmaz (Citation2009) approach.
In addition to the applications rendered by Diebold and Yilmaz (Citation2009, Citation2012), the few notable studies that have adopted the methodology include Antonakakis (Citation2012), Awartani and Maghyereh (Citation2013), Duncan and Kabundi (Citation2013), Fasanya et al. (Citation2019) amongst others. Diebold and Yilmaz (Citation2009) consider 19 stock market indices comprising of developed and emerging markets finding evidence of divergent behaviour in the dynamics of return spillovers versus volatility spillovers: return spillovers display a gently increasing trend but no bursts, whereas volatility spillovers display no trend but clear bursts. Unlike Diebold and Yilmaz (Citation2009), Diebold and Yilmaz (Citation2012) consider spillovers across four asset classes namely stock, bond, exchange rate and commodity markets in the US. Different financial markets have also been analyzed by the few related studies using this methodology. For example, Antonakakis (Citation2012) focus on Euro financial markets; Awartani and Maghyereh (Citation2013) explore oil and stock markets in the Gulf Cooperation Council countries; Duncan and Kabundi (Citation2013) consider South African financial markets; Nishimura et al. (Citation2015) capture splliovers between Chinese and Japanese stock markets; and Fasanya et al. (Citation2019) examines spillovers between sectoral stocks in Nigeria. All these papers find evidence of interdependence in financial markets although the degree of intensity varies across regions. Nonetheless, only Salisu et al. (Citation2018) has been able to evaluate spillovers in global FX markets. However, it does not consider the effect of the COVID-19. Our results offer some useful generalizations relevant to spillovers and volatility transmissions between COVID-19 occurrence and the global foreign exchange market. This is the contribution of our paper.
Following this introductory section, we structure the rest of the paper as follows. Section 2 presents the review of existing literature; Section 3 explains the methodology for our analysis. Section 4 describes the data and also provides some preliminary analyses. Section 5 discusses the empirical results. In Section 6, robustness checks are considered and Section 7 concludes the study.
2. Literature review
This section presents a review of literature on dynamic spillovers and connectedness between COVID-19 occurrences and the global FX markets. Numerous studies have examined the connectedness and spillovers between various markets with conflicting results on the existence and directions of transmissions. A number of these studies already include literature reviews up to the date of their publication (see, e.g. Albulescu et al., Citation2019 for a complete literature survey).
However, to the best of the authors’ knowledge, no empirical investigation of the dynamic spillovers and connectedness between reported COVID-19 cases and the global FX markets have been performed up to date as most of the existing studies only conduct market-specific and region-based studies with none having considered the effect of the global pandemic on the interactions between the global FX markets (see, e.g., Albulescu, Citation2020; Antonakakis et al., Citation2016; Caporin et al., Citation2019; Corbet et al., Citation2020; Fasanya & Akinde, Citation2019; Nikkinen et al., Citation2006). A study of the spillovers and connectedness between COVID-19 pandemic occurrences and the global FX markets would prove useful to policy makers in identifying likely currencies which may be vulnerable to higher risks in the face of pandemics. Also, information about volatility transmissions would be useful in providing early warning signs for budding crises, and to track the evolvement of existent crises.
Many of the papers surveyed in this study have focused on volatility transmissions across various regions and considering divergent markets. Worthy of mention is the European FX markets (see, e.g., Bubák et al., Citation2011; Cai et al., Citation2008; Greenwood-Nimmo et al., Citation2016; Nikkinen et al., Citation2006), the International real estate market (see, e.g., Antonakakis et al., Citation2016; Caporin et al., Citation2019; Hoesli & Reka, Citation2011; Liow & Huang, Citation2018), International equity markets (see, e.g., Albulescu, Citation2020; Diebold & Yilmaz, Citation2009), major currency markets (see, e.g., Albulescu et al., Citation2019; Aslam et al., Citation2020; Salisu et al., Citation2018), cryptocurrency markets (see, e.g., Corbet et al., Citation2020; Fasanya et al., Citation2019; Lahmiri & Bekiros, Citation2020) among others. However, in recent times, we have noticed an emerging strand of literature on the impact of global pandemics on spillover transmissions between markets (see, e.g., Albulescu, Citation2020; Corbet et al., Citation2020; Youssef et al., Citation2006) with none having examined the contribution of COVID-19 to spillover transmissions among global currency pairs.
From a methodological perspective, different techniques have been adopted to capture volatility transmissions across markets. Some of the prominent techniques employed include; Vector Autoregression (VAR) (see, e.g., Greenwood-Nimmo et al., Citation2016; Nikkinen et al., Citation2006), TVP-VAR model (see, e.g., Youssef et al., Citation2006), Lagrange multiplier (LM) volatility spillover test (see, e.g., Nazlioglu et al., Citation2020), Bayesian Quantile-on-Quantile Approach (see, e.g., Caporin et al., Citation2019), Nonparametric Causality-in-Quantiles Test (see, e.g., Albulescu et al., Citation2019; Bahloul et al., Citation2018), Fourier Toda-Yamamoto causality (mean spillover) test (see, e.g., Nazlioglu et al., Citation2016), and most prominently Diebold and Yilmaz methodology (see, e.g., Diebold & Yilmaz, Citation2009; Fasanya et al., Citation2019; Liow & Huang, Citation2018; Salisu et al., Citation2018) to mention a few.
In terms of empirical findings, the results appear mixed. While most studies report strong degree of interdependence as well as cross-market spillovers among the financial instruments (see, e.g., Albulescu et al., Citation2019; Bubák et al., Citation2011; Fasanya & Akinde, Citation2019; Nikkinen et al., Citation2006; Salisu et al., Citation2018), some others argue for the existence of divergent behaviour in the dynamics of return spillovers vs. volatility spillovers (see, e.g., Diebold & Yilmaz, Citation2009). Furthermore, estimated results in some studies show weak degree of interdependence among the financial instruments (see, e.g., Fasanya & Akinde, Citation2019). However, the only known work till date that mirrors this study is Salisu et al. (Citation2018) which examines spillover transmissions among majorly traded currency pairs. However, our present study differs from theirs by examining spillovers and volatility transmissions between COVID-19 occurrence and the global foreign exchange market. This is the contribution of our paper.
3. The Diebold–Yilmaz (2012) approach
For this paper, we apply the Diebold and Yilmaz (2012) spillover framework whose analysis is based on the generalized vector autoregressive (VAR) model of Koop et al. (Citation1996) and Pesaran and Shin (Citation1998), hereafter KPSS, whose variance decompositions computations are invariant to variable ordering. This framework involves four types of spillovers-Total Spillovers, Directional Spillovers, Net Spillovers and Net Pairwise Spillovers- that describes the level of connectedness or relationship among variables. In setting up the spillover indexes, a covariance stationary VAR is considered. For detailed methodological exposition (see Diebold & Yilmaz, Citation2012, 2012)
(1)
(1)
where
is an
vector of return/volatility series,
is an
matrix of parameters,
is a vector of independently and identically distributed disturbances and
is the variance matrix for the error vector
The moving average representation can be written as:
(2)
(2)
where
is assumed to obey the recursion
is an identity matrix with an
dimension and
for
The coefficients of the moving average in EquationEquation (2)
(2)
(2) forms the basis for understanding the dynamic process needed in determining spillover indexes. Before providing the representations for the various indexes, the following preliminary considerations are important:
Own variance shares are defined as the fractions of the H-step-ahead error variances in forecasting
that are due to shocks to
Cross variance shares or spillovers are defined as the fractions of the H-step-ahead error variances in forecasting
Based on the generalized VAR framework of KPPS,
Since the sum of the contributions to the variance of the forecast error is not equal to one – that is
Given these preliminaries, the total spillover index is written as:
(5)
(5)
All the parameters in EquationEquation (5)(5)
(5) have been previously defined. Essentially, EquationEquation (5)
(5)
(5) measures the contribution of spillovers of return/volatility shocks across the assets under consideration. In our case, the total spillover index captures the contribution of spillovers of return/volatility shocks across the six (6) global FX markets with the global COVID pandemic cases to the total forecast error variance.
Also, it is possible to assess quantitatively the direction of spillovers across the six global FX markets and COVID cases using the Diebold and Yilmaz (Citation2012) approach. These directional spillovers are classified into two namely ‘Directional Spillover To’ and ‘Directional Spillover From’. The former measures the directional spillovers whether return or volatility transmitted by market to all other markets
considering the role of the pandemic while the latter relates to how the pandemic affects the return or volatility received by market
from all other markets
The index for the computation of ‘Directional Spillover To’ denoted by
is given as:
(6)
(6)
Also, the ‘Directional Spillover From’ denoted as is measured using the index given below:
(7)
(7)
Equally, the Net Spillovers can be obtained using the index expressed below:
(8)
(8)
EquationEquation (8)(8)
(8) gives the difference between the gross return/volatility shocks transmitted to and received from all other markets. In other words, information about each market’s contribution to the return/volatility of other markers can be obtained through the net spillovers. In our analysis, we consider a second order 6-variable VARs with 10-step-ahead forecasts. Relevant diagnostics are also rendered to validate the robustness of our results.
4. Data and preliminary analyses
This study covers both the returns and volatilities of global exchange currency pairs considering the role of COVID-19 using daily data from December 31, 2019 – April 10, 2020. The start and end dates are governed based on data availability and the need to have the same start and end dates for all series. The COVID-19 period analysis is restricted to 31/12/2019 (first officially reported COVID-19 case) to 10/4/2020 (when the first draft of the paper was submitted). The data on COVID-19 are obtained from Datastream and World Health Organization (WHO) reports. The currency pairs data are freely downloadable from the database of Forex Forum Global View (www.global-view.com/forex-trading-tools/forex-history/). The returns of the series (zt) are computed as the first difference of the natural logarithm of the level series (Pt); this is expressed in EquationEquation (1)(1)
(1) below:
(1)
(1)
where
represents the calculated exchange rate returns, Pt is the level exchange rate, and Δ is the first difference lag operator. Thus, positive/negative returns will represent depreciation/appreciation of the quoted currency relative to the base currency. Meanwhile, the volatility series is obtained from the estimation of GARCH(1,1) model
The summary statistics for the two series are presented in and and thereafter we attempt to plot the trends in returns and volatility series over the period under consideration.
Table 1. Summary Statistics for log returns of six major currency pairs and world COVID-19 cases return series.
Table 2. Summary statistics for the volatility of six major currency pairs and world COVID-19 cases volatility series.
presents the descriptive statistics for global COVID-19 occurrence and return series of all the currency pairs over the full sample period. The mean in the table represents the average returns of each currency pair over the considered time period. On average, three out of the six exchange rate pairs namely; EUR/USD, USD/JPY and GBP/USD have negative average returns which imply the EUR and the GBP appreciated against the USD while the JPY depreciated against the USD. On the other hand, the USD/CHF, USD/CAD and the AUD/USD all have positive average returns and this implies that the CHF and CAD appreciated against the USD while the AUD depreciated against the USD. However, the COVID-19 occurrence averaged at 9.8038. The maximum and minimum values including the skewness and kurtosis statistics of the currency pairs’ returns are also presented. The return series of all the currency pairs are skewed with. However, while the USD/JPY, USD/CAD and AUD/USD are positively skewed, the EUR/USD, USD/CHF, GBP/USD and COVID-19 are negatively skewed. The kurtosis statistics also reveal all series are highly peaked.
A graphical illustration of the return series is presented (see ). depicts that GBP, CAD and AUD appreciated against the USD consistently over the period under consideration while the trend appears mixed for EUR, JPY and CHF with the global COVID-19 occurrence trending upward. This observation is also consistent with the computed descriptive statistics.
Figure 1. Combined graph for currency pairs and their returns. Source: DataStream; Forex forum global view and World Health Organization (WHO) reports.
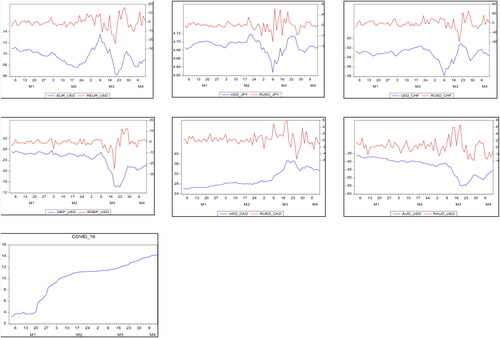
shows the descriptive statistics for the volatility series of all the currency pairs and world COVID-19 cases under the whole sample period. Interestingly, all the six currency pairs are highly volatile (though more volatile in some than others). The average unpredictability nature of each currency pairs is captured by the mean in the table over the considered time period. As observed, the volatile series of all the six exchange rate pairs have positive average values which imply the EUR, GBP and the AUD depreciated against the USD while the JPY, CHF and the CAD appreciated against the USD. There also seems to be evidence of significant variations in the trends of the six currency pairs over the scope covered. This is shown by the huge difference between the minimum and maximum values for the six exchange rate pairs and especially COVID-19.
Concerning the statistical distribution of the series, there is evidence of positive skewness across all series. Regarding kurtosis, all the six exchange rate pairs are leptokurtic indicating fat tails than the normal distribution. Similarly, the Jarque Bera (JB) statistic shows evidence of non-normality for all the currency pairs under the whole sample period.
illustrates the dynamics of the six exchange rate pairs considered. The behaviour of these currency pairs follow an unsteady pattern with few notable spikes providing evidence of significant unsteady patterns of currency pairs particularly during the period of the global COVID-19 pandemic ().
Figure 2. Volatility graph for currency pairs and global corona virus cases. Source: DataStream; Forex forum global view and World Health Organization (WHO) reports.
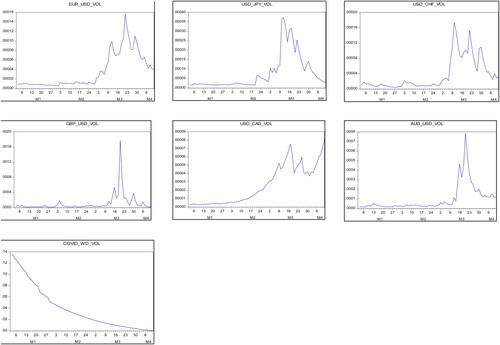
Table 3. Unit root test results.
Also, we subject each of the series in our model to unit root testing. We adopt the Augmented Dickey-Fuller (ADF) test and the Ng-Perron (Ng-P) test for stationarity and all return series appear to be stationary at the 1% significance level while the logged values of the global COVID-19 occurrences is stationary at 5%.
5. Spillover analysis
Results from the Diebold and Yilmaz (Citation2012) approach is usually partitioned into two namely the Spillover Tables and the Rolling Window Analysis. The Spillover tables produce a single-fixed (scalar) value for each of the indices over the period of interest. This is particularly useful where the interest is to estimate the aggregate spillovers over a particular period of time. However, a deeper and intuitive result can be obtained where unprecedented events characterizing the behaviour of the spillovers are reflected in the analysis. This is the essence of the rolling window analysis. Thus, the latter complements the former as it unveils the cyclical and secular movements explaining the behaviour of the spillovers from one period to another.
First, we analyze the spillover tables for both returns and volatility of the global FX markets (see and respectively). presents the returns spillovers computed for the whole sample from December 31, 2019 to April 10, 2020 based on a second order 7-variable VARs with 10-step-ahead forecasts. We proceed to the interpretation of the spillover table for the return series (see ). Starting with individual directional spillovers from others, swissie records the highest contribution to the forecast error variance of euro returns with about 24.4% followed by gropher with about 13.4%. Thus, shocks to swissie are more likely to affect the behaviour of euro returns than shocks to other major FX markets in the world. Interestingly and expectedly too, shocks to euro have greater impact on the forecast error variance of swissie returns than shocks to other FX markets considered. The euro explains about 24% of the forecast error variance of swissie returns followed by gropher with 17.4%. Also, although relatively smaller compared to euro and swisse FX markets, the forecast error variance of cable returns is more influenced by shocks to aussie with about 25.5% and closely followed by loonie with about 23.6%. Similarly, the forecast error variance of gropher returns is more influenced by shocks to aussie with about 17.5% and closely followed by lonnie and euro with about 13.8% and 13.7% respectively. In the case of aussie returns however, the contribution from other markets to its forecast error variance is dominated by loonie with 26.5% and closely followed by cable with 19.6%. Like the aussie returns, the contribution of other markets to the forecast error variance of the loonie returns is largely captured by loonie with about 23.7% and followed by cable as well with about 16.6%.
Table 4. Return spillovers between major currency pairs and global COVID occurrence from December 31, 2019 to April 04, 2020.
Table 5. Volatility spillovers between major currency pairs and global COVID occurrence from December 31, 2019 to April 04, 2020.
COVID_WD however receives the lowest contribution from other markets with gropher having the highest with about 3.5% and followed by cable with about 1.8%. Thus, bidirectional spillovers seem more evident between swissie and euro as well as between aussie and loonie than any other FX market pairs. On the whole however, swissie returns receive the highest contribution from others with about 75% and followed closely by euro, cable and gropher returns with contributions of about 71%, 67% and 62% respectively while aussie and loonie receives about 60% and 55% respectively. COVID_WD records the lowest contributions from others. In other words, shocks to other markets account for greater percentage of the forecast error variances of loonie, aussie and cable markets than their own shocks while the forecast error variances of COVID_WD is substantially explained by its own shocks. Intuitively, euro, swisse, cable and gropher are more vulnerable to shocks to Global FX markets than other currency pairs in the world. Our results provide evidence to support COVID_WD plays a very limited role in the returns of globally traded currencies.
Furthermore, shocks to loonie seems to have greater impact on other global FX markets than any other FX market. Following loonie in terms of influence in the global FX markets are aussie, cable and euro which is closely followed by the swissie in that order. The impact of gropher seems minimal. Although, it seems evident that COVID_WD has very little impact on the returns of majorly traded currencies. With regards to net spillovers, positive values are recorded for both loonie and aussie although the former is higher (about 38%) than the latter (about 18%) while other currency pairs considered have negative net spillovers. This suggests that loonie and aussie give more than they receive in the global FX markets while others (euro, cable, swissie, gropher and COVID_WD) give less than they receive. This finding further strengthens the significance of loonie and aussie returns in the global FX markets.
Considering the total spillover index, the computed value of 56.6% indicates that more than half of the total variance of the forecast errors during the sample is explained by shocks across the currency pairs, whereas the remaining 43.4% is explained by idiosyncratic shocks. Overall, both the total and directional spillover indexes are quite high indicating the presence of return spillovers among the major currency pairs considered.
It is evident from that, there is a relatively higher spillover index for volatility series than that of the return series (about 60.7%). Hence a stronger interdependence occurs among currency and COVID_WD volatilities compared with returns spillovers. Loonie explains about 42.2% of the forecast error variance of euro volatility and is distantly followed by the swissie with just 17.7%. The swissie records the highest dedication to the forecast error variance of gropher with about 25.8% followed closely by loonie (20.6%) and remotely by aussie, cable and euro with 13.4%, 9.6%, and 8.9% respectively. Strikingly, there seems to be evidence of a bi-causal relationship between aussie and cable. The aussie contributes to the total error forecast variance of the cable with about 22% while the cable also dedicated the highest of its contribution to the total error forecast variance of aussie with about 15.9%.
Concerning net spillovers, positive values are recorded for both loonie and swissie although the former is higher (about 93%) than the latter (about 11%) while other currency pairs considered have negative net. This suggests that aussie and cable give more than they receive in the global FX markets while the loonie and swissie give less than they receive. Looking at the total volatility spillover index, which is a distillation of the various directional volatility spillovers into a single index Diebold and Yilmaz (2012), the computed value of 60.7% indicates that on average, across our entire sample, more than half (60.7%) of the volatility forecast error variance in the major FX markets come from spillovers whereas the remaining 49.3% is explained by idiosyncratic shocks.
5.1. Rolling-window analysis
According to Diebold and Yilmaz (Citation2012), the rolling window analysis unravels the cyclical and secular events that the spillover table and index may be inadequate in capturing. This is very much interesting given the decentralized nature of the global FX market. As such the dictates and significance of the invisible hand is being explored. In light of this, we propose a rolling window structure using 35-day sub-sample rolling windows in order to address these insufficiencies and properly capture events or crises episodes that may have occurred during the period under consideration.
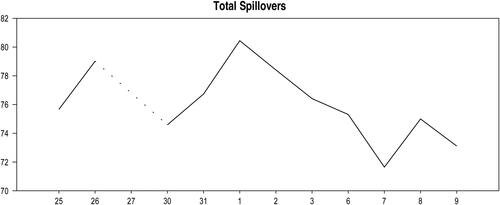
and present the plots for the return and volatility spillover indices. Interestingly, both spillovers started off at a value above around 55%, with volatility edging returns in the first window. The total return spillover plot reveals that spillover effects across the major currency pairs steadily increased between 50% and 75% with few incidences of slight dips while the total volatility spillover mostly varied between 72% and 80%. However, there was a large dip in the volatility index starting on April 1 up till April 7 while returns steadily increased. This can be attributed to a reduction in the Italian Manufacturing PMI indicative of an industry contraction possibly due to rising uncertainties stemming from the pandemic, rising crude oil inventories indicative of low demand and rising unemployment claims.
Figure 3. Return spillover plot. Source: DataStream; Forex forum global view and World Health Organization (WHO) reports.
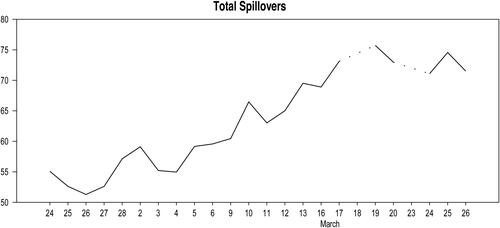
Figure 4. Volatility spillover plot. Source: DataStream; Forex forum global view and World Health Organization (WHO) reports.
5.2. Directional spillovers
Following our discussion of the total spillover plot in the global FX Market, we also consider the direction of spillovers ‘from’ and ‘to’ others among the currency pairs returns and COVID-19 occurrences as presented in . We proceed by examining the directional spillovers TO others as presented in below. The results illustrated in reveal considerable variations over time. At volatile periods, the directional spillovers to the returns of each of the six currency pairs and global COVID-19 occurrence increase close to 130% while at less volatile periods, spillovers from each market are less than 60%. Among the returns of the six currency pairs, USD_JPY records least directional spillover contribution to others compared to the returns of other five currency pairs, while COVID_WD records directional spillover contribution to others overall.
Figure 5. Directional spillovers to the individual return series. Source: DataStream; Forex forum global view and World Health Organization (WHO) reports.
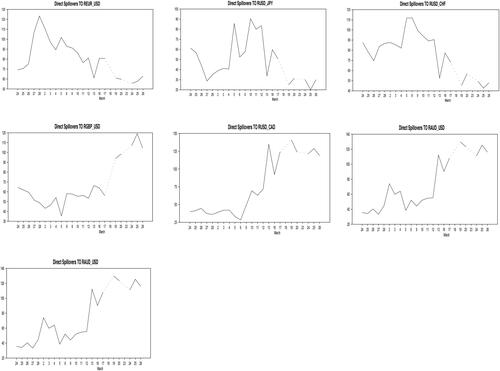
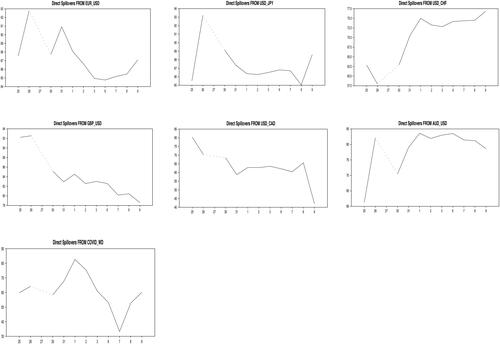
Similarly, presents the directional currency spillovers FROM each of the six currency pairs and COVID_WD to others. The results vary greatly over time. However, relative to the directional currency spillovers TO currency pairs discussed earlier (), it shows a reverse pattern in variation. also reveals the USD_CHF records most directional spillover contribution from others ( and ).
Figure 6. Directional spillovers from the individual return series. Source: DataStream; Forex forum global view and World Health Organization (WHO) reports.
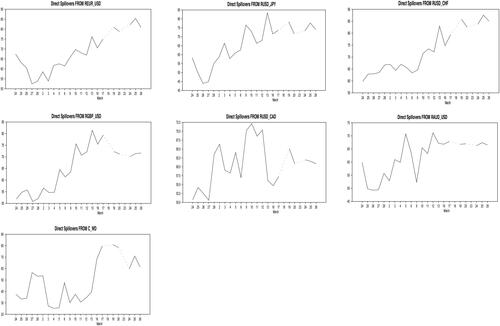
Figure 7. Directional spillovers to the individual volatility series. Source: DataStream; Forex forum global view and World Health Organization (WHO) reports.
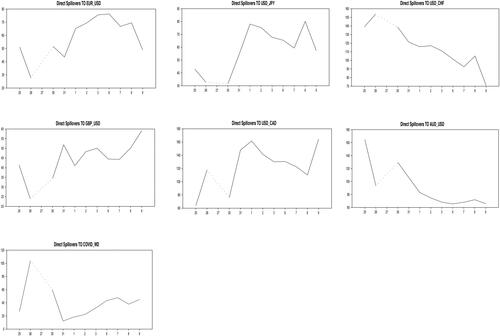
Figure 8. Directional spillovers from the individual volatility series. Source: DataStream; Forex forum global view and World Health Organization (WHO) reports.
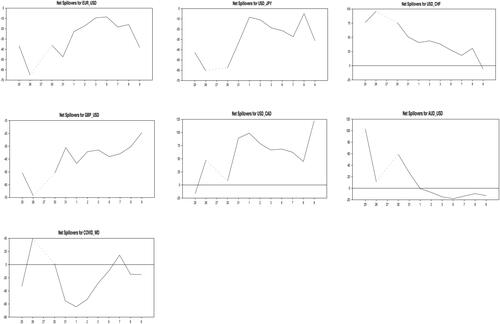
5.3. Net spillovers
The net directional spillover effects among the six major currency pairs and COVID-19 occurrence are presented here using the rolling sample methodology mentioned above. Consideration of the net directional spillover effects allows us to detect net transmitters and receivers of spillovers and their contribution to total spillovers. presents the net return spillovers for global COVID-19 occurrence and the six majorly traded currency pairs examined in this study. This is calculated by the difference between the ‘contribution to’ row sum and the ‘contribution from’ column sum presented in . corroborates the results presented in the returns spillover table () indicating that USD_CAD (loonie) and AUS_USD (aussie) are the major net transmitter of return spillovers throughout the sample while the USD_CHF (swissie) is the major net receiver of return spillover. The net spillover index for USD_JPY, EUR_USD and GBP_USD is negative and this implies they are mainly receivers of return spillovers ().
Figure 9. Net spillovers for the individual return series. Source: DataStream; Forex forum global view and World Health Organization (WHO) reports.
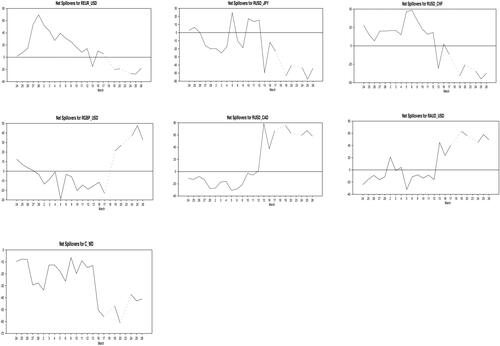
Figure 10. Net spillovers for the individual volatility series. Source: DataStream; Forex forum global view and World Health Organization (WHO) reports.Source: DataStream; Forex forum global view and World Health Organization (WHO) reports.
6. Robustness checks
We conduct robustness checks in order to ascertain the reliability of our results. This is achieved by considering different VAR lag order to identify the sensitivity of the spillover indexes for both returns and volatilities. Consequently, considering the scenario of VAR orders of 2–6, the resulting tables are presented in and . As depicted in all these tables, there are only slight changes (−4% to +4%) to spillover index compared to the base case scenario, this is indicative that results for both returns and volatilities are robust to all the considered scenarios. In other words, the calculated spillover indexes for the return and volatility in the global FX market are not sensitive to VAR lag structure. Basically, the results show that regardless VAR lag, the model is well-behaved shown by the accordance of all the VAR orders from 2 to 6 of both the total return and volatility spillovers indexes.
Table 6. Robustness check results for return spillovers.
Table 7. Robustness check results for volatility spillovers.
7. Conclusion
The increasing confirmed COVID-19 occurrences is a major pointer to different facet of uncertainty in the global economy. This uncertainty cuts across all forms of markets and as such the global FX market is not left out. This paper examines dynamic spillovers and connectedness between the Global FX market and global COVID-19 occurrence by utilizing daily data for the period between December 31, 2019 to April 10, 2020 in order to assess the total spillovers, directional spillovers, net spillovers and gross spillovers using the Diebold and Yilmaz approach. The following are our findings:
First, we find strong evidence of cross-market spillovers in the global FX markets as about 56.6 percent of forecast error variance of the markets are due to spillovers. This is consistent with findings of Salisu et al. (Citation2018). Similarly, with the exception of COVID_WD, the directional spillovers are quite high which is indicative of strong interdependence in the returns of the major traded currency pairs. Intuitively, an unprecedented change in the return of one currency pair is more likely to affect the returns of other major currency pairs. Among the currency pairs considered, the loonie and aussie seem to exert more influence on the behaviour of returns of the global FX markets than other major currency pairs suggesting that both currencies give more shocks to other currencies than they receive and are therefore less vulnerable to fluctuations from other currency pairs while evidence indicates that the swissie is more susceptible to variations in other currency pairs making it vulnerable to higher risks. This is inconsistent with Salisu et al. (Citation2018), who find that the euro, swissie, aussie and cable appear to exert more influence on the behaviour of returns of the global FX markets than other major currency pairs. This is perhaps due to the inclusion of COVID_WD and differences in sample frame considered. Second, our results provide evidence to support COVID_WD plays a very limited role in the returns of globally traded currencies. However, a stronger interdependence occurs among volatility spillovers compared with returns spillovers. Nonetheless, the rolling window analyses unveil substantial volatility spillovers for some periods due to events such as reduction in the Italian Manufacturing PMI indicative of an industry contraction possibly due to rising uncertainties stemming from the pandemic, rising crude oil inventories indicative of low demand and rising unemployment claims. Lastly, we identify different VAR lag structure and evidence proves our results are robust.
From a policy perspective, findings from our study necessitates that policymakers monitor the effects of global COVID-19 announcement and also not overlook overall financial market risks by analyzing the net effect of financial market volatility on the behaviour of the global FX markets. From an asset managerial perspective, the risk management framework should be reassessed to address new and enhanced risks caused by the upsurge of the COVID-19 pandemic. Policymakers would benefit from in depth understanding of returns and volatility spillovers in the foreign exchange market to enable policy to focus closely on smoothing out the effects of shocks to the transmission channel. Given the daily announcement of cases, there is need for governments all over the world to intensify efforts towards a lasting solution to the virus to prevent a collapse in the global economy. As part of future research, it would be interesting to extend our analysis into cryptocurrency, global foreign exchange stock and bond markets of different countries. This will provide insights for global investors to develop better portfolio diversification benefits.
Disclosure statement
No potential conflict of interest was reported by the author(s).
References
- Albulescu, C. T. (2020). COVID-19 and the United States financial markets’ volatility. Finance Research Letters, 101699. https://doi.org/https://doi.org/10.1016/j.frl.2020.101699
- Albulescu, C. T., Demirer, R., Raheem, I. D., & Tiwari, A. K. (2019). Does the U.S. economic policy uncertainty connect financial markets? Evidence from oil and commodity currencies. Energy Economics, 83, 375–388. https://doi.org/https://doi.org/10.1016/j.eneco.2019.07.024
- Antonakakis, N. (2012). Exchange return co-movements and volatility spillovers before and after the introduction of euro. Journal of International Financial Markets, Institutions and Money, 22(5), 1091–1109. https://doi.org/https://doi.org/10.1016/j.intfin.2012.05.009
- Antonakakis, N., Gupta, R., & Mwamba, J. (2016). Dynamic comovements between housing and oil markets in the US over 1859 to 2013: A note. Atlantic Economic Journal, 44(3), 377–386. https://doi.org/https://doi.org/10.1007/s11293-016-9508-4
- Aslam, F., Aziz, S., Nguyen, D. K., Mughal, K. S., & Khan, M. (2020). On the efficiency of foreign exchange markets in times of the COVID-19 pandemic. Technological Forecasting & Social Change. https://doi.org/https://doi.org/10.1016/j.techfore.2020.120261
- Awartani, B., & Maghyereh, A. I. (2013). Dynamic spillovers between oil and stock markets in the Gulf Cooperation Council countries. Energy Economics, 36, 28–42. https://doi.org/https://doi.org/10.1016/j.eneco.2012.11.024
- Bahloul, W., Balcilar, M., Cunado, J., & Gupta, R. (2018). The role of economic and financial uncertainties in predicting commodity futures returns and volatility: evidence from a nonparametric causality-in-quantiles test. Journal of Multinational Financial Management, 45, 52–71. https://doi.org/https://doi.org/10.1016/j.mulfin.2018.04.002
- Baker, S. R., Bloom, N., Davis, S. J., Kost, K., Sammon, M., & Viratyosin, T. (2020). The unprecedented stock market reaction to COVID-19.
- Bubák, V., Kočenda, E., & Žikeš, F. (2011). Volatility transmission in emerging European foreign exchange markets. Journal of Banking & Finance, 35 (11), 2829–2841. https://doi.org/https://doi.org/10.1016/j.jbankfin.2011.03.012
- Cai, F., Howorka, E., & Wongswan, J. (2008). Informational linkages across trading regions: Evidence from foreign exchange markets. Journal of International Money and Finance, 27 (8), 1215–1243. https://doi.org/https://doi.org/10.1016/j.jimonfin.2007.08.001
- Caporin, M., Gupta, R., & Ravazzolo, F. (2019). Contagion between real estate and financial markets: A Bayesian quantile-on-quantile approach. Working Paper No 2019-13. University of Pretoria, Department of Economics.
- Corbet, S., Larkin, C. J., & Lucey, B. M. (2020). The contagion effects of the COVID-19 Pandemic: Evidence from gold and cryptocurrencies. Finance Research Letters, 35, 101554. https://doi.org/https://doi.org/10.1016/j.frl.2020.101554
- Diebold, F. X., & Yilmaz, K. (2009). Measuring financial asset return and volatility spillovers, with application to global equity markets. The Economic Journal, 119(534), 158–171. https://doi.org/https://doi.org/10.1111/j.1468-0297.2008.02208.x
- Diebold, F. X., & Yilmaz, K. (2012). Better to give than to receive: Predictive directional measurement of volatility spillovers. International Journal of Forecasting, 28(1), 57–66. https://doi.org/https://doi.org/10.1016/j.ijforecast.2011.02.006
- Duncan, A. S., & Kabundi, A. (2013). Domestic and foreign sources of volatility spillover to South African asset classes. Economic Modelling, 31, 566–573. https://doi.org/https://doi.org/10.1016/j.econmod.2012.11.016
- Fasanya, I. O., & Akinde, M. A. (2019). Volatility transmission in the Nigerian financial market. The Journal of Finance and Data Science, 5(2), 99–115. https://doi.org/https://doi.org/10.1016/j.jfds.2019.01.003
- Fasanya, I. O., Oyewole, O. J., & Agbatogun, T. (2019). Measuring return and volatility spillovers among sectoral stocks in Nigeria. Zagreb International Review of Economics and Business, 22(2), 71–93. https://doi.org/https://doi.org/10.2478/zireb-2019-0021
- Greenwood-Nimmo, M., Nguyen, V. H., & Rafferty, B. (2016). Risk and return spillovers among the G10 currencies. Journal of Financial Markets, 31, 43–62. https://doi.org/https://doi.org/10.1016/j.finmar.2016.05.001
- Grenier, M. (2020). Currency volatility during the COVID-19 outbreak. https://www.airshare.air-inc.com: https://airshare.air-inc.com/how-is-covid-19-impacting-global-currency
- Hoesli, M., & Reka, K. (2011). Volatility spillovers, comovements and contagion in securitized real estate markets. Journal of Real Estate Finance, 45, 1–35.
- Koop, G., Pesaran, M. H., & Potter, S. M. (1996). Impulse response analysis in non-linear multivariate models. Journal of Econometrics, 74(1), 119–147. https://doi.org/https://doi.org/10.1016/0304-4076(95)01753-4
- Lahmiri, S., & Bekiros, S. (2020). The impact of COVID-19 pandemic upon stability and sequential irregularity of equity and cryptocurrency markets. Chaos, Solitons, and Fractals, 138, 109936. https://doi.org/https://doi.org/10.1016/j.chaos.2020.109936
- Liow, K. H., & Huang, Y. (2018). The dynamics of volatility connectedness in international real estate investment trusts. Journal of International Financial Markets, Institutions & Money, 45, 195–210.
- Nazlioglu, S., Gormus, A., & Soytas, U. (2016). Oil prices and real estate investment trusts (REITs): Gradual-shift causality and volatility transmission analysis. Energy Economics, 60, 168–175. https://doi.org/https://doi.org/10.1016/j.eneco.2016.09.009
- Nazlioglu, S., Gupta, R., Gormus, A., & Soytas, U. (2020). Price and volatility linkages between international REITs and oil markets. Energy Economics, 88. https://doi.org/https://doi.org/10.1016/j.eneco.2020.104779
- Nikkinen, J., Sahlström, P., & Vähämaa, S. (2006). Implied volatility linkages among major European currencies. Journal of International Financial Markets, Institutions and Money, 16 (2), 87–103. https://doi.org/https://doi.org/10.1016/j.intfin.2004.12.007
- Nishimura, Y., Tsutsui, Y., & Hirayama, K. (2015). Intraday return and volatility spillover mechanism from Chinese to Japanese stock market. Journal of the Japanese and International Economies, 35, 23–42. https://doi.org/https://doi.org/10.1016/j.jjie.2014.11.005
- Pesaran, M. H., & Shin, Y. (1998). Generalized impulse response analysis in linear multivariate models. Economics Letters, 58(1), 17–29. https://doi.org/https://doi.org/10.1016/S0165-1765(97)00214-0
- Salisu, A. A., Oyewole, O. J., & Fasanya, I. (2018). Modelling return and volatility spillovers in global foreign exchange markets. Journal of Information and Optimization Sciences, 39(7), 1417–1448. https://doi.org/https://doi.org/10.1080/02522667.2017.1367507
- Youssef, M., Mokni, K., & Ajmi, A. N. (2006). Dynamic connectedness between stock markets in the presence of COVID-19 pandemic: Does economic policy uncertainty matter? https://doi.org/https://doi.org/10.21203/rs.3.rs-61157/v1
- Zeidan, S. (2020). Pandemic proves there is only one world currency. (Al Jazeera). Retrieved April 20, 2020, from http://www.aljazeera.com: https://www.aljazeera.com/programmes/countingthecost/2020/03/pandemic-proves-world-reserve-currency-200328113954984.html