
 ?Mathematical formulae have been encoded as MathML and are displayed in this HTML version using MathJax in order to improve their display. Uncheck the box to turn MathJax off. This feature requires Javascript. Click on a formula to zoom.
Abstract
Because the liquor industry is an important industry in China, alcohol companies have greater social responsibilities when upgrading their production processes to improve efficiencies. Two main data envelopment analysis (DEA) methods have been used for efficiency analyses: radial models, such as CCR (Charnes, Cooper, Rhodes) and BCC (Banker, Charnes, Cooper) and non-radial methods such as SBM (slacks-based model); however, both have disadvantages. The radial DEA model ignores the non-radial slacks and the non-radial DEA model ignores the characteristics of the same proportion in the radial DEA model. Therefore, this research used a dynamic two-stage directional distance function (DDF) model to analyse the production efficiencies of Chinese listed liquor companies from 2016 to 2018 by evaluating each company’s poverty alleviation input efficiencies, business operations efficiencies, and their social responsibility efficiencies, which was based on their wastewater treatment efficiencies. To overcome the disadvantages in traditional data envelopment models, the DDF model consisted of both input and output direction vectors, the indicator values for which indicated their relative importance or priorities. The analyses found that the indicator efficiencies at most liquor companies had declined, with the poverty alleviation indicator efficiencies being generally lower than the wastewater treatment indicator efficiencies. Several policy and management recommendations are given to improve the overall corporate efficiency and social responsibility in the Chinese liquor industry.
JEL CODES:
1. Introduction
China's unique liquor culture has a long history, with the liquor industry being recognised as one of China's traditional industries. As the liquor industry generates high profits, its taxes make a significant contribution to China's national finances. Liquor industry developments have also played an important role in China's economic development. However, because of internal and external changes in the liquor industry, liquor companies are now facing new opportunities and challenges.
It is expected that the 2020 liquor sales and the liquor companies’ original production and sales plans will be disrupted by the COVID-19 pandemic, with the expected sharp drop in consumer demand increasing inventory. The 2019 technological changes to online marketing by liquor companies, however, created a good foundation for their subsequent development.
Since 2019, better management of raw grain bases has improved Chinese liquor quality. Companies have also strengthened their production technologies and quality management and have outlined further plans for technological innovation to use big data to target consumer groups, which is expected to revolutionise the future marketing of Chinese liquor; for example, after several years of improvements, Fenjiu now has refined, smart marketing. Further, rather than just focusing on product marketing, the liquor companies’ service quality has improved to better compete in the market. However, while the nationalised and stronger enterprises have managed to achieve steady growth, many other companies have either been merged of gone out of business as they were unable to compete on brand, capital or organisation.
In 2018, there were 1,445 companies in China's liquor industry, which generated a sales revenue of 536.383 billion CNY, an increase of 12.88% from 2016 to 2018, with a total profit of 1,250.50 billion CNY, an increase of 29.98% over the same period. From January to April 2019, the number of liquor enterprises dropped by 274 to 1,176 compared to 2018: however, between January and October 2019, liquor industry sales revenue increased by 10.45% to 454.863 billion CNY, and year-on year total profits increased by 19.34% to 112.22 billion CNY. The sales revenue over 2019, therefore, was projected to be 589.654 billion CNY, and the total liquor industry profit was projected to be greater than 150 billion CNY (China National Statistical Yearbook, 2020).
Besides the liquor industry’s contribution of China’s economic development, liquor companies also have important environmental and social responsibilities. For example, Wuliangye attaches great importance to energy conservation, environmental protection and green projects, with its related enterprises having implemented circular industrial production, stricter enterprise environmental protection systems, and deep waste treatment systems that have processing capacities of 10,000m3/day, information on which is publicly available. The company also actively contributes to poverty alleviation in China through its social welfare activities associated with industrial, consumer, and education poverty alleviation, targeted assistance, employment assistance, compassionate condolences, voluntary blood donations, and voluntary services.
Companies face several challenges when seeking to meet their corporate social responsibility commitments, one of which is to ensure compliance with the technical pollution prevention and control regulations for liquor manufacturing and production. Therefore, for effective brand management, liquor companies must fulfil their social responsibilities by improving their operating efficiencies, implementing high-quality systems, strictly managing their wastewater and other pollutant discharges, and contributing to social charity activities.
There has been significant research into and comparative studies on alcohol and beverage company corporate efficiencies using DEA models (Aparicio et al., Citation2013; Giovanna et al., Citation2019; Goncharuk & Figurek, Citation2017; Lekic et al., Citation2018; Ormeci et al., Citation2018) that have considered both internal and external factors (Galluzzo, Citation2018; Sellers-Rubio et al., Citation2015). Two-stage DEA models have also been used to evaluate alcohol company efficiencies (Arunkumar & Ramanan, Citation2017; Carlucci et al., Citation2018), with many studies having included corporate environmental responsibility in the evaluation system and employed DEA, life cycle assessment (LCA) and other methods to study the relationships between social responsibility and corporate efficiency. Environmental responsibility research has focused on corporate energy efficiency based on energy consumption, emissions and the environmental impact (Payam et al., Citation2018; Santos et al., Citation2018; Taulo & Sebitosi, Citation2013; Vazquez-Rowe et al., Citation2012), and some studies have included corporate social responsibility in their evaluation systems (Yoon & Lam, Citation2013; Pantani et al., Citation2017; Puggioni & Stefanou, Citation2018).
However, as most existing studies have only evaluated liquor company environmental responsibility efficiencies and paid little attention to the social responsibility efficiencies, there have been few studies using DEA methods on alcohol and beverage company corporate efficiency and the associated social and environmental protection responsibilities .
Therefore, this study used a dynamic two-stage DDF model to analyse the operating, environmental, and poverty alleviation efficiencies in major Chinese listed liquor companies to provide policy and management recommendations to improve their corporate and social responsibility efficiencies.
2. Literature review
2.1. Company efficiency DEA model evaluations
Joo et al. (Citation2009 ) collected two-year data from eight coffee companies and employed DEA to calculate the operational efficiencies, and Setiawan et al. (Citation2012) used DEA to calculate the technical efficiencies on Indonesian food and beverage industry data from the Indonesian Central Bureau of Statistics (BPS), finding that the food and beverage industry had a high industrial concentration and low corporate efficiency characteristics. Aparicio et al. (Citation2013) used DEA to measure and break down income inefficiencies and account for all technical waste sources, and then applied the model to an evaluation of the Spanish premium wine industry with a specific focus on designated origin (DO) wines, from which it was found that the main source of income inefficiency was technology waste. Fernando et al. (Citation2013) collected data on 34 specialty Spanish (DO) wine producers and used DEA and a bounded adjustment measurement (BAM) to analyse their efficiencies in 2008, 2009 and 2010, and found that the efficiency of the Spanish DO subset was consistent over the analysis period. Kaur and Kaur (Citation2016) analysed the efficiency and productivity changes in 50 wine companies from 1988 to 2011 using a non-parametric DEA to calculate the changes in the Malmquist total factor productivity (TFP) and then decomposed these into efficiency changes and technological changes. Aparicio et al. (Citation2017) collected the latest data on the Spanish high-quality wine industry, decomposed the productivity changes into efficiency changes and technological changes, and then empirically analysed the productivity changes in the decision-making units (DMUs) in the full input-output space. Lekic et al. (Citation2018) used a non-parametric linear programming DEA (Data Envelopment Analysis) model to evaluate the activity development and financial efficiencies of representative small wineries in the Republic of Serbia, the results from which allowed for the development of specific strategic recommendations.
There have also been comparative studies on liquor and beverage company efficiencies. For example, Bayraktar et al. (Citation2010) used DEA to conduct a comparative study on the efficiency of supply chain management (SCM) and information systems (IS) in small and medium-sized food and beverage companies in Turkey and Bulgaria, and found that while the Turkish SMEs had higher supply chain management implementation efficiencies, there were no differences in the information system efficiencies. Goncharuk and Lazareva (Citation2017) extracted data on 36 wine companies from 15 countries and then used three DEA models and other international performance benchmarking tools to analyse the efficiencies, finding that the most efficient wine companies were from Germany, the United States and New Zealand. Goncharuk and Figurek (Citation2017) used DEA and correlation analysis to analyse the efficiency of 33 wineries in Ukraine and Bosnia and Herzegovina, and found that in Ukraine, the large and medium wineries had more efficient development than the smaller wineries. Ormeci et al. (Citation2018) collected data on vineyard production in selected villages in Denizli Province, Turkey, and then used DEA to measure the efficiency of the grape production technology, from which suggestions were made to improve the inefficient vineyards. Giovanna et al. (Citation2019) used unique data from all wine-producing companies in Sardinia (Italy) from 2004 to 2009 to study the comparative technical efficiencies of agricultural cooperatives (ACs) and traditional companies (CFs).
DEA models have also been applied to study the influence of endogenous and exogenous factors on liquor company efficiency. For example, Goncharuk (Citation2009) analysed the efficiencies and explored the key factors affecting efficiency: scale, location, operations, and other internal and external factors: in 34 Ukrainian brewing companies and 20 foreign brewing companies, from which it was found that only one company in Ukraine was world-class and efficient. Li et al. (Citation2013) measured the Distribution Centre productivity using DEA to determine the relationships between the different influencing variables in 108 distribution centres of a large beverage company, finding that high productivity did not always guarantee a good earnings performance. Sellers-Rubio et al. (Citation2015) employed DEA models to calculate the economic efficiency of Spanish wine and cheese company members of the protection of origin (PDO), and found that the PDO label and company age and size had positive impacts on economic efficiency, and that company salary levels had different impacts on the efficiencies depending on the sector. Galluzoo (2018) evaluated the technical efficiency of wine estates using non-parametric methods using variables from the annual survey of Bulgarian Agricultural Accounting Data Network from 2007 to 2015, and found that the financial subsidies given as part of the EU common agricultural policy had had a positive impact on the farmers’ abilities to improve their technological efficiency and had reduced socioeconomic marginalisation in Bulgaria’s rural areas. Kedžo and Lukač (Citation2020) estimated the financial efficiency of some small EU food and drink producers and found that only 23% of food producers and 20–23% of drink producers were efficient.
Two-stage DEA models have also been employed to evaluate alcohol and beverage company efficiencies. For example, Arunkumar and Ramanan (Citation2017) used DEA to perform a two-stage efficiency analysis and determine the technology, scale, and operational efficiencies in 46 beverage companies in India in two different stages: from 2005 to 2006 and from 2009 to 2010. The first stage DEA analysis found that the Indian beverage industry had scale and technical inefficiencies, and the second stage identified the determinants of these inefficiencies. Carlucci et al. (Citation2018) used quartile analysis and censored multiple linear regression to perform a two-stage DEA analysis on 33 sugar and ethanol companies in the Piracicaba area of São Paulo from 2010 to 2011 and 2014 to 2015 and then proposed best practices to improve the technical efficiencies and competitiveness.
2.2. Corporate social responsibility and efficiency
Liquor company social responsibility is closely related to corporate efficiency. Puggioni and Stefanou (Citation2018) formalised and explained the corporate social responsibility (CSR) process, incorporated it into production models, and then analysed the technical efficiencies to quantify the overall value and marginal impact of implementing social responsibility activities, and found that an increase in social responsibility commitments had a positive effect on corporate efficiency.
Corporate social responsibility, which includes environmental responsibilities and charity responsibilities, has been incorporated into some corporate efficiency evaluation systems to examine alcohol and beverage company corporate social responsibility efficiencies.
Environmental responsibility is an important part of liquor company social responsibilities because of the impact that liquor production has on the environment. Jones et al. (Citation2013) collected CSR data on the world's top five spirit and beer producers and found that the integration of CSR in the core businesses at leading spirit and beer producers had consequently influenced the market, the community, the environment and the workplace.
Environmental responsibility research had tended to focus on corporate energy efficiencies such as energy consumption, emissions and resource utilisation. Wang et al. (Citation2019) used a super-slacks-based model to measure the environmental efficiency of Carnival Corporation from 2010 to 2015, and found that Carnival had inefficient air emissions but had improved emissions reduction technology and energy conservation innovation. Vazquez-Rowe et al. (Citation2012) used an LCA + DEA to calculate the efficiencies in 40 wine regions in Rias Baixas in northwest Spain, and found that energy input reductions translated into environmental benefits. Hamed et al (2016) used two DEA methods and life cycle assessment (LCA) to calculate the tea production energy efficiencies in 30 tea plantations in Gilan, Iran, and found that the combined DEA + LCA method improved the energy efficiency and reduced the environmental impact of tea production. Camioto et al. (Citation2017) used a sustainable production concept and DEA to assess the efficiency of the Brazilian industrial sector, including the food and beverage industry, from 1996 to 2009, and found that the variables ‘employees’, ‘fossil fuel carbon emissions’ and ‘energy consumption’ adversely affected the overall efficiencies. Payam et al. (Citation2018) using LCA and DEA to study the energy flow and environmental impact of the production systems in 58 wine estates in Arak, Iran, and found that reducing input consumption could improve production system operating efficiencies, which could reduce costs and the environmental impacts.
Various models have been developed to assess and improve corporate energy efficiency in liquor and beverage companies. For example, Bai et al. (Citation2011) proposed an energy efficient analysis method based on production data that employed DEA, PCA, and a radial basis function neural network (RBFNN) to evaluate and predict the energy efficiency of the beer brewing process. Pu and Bai (Citation2012) used DEA to analyse beer brewing energy efficiency and employed a super-efficiency model to analyse the energy efficiency of multi-batch beer brewing, in which the optimal interval for the energy consumption frontier was obtained from a sensitivity analysis, and the optimal energy consumption frontier was modified online to guide the actual production process. Taulo and Sebitosi (Citation2013) collected data from three Malawi tea factories and proposed a method for generating effective boundaries for multi-objective optimisation problems using index decomposition analysis (IDA), DEA, and evolutionary algorithms. Using energy consumption as an input and index decomposition analysis (IDA), artificial neural network (ANN) and DEA model, Olanrewaju et al. (Citation2015) evaluated food and beverage company efficiencies
DEA models have also been employed to assess the environmental responsibility and corporate efficiency of alcohol companies. Jradi et al. (Citation2018) collected data from 38 wine production companies in Bordeaux, France, and used DEA to evaluate the carbon footprint efficiencies, finding that pesticides, fertilizers and fuels contributed to the carbon footprint and that fuel had more than twice the carbon footprint in vineyards as pesticides or fertilizers. Santos et al. (Citation2018) collected data from 20 wine estates in the Douro Calibration Area and then used DDR to determine the economic, social and environmental efficiencies in the grape production system.
Charity and public welfare responsibilities have also been recognised as important alcohol company social responsibilities, and can have a significant impact on efficiency and competitiveness. Yoon and Lam (Citation2013) collected social responsibility data on three multinational wine companies, and used an iterative method to analyse the related literature, finding that alcohol companies used charity sponsorship as an indirect brand marketing tool to preferentially enter the emerging alcohol market. Pantani et al. (Citation2017) analysed the Corporate Social Responsibility (CSR) practices of the Latin American and Caribbean (LAC) alcohol industry and found that these had a strategic marketing role that exceeded their stated charitable and public health goals. Belasri et al. (Citation2020) used a DEA Dynamic Network Model to analyse 184 banks in 41 countries from 2009 to 2015, and found that corporate social responsibility only had a positive impact on bank efficiency in developed countries.
Therefore, past studies by scholars have found that corporate social responsibility can have a significant impact on business and management efficiency. Therefore, this article proposes the following hypotheses for the analysis of the impact of corporate social responsibility on the efficiencies in 18 Chinese liquor companies.
Hypotheses H1:Corporate social responsibility has a significantly positive effect on liquor company efficiency.
Hypotheses H2:Corporate social responsibility has a significantly negative effect on liquor company efficiency.
2.3. Summary
As there has been little research on the impact of corporate social responsibility on corporate efficiency using DEA, this study used a two-stage DEA model to analyse the impact of liquor company social responsibility on corporate efficiency, which included both environmental responsibility and corporate welfare responsibility, and conducted a two-stage efficiency comparison. This study enriches existing literature on liquor company efficiencies and provides guidance for Chinese liquor companies seeking to improve their operational efficiencies through corporate social responsibility activities.
3. Model and method
DEA models can be divided into radial DEA models and non-radial DEA models. Radial DEA models are either CCR models that have fixed returns to scale or BCC models that have variable returns to scale, with non-radial DEA Slacks-Based Measure (SBM) being proposed by Tone in 2001. However, the radial DEA model was found to ignore non-radial slacks in efficiency evaluations, and the non-radial DEA (such as the SBM) models failed to consider the radial characteristics of the same proportion when evaluating the efficiency slacks. As it considers non-intended output, the DDF (Directional Distance Function) has been commonly used to measure efficiency. As radial measurement models use the same ratios (i.e., β) to increase the desirable output and decrease the undesirable output when calculating the efficiency, it implicitly assumes that all inputs and outputs have the same degree of inefficiency.
Further, as traditional DEA models use an input and output to perform the efficiency conversions between two variables, the conversion process is seen as a ‘black box’. Consequently, Fare et al. (2007) proposed a Network DEA to account for the many sub-production technologies in the production process and labelled each a sub-decision unit (Sub-DMU), after which either CCR or BCC was applied to determine the optimal solution.
Many studies have analysed sub process efficiencies; for example, Chen and Zhu (Citation2004), Kao and Hwang (Citation2008) and Kao (Citation2009) divided the business process into sub-processes, connected each stage with intermediate outputs, and then calculated the efficiencies in each stage under different conditions to determine which sub-processes were responsible for the efficiency losses. Tone and Tsutsui (Citation2009) proposed a weighted slacks-based measures (SBM) network DEA model, used the links between the various departments in a DMU as the analysis basis for the Network DEA model by treating each as a Sub-DMU, and then used an SBM model to determine the optimal solution.
Multi-stage production evaluations have also attracted research attention. Assessing the efficiency of a two-stage process using a two-stage DEA allows for a dynamic approach, in which the DMUs can be evaluated at different time periods and carryovers can be introduced to connect the various stages (Tone & Tsutsui, Citation2010). For example, Klopp (Citation1985) proposed window analysis and Fare and Grosskopf (1996) included interconnecting activities for dynamic DEA. Following these innovations, the dynamic DEA went through further developments (Amirteimoori, Citation2006; Nemotoa and Goto, 1999; Nemoto & Goto, Citation2003; Sueyoshi & Sekitani, Citation2005). Färe and Grosskopf (2009) then made more dynamic DEA modifications and extensions, and Tone and Tsutsui (Citation2010) extended the model to a dynamic analysis of slacks-based measures and subsequently (2014) proposed a weighted slack-based measures dynamic network DEA model that used the links between the various departments of the DMUs as the basis for the network DEA model analysis, with each department being treated as sub-DMU and the carry-over activities being the links.
In line with these innovations, this paper used a dynamic two-stage DEA and a DDF (Directional Distance Function) model to propose a dynamic two-stage directional distance function (Dynamic two-stage Directional Distance Function) model to solve the problems associated with static and single-stage models. Applying this new mode to the assessment of Chinese liquor industry corporate social responsibility allowed for a full understanding of the operational performance and avoided any undervalued or overvalued efficiencies.
3.1. Dynamic two-stage DDF model
Based on a technology or production possibility set (PPS), the Dynamic two stage DDF model is defined as a set (x, y), where x is a vector of m inputs and y is a vector of s outputs. L(y)= {(x, y) | x can produce y}. To consider the direction vector of each input-output Chung et al. (Citation1997) proposed the directional distance function (DDF):
and
: which was related to the jth DMU input and output direction vector and direction distance function
DMU has two stages, S1 and S2, in each time period t; therefore, t = 1, .., T, in each time period. S1 has m inputs
that generate D intermediate goods
and a desirable output
and S2, through the intermediate goods
and input
generates the desirable output
with
being the carry-over.
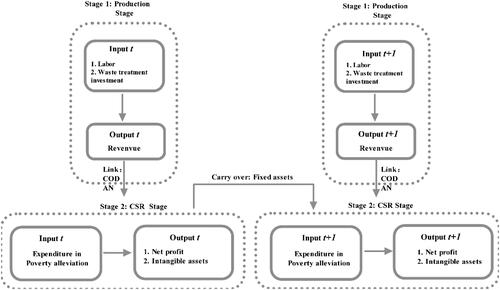
In S1, the input is the labour and waste treatment investment, output
is the revenue and the intermediate
is the chemical oxygen demand (COD) and ammonia (AN). In S2, the input
is poverty alleviation, the output
is net profit and intangible assets and the carry-over
is fixed assets.
The efficiency of the decision-making unit is therefore;
(1)
(1)
s.t.
(2)
(2)
(3)
(3)
where
is the weight of time t and
and
are the weights assigned to S1 and S2 in time period t. Therefore, for every t,
The following four efficiency groups can be calculated using linear programming models (1-3):
The first stage efficiency
In this group, the efficiency of stage 1 (l = 1, 2) for the DMU being evaluated is relative to each period t (t = 1, 2, ⋯, T). The stage efficiency is:
(4)
(4)
and the second stage efficiency is:
(5)
(5)
Period efficiency
In this group, the overall efficiency for each period t of the DMU being evaluated is expressed as follows:
(6)
(6)
Overall efficiency
In this group, the overall efficiency of the DMU is evaluated. The overall efficiency is the weighted sum of the periodic efficiency at t, which is expressed as;
(7)
(7)
3.2. Labour, wastewater treatment, poverty alleviation, revenue, net profit, and intangible assets
Hu and Wang (2006)’s total-factor energy efficiency index was employed to overcome any possible bias in the traditional energy efficiency indicators. There were six key variables in this study: labour, wastewater treatment, poverty alleviation, revenue, net profit and intangible assets: with ‘I’ representing area and ‘t’ representing time.
The six efficiency models are defined in the following expressions:
(4)
(4)
(5)
(5)
(6)
(6)
(7)
(7)
(8)
(8)
(9)
(9)
If the target labour, wastewater treatment and poverty alleviation inputs equalled the actual inputs, then the labour, wastewater treatment and poverty alleviation efficiencies were 1, indicating overall efficiency. However, if the target labour, wastewater treatment and poverty alleviation inputs were less than the actual inputs, then the labour, wastewater treatment and poverty alleviation efficiencies were less than 1, indicating overall inefficiency.
If the target revenue, net profit and intangible assets desirable output were equal to the actual revenue, net profit and intangible assets output, then the revenue, net profit and intangible assets efficiencies were 1, indicating overall efficiency. However, if the actual revenue, net profit and intangible assets desirable output were less than the target revenue, net profit and intangible assets desirable output, then the revenue, net profit and intangible assets efficiencies were less than 1, indicating overall inefficiency. Based on above models, a two-stage DEA model flowchart was proposed as shows.
Figure 1. Two-stage DEA model flowchart.
Source: Authors.
4. Data analysis and results
4.1. Statistical analysis of the data sources and input-output indicators
4.1.1. Data source description and statistical analysis
All data in this study for the listed liquor companies (see ) from 2017 to 2019 were obtained from CSR bulletins, annual reports and Chinese Statistical Year books.
Table 1. Liquor company codes.
The input indicators were labour, waste water treatment investment and poverty alleviation expenditure, and the output indicators were revenue, net profit and intangible assets end book value.
The indicator definitions and units were as follows:
Labour: Number of employees in the company over the years, unit: people.
Fixed assets: total assets and facilities investment; unit: 10,000 CNY.
Wastewater treatment investment: funds invested by enterprises in wastewater treatment over the years, unit: 1,000 CNY.
Poverty Alleviation expenditure: Poverty alleviation funds invested by enterprises over the years, unit: 10,000 CNY.
Revenue:Enterprise income from the main business or other business over the years, unit: 1,000 CNY.
Net profit: the total amount of corporate profits over the years minus income tax, unit: 1,000 CNY.
Intangible assets: the balance of the company's intangible assets over the years minus the amortisation of intangible assets and the remaining balance of intangible asset impairment provisions, unit: 1,000 CNY.
Chemical Oxygen Demand: the equivalent oxygen consumed when organic matter in a water sample is oxidised using a strong chemical oxidising agent to indicate the organic matter in the water unit: mg/L.
Ammonia: Air pollutants by production sector emissions in each company in each year, unit: Tonnes.
4.1.2. Basic statistical data analysis
The statistical data analysis (see ) revealed that there was a large labour gap in the sample of listed companies. While the maximum labour increased over the three years, it did not change much from 2016 to 2017. The minimum increased from 2016 to 2017, but declined in 2018; however, by 2018, the gap between the maximum and minimum had widened. The average slowly increased, indicating that the scale at most liquor companies was still slowly expanding.
Figure 2. Labour (unit: people).
Source: Authors.
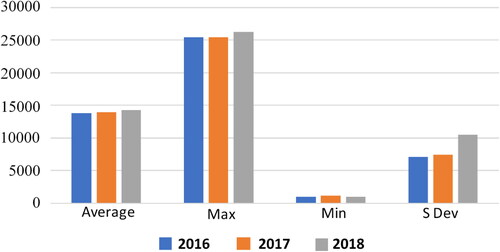
Figure 3. Fixed assets (unit: 10,000 CNY).
Source: Authors.
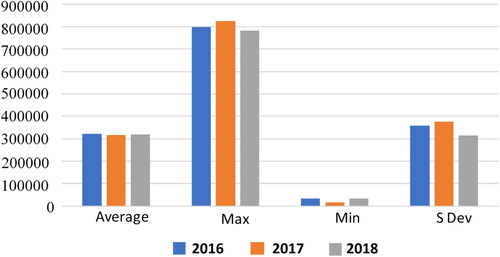
Figure 4. Revenue (unit: 1,000 CNY).
Source: Authors.
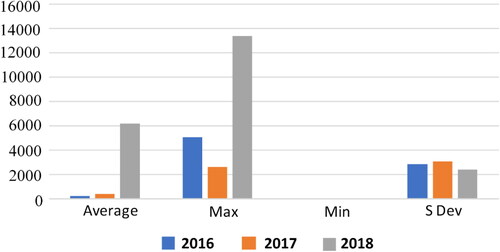
Figure 5. Intangible assets (unit: 1,000 CNY).
Source: Authors.
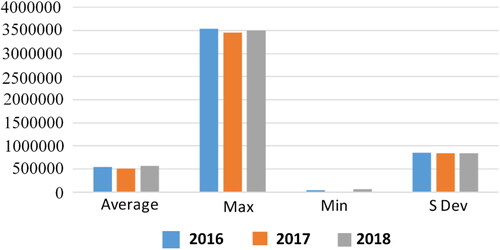
Figure 6. Net profit (unit: 1,000 CNY).
Source: Authors.
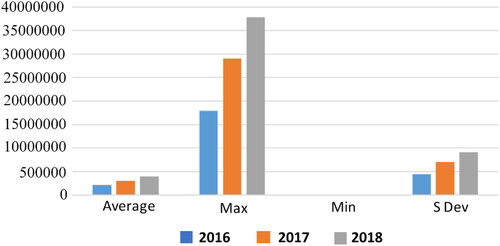
Figure 7. Poverty alleviation funding (unit: 10,000 CNY).
Source: Authors.
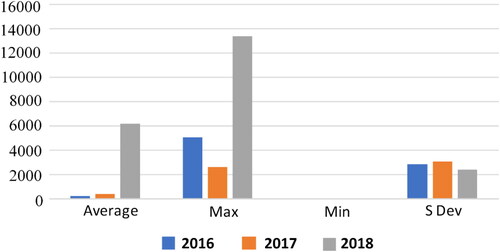
Figure 8. Wastewater treatment investment (unit: 1,000 CNY).
Source: Authors.
The fixed assets maximum increased from 2016 to 2017, but declined in 2018, the minimum decreased in 2017, but increased again in 2018 to be the same as in 2016 and similarly, the average declined slightly in 2017 and then slightly rebounded in 2018 to be around the same as in 2016.
The intangible assets maximum was the highest in 2018, the minimum fell from 2016 to 2017 and rose slightly in 2018 and the average mirrored the changes in the minimum.
The net profit maximum increased over the three years, with the increase in 2017 being greater than the increase from 2016 to 2017. There was a large difference between the net profit minimum and the net profit maximum. In 2017, the difference between the net profit minimum and maximum was the largest in the three years.
The revenue maximum increased over the three years, with the increase in 2017 being greater than the increase from 2016 to 2017. There was a large difference between the net profit minimum and the net profit maximum
The poverty alleviation funding maximum value was the highest in 2018 at 130 million CNY after a decline in the second half of 2017. The average poverty alleviation funding increased slightly from 2016 to 2017, but there was a larger increase in 2018, which indicated that the enterprises were becoming more actively involved in poverty alleviation. The minimum poverty alleviation funding was in SXNY, QQKJ and WWGF at only 10,000 CNY; therefore, there was a significant difference between the largest poverty alleviation funding and the smallest poverty alleviation funding.
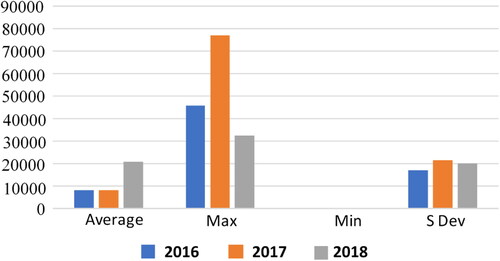
The wastewater treatment investment maximum increased from 2016 to 2017, but decreased in 2018 to be lower than in 2016. The wastewater treatment investment average increased after 2017 and there was a significant difference between the wastewater treatment investment minimum and the wastewater treatment investment maximum. The minimum wastewater treatment investment in all three years was at SJF at 5,00,000 CNY.
4.2. Overall efficiency
4.2.1. Efficiency, average efficiency and ranking by year
The annual efficiencies (see ) at SJF, SXNY and WWGF were 1; therefore, no improvements were needed; and the annual efficiencies at JZZJ and MT were between 0.80 and 1. SDJY, YHGF, YLT and YJGJ had annual efficiencies below 0.60 and YLT and YJGJ had annual efficiencies below 0.40 in all 3 years; therefore, these companies needed significant efficiency improvements. Nine liquor company had significantly changing efficiencies over the 3 years. The annual efficiency at GJGJ jumped from 0.2271 to 1 and at LBGJ jumped from 0.0871 to 1; however, there were more liquor companies with efficiencies below 0.60 each year than liquor companies with efficiencies of 0.60 or higher, which indicated that most liquor companies had poor annual efficiency.
Table 2. Annual enterprise efficiencies.
From 2016 to 2018, three liquor companies had efficiencies of 1 and four had increasing efficiencies, with the increase at SXFJ from 0.5297 in 2016 to 1 in 2018 being the largest. Five liquor companies had declining efficiencies, with LBGJ experiencing the largest fall from 1 in 2016 to 0.0871 in 2018. Six liquor companies had efficiency fluctuations, two of which first fell and then rose, and four of which first rose and then fell. The efficiency at most liquor companies was declining.
4.2.2. Efficiency, average efficiency and rankings in each stage
From , we could find the efficiency score andranking in each stage.
Table 3. Efficiencies in each stage.
① First stage
The annual efficiencies at LZLJ, SXFJ, SJF, SXNY and WWGF were 1, the annual efficiencies at JZZJ and MT were between 0.8 and 1 and the annual efficiency at YHGF was between 0.6 and 0.8; however, the annual efficiency at YJGJ was below 0.4 at between 0.2 and 0.4. Nine liquor companies experienced large changes in efficiency over the three years, of which SDJY had the largest change of 0.8563.
From 2016 to 2018, there were five liquor companies with overall efficiencies of 1 and the efficiencies at two liquor companies continued to rise, with SDJY ‘s increase from 0.1437 in 2016 to 1 in 2018 being the largest. Four liquor companies had falling efficiencies and seven had efficiency fluctuations, five of which rose then fell and two of which fell and then rose. Therefore, there were more liquor companies with fluctuating and falling overall efficiencies that those with perfect or rising efficiencies.
② Second stage
The annual efficiencies at JZZJ, MT, SJF, SXNY and WWGF were all 1; however, at JHJ, SDJY, YHGF, YLT and YJGJ, they were less than 0.6. Eight liquor companies had large efficiency changes over the three years, with QQKJ having the largest change of 0.996.
From 2016 to 2018, five liquor companies had total efficiencies of 1, two liquor companies had rising efficiencies, with SXFJ’s increase from 0.0549 in 2016 to 1 in 2018 being the largest, and four liquor companies had total efficiency declines, with JGJ having the largest at 0.9921. Seven liquor companies had total efficiency fluctuations, three of which first fell then rose and four of which first rose and then fell. Therefore, in general, there were more liquor companies with either fluctuating or falling efficiencies than companies with perfect or rising efficiencies.
The above results indicated that due to good asset allocation and utilisation, most companies had reasonable production stage efficiencies, but lacked good social responsibility. However, the effect of CSR on corporate reputation and market prices is generally not reflected in the current period, resulting in a relatively low average overall social responsibility efficiency. The companies were more inefficient because of differences in brand value, poorer resource allocation, and lower governance.
Overall, in the first and second stages, the efficiencies either fluctuated or declined; however, there were more liquor companies with efficiencies below 0.6 in the second stage than in the first stage. SJF, SXNY and WWGF had first and second stage efficiencies of 1 in all three years, four liquor companies had efficiency changes of more than 0.5 in the first stage, with the maximum change being 0.8563, and six liquor companies had changes of more than 0.5 in the second stage, with the largest change being 0.996. Generally, the second stage efficiencies were higher than the first stage efficiencies.
4.3. Average efficiencies for each indicator and associated ranking
4.3.1. Labour, wastewater treatment, poverty alleviation indicators
The annual labour efficiencies (see ) at LZLJ, SXFJ, SJF, SXNY and WWGF were all 1 and at JHJ, MT, YHGF were between 0.80 and 1; however, YJGJ's annual labour efficiency was below 0.60, and its three-year efficiency was below 0.40; therefore, the company’s performance was extremely poor.
Table 4. Labour efficiency score.
Nine liquor companies had efficiency changes over the three years. The annual labour efficiency at LBGJ jumped from 0.2707 to 1, which indicated that there were large gaps in the labour index efficiencies each year. Overall, however, most liquor companies had labour efficiencies over 0.60, which indicated that the labour index efficiency was slowly improving, but that there was also a need to improve labour utilisation and productivity, possibly through training and development.
Between 2016 and 2018, five liquor companies had labour efficiencies of 1, four liquor companies has rising labour efficiencies, with JZZJ in particular, increasing from 0.196 in 2016 to 1 in 2018. The labour efficiencies at three liquor companies, however, continued to decline, with the efficiency drop at LBGJ from 1 in 2016 to 0.2707 in 2018 being the largest. Six liquor companies had fluctuating labour efficiencies, two of which first fell then rose, and four of which first rose and then fell. Overall, there were more companies with fluctuating or falling labour efficiencies.
The annual wastewater treatment efficiencies (see ) at LZLJ, SXFJ, SJF, SXNY and WWGF were all 1, at JHJ was between 0.80 and 1, and at YLT was between 0.60 and 0.80; however, YJGJ's annual wastewater treatment efficiency was below 0.60. Ten liquor companies experienced large wastewater treatment efficiency changes over the 3 years; for example, SDJY's jumped from 0.2513 to 1. While most liquor companies experienced wastewater treatment efficiency changes over the period, in general, significant wastewater treatment efficiency improvements were necessary because of low wastewater treatment technologies and poor governance.
Table 5. Wastewater treatment efficiency.
Between 2016 and 2018, five liquor companies had wastewater treatment efficiencies of 1 and at two liquor companies the efficiencies continued to rise, with SDJY’s increase from 0.2513 in 2016 to 1 in 2018 being the largest. The wastewater treatment efficiencies at four liquor companies continued to decline, with LBGJ’s fall from 1 in 2016 to 0.2707 in 2018 being the largest. Seven liquor companies had fluctuating wastewater treatment efficiencies, two of which first fell and then rose, and five of which first rose and then fell. Therefore, there were more liquor companies with fluctuating or falling wastewater treatment efficiencies.
The annual poverty alleviation efficiencies (see ) at JZZJ, MT, SJF, SXNY and WWGF were all 1, and at WLY was between 0.80 and 1; however, at JHJ, SDJY, YHGF, YLT and YJGJ, the annual poverty alleviation efficiencies were below 0.60, with the efficiencies at SDJY, YLT and YJGJ being below 0.40 each year. Seven liquor companies had significant poverty alleviation efficiency changes over the three years; for example, the annual poverty alleviation efficiency at QQKJ jumped from 0.0079 to 1. Therefore, in general the annual poverty alleviation efficiencies in most liquor companies were below 0.60. This appeared to be because the poverty alleviation effects of most companies' investments and the impacts on the company's brand reputations were relatively slow, which led to the low efficiency scores.
Table 6. Poverty alleviation efficiency.
In each year from 2016 and 2018, five liquor companies had poverty alleviation efficiencies of 1 and at two liquor companies continued to rise, with SXFJ’s increase from 0.1121 in 2016 to 1 in 2018 being the largest; four liquor companies, however, had declining poverty alleviation efficiencies, with JGJ‘s drop from 1 in 2016 to 0.0157 in 2018 being the largest. Seven liquor companies had fluctuating poverty alleviation efficiencies, three of which first fell and then rose, and four of which first rose and then fell. Therefore, there were more liquor companies with fluctuating or falling poverty alleviation efficiencies.
There were large differences in the environmental protection and poverty alleviation efficiencies of the liquor companies, with the overall poverty alleviation efficiency not reaching the Pareto optimal effect. Therefore, government incentives are needed to motivate positive company public welfare behaviour.
As shown in , the poverty alleviation and wastewater efficiencies at SJF, SXNY and WWGF were all 1. GJGJ, JSY, JHJ, LBGJ, LZLJ, QQKJ, SXFJ, SDJY, YHGF, YLT and YJGJ had higher wastewater treatment efficiencies than poverty alleviation efficiencies; for example, JHJ ranked 6th in wastewater treatment efficiency, but fifteenth in poverty alleviation efficiency and LZLJ ranked first in wastewater treatment efficiency, but seventh in poverty alleviation efficiency. However, MT, WLY and JZZJ and JGJ had higher poverty alleviation efficiencies than wastewater treatment efficiencies; for example, MT ranked 7th in wastewater treatment efficiency, but 1st in poverty alleviation efficiency.
Table 7. Wastewater treatment and poverty alleviation efficiencies.
The first-line liquor companies all had the ability to fulfil their public welfare social responsibilities, which could enhance their brand reputation and result in greater corporate benefits. However, the second and third-line brand companies could achieve better efficiency by focusing on more direct environmental actions such as wastewater treatment.
Generally, the wastewater treatment efficiencies were higher than the poverty alleviation efficiencies. Because companies are able to individually decide on effective wastewater treatments, the environmental improvements are more obvious; however, as poverty alleviation efforts have a lag, the impact is slower, which showed up as relatively poor poverty alleviation efficiencies in most companies. The wastewater treatment input-output allocations in most companies were more reasonable than the poverty alleviation input-output allocations because the state has stricter enterprise environmental protection requirements that predate any poverty alleviation contributions. Therefore, the enterprise wastewater treatment output efficiency was higher than the output effect of the poverty alleviation inputs.
The analysis indicated that governments need to implement policies and strict emissions standards to support and encourage Chinese liquor companies to be more environmentally responsible and increase their wastewater treatment investment.
4.3.2. Revenue, net profit, intangible assets indicators
The revenue efficiencies (see ) at LZLJ, SXFJ, SJF, SXNY and WWGF were all 1, at JZZJ, MT, WLY and YHGF were between 0.80 and 1 and at YJGJ, ranged from 0.60 to 0.80. Eight liquor companies had revenue efficiency changes over the three years; for example, QQKJ's annual revenue efficiency rose from 0.5 to 1; no liquor company revenue efficiency was below 0.60 and most had increasing efficiencies.
Between 2016 and 2018, five liquor companies had revenue efficiencies of 1 and the efficiencies at two companies continued to rise, with SDJY’s increase from 0.7002 in 2016 to 1 in 2018 being the largest. The revenue efficiencies at four liquor companies continued to decline, with LBGJ’s fall from 1 in 2016 to 0.5001 in 2018 being the largest. Seven liquor companies had fluctuating revenue efficiencies, two of which first fell and then rose, and five of which first rose and then fell. Therefore, in general, there were more companies with fluctuating or falling revenue efficiencies. Overall, the revenue efficiency in some companies needed improvements, with the input and output resource production and operation efficiencies in particular needing specific improvements.
Table 8. Revenue efficiencies.
The annual net profit efficiencies (see ) at JZZJ, MT, SJF, SXNY and WWGF were all 1, at LZLJ and WLY were between 0.80 and 1 and at SDJY, YHGF, YLT and YJGJ were between 0.60 and 0.80. Seven liquor companies had annual net profit efficiency changes over the three years; for example, LBGJ's annual net profit efficiency changed from 0.5728 to 1; and no liquor company had an annual net profit efficiency below 0.60, indicating that the net profit efficiency was relatively good.
Table 9. Net profit efficiency score.
Between 2016 and 2018, five liquor companies had net profit efficiencies of 1, and the net profit efficiencies at two liquor companies continued to rise, with SXFJ’s increase from 0.6801 in 2016 to 1 in 2018 being the largest. Five liquor companies had declining net profit efficiencies, with LBGJ’s fall from 1 in 2016 to 0.5728 in 2018 being the largest. Six liquor companies had fluctuating net profit efficiencies, two of which first fell and then rose, and four of which first rose and then fell. Therefore, there were more liquor companies with fluctuating or falling net profit efficiencies. The poor net profit efficiencies, which included the poverty alleviation and wastewater treatment investments, may have been the result of insufficient resource utilisation and allocation efficiencies; therefore, many companies still needed improvements.
The intangible assets efficiencies (see ) at JZZJ, MT, SJF, SXNY and WWGF were 1, and at YJGJ was between 0.60 and 0.80; however, the intangible assets efficiency at YLT was poor at below 0.60. Eleven liquor companies experienced significant changes in intangible assets efficiencies over the three years; for example, the intangible assets efficiency at QQKJ varied from 0.5637 to 1.
Table 10. Intangible assets efficiencies.
Between 2016 and 2018, five liquor companies had intangible assets efficiencies of 1, the intangible assets efficiencies at three liquor companies continued to rise, with LZLJ’s rise from 0.6665 in 2016 to 1 in 2018 being the largest, and five liquor companies had declining intangible assets efficiencies, with WLY’s drop from 1 in 2016 to 0.6039 in 2018 being the largest. Therefore, in general, more liquor companies had fluctuating or falling intangible assets efficiencies.
Overall, the low intangible assets efficiencies were because of poor brand promotion, underestimated brand value, slow wastewater treatment and poverty alleviation investment effects, and low resource allocation rationality; therefore, sustained efforts in these areas would improve the intangible assets efficiencies.
As shown in , the poverty alleviation, net profit and intangible assets efficiencies at JZZJ, MT, SJF, SXNY and WWGF were all 1; therefore, the efficiency were good. At GJGJ, JSY, JHJ, JGJ, LZLJ, QQKJ, SXFJ, SDJY, YHGF, YLT and YJGJ, the poverty alleviation, net profit and intangible asset efficiencies were equally ranked or had efficiency differences of only one or two ranks. For example, JHJ ranked 15th in poverty alleviation efficiency, net profit efficiency, and intangible asset efficiency, and LZLJ ranked 7th in poverty alleviation efficiency and net profit efficiency and 8th in intangible assets efficiency.
Table 11. Poverty alleviation, net profit, and intangible asset efficiencies.
Most Chinese liquor companies had similar net profit, intangible asset and poverty alleviation efficiencies. The Chinese liquor companies with high poverty alleviation efficiencies were also found to have higher net profit and intangible assets efficiencies, and Chinese liquor companies with low poverty alleviation efficiencies also had lower net profit and intangible assets efficiencies.
4.4. Correlation analysis test
In this section, correlation analysis is applied to estimate the CSR (poverty alleviation), overall efficiency and net profit efficiency of China’s liquor companies.
The correlation test results shown in indicate that the CSR overall efficiency and net profit efficiency correlation coefficients in 2016 were 0.85995 and 0.98164, in 2017 were 0.93895 and 0.98213 and in 2018 were 0.91687 and 0.93121, which as they were all over 0.5 (p-value less than 0.05) indicated that there were high correlations, thereby proving H1.
Table 12. From 2016 to 2018 CSR (poverty alleviation), overall efficiency and net profit efficiency correlation test.
5. Conclusions and policy recommendations
In this study, a DEA model was used to analyse the annual efficiencies and the labour, wastewater treatment, poverty alleviation, revenue, net profit, and intangible assets stage efficiencies of Chinese liquor companies, from which the following conclusions were made.
Overall, the annual efficiencies from 2016 to 2018 at the Chinese liquor companies were mainly fluctuating or declining. Of the 18 companies, only 3 companies: SJF, SXNY and WWGF: had overall efficiencies of 1, which indicated that the input-output ratios had reached an ideal state. However, average total efficiency improvements were needed in the other 15 companies and in particular in JHJ, JGJ, QQKJ, SDJY, YHGF, YLT and YJGJ, all of which had overall efficiencies below 0.6. The lowest average overall efficiency was in YLT at only 0.31, followed by SDJY at 0.40 and three companies with average total efficiencies of only 0.6-0.8. Therefore, the annual Chinese liquor company efficiencies from 2016 to 2018 were mainly fluctuating or declining and most companies needed some improvements
Ten companies had higher average production stage efficiencies than average CSR stage efficiencies, with only JZZJ, YLT and YJGJ having average production stage efficiencies less than 0.6. However, seven companies: JHJ, QQKJ, SXFJ, SDJY, YHGF, YLT and YJGJ: had average CSR efficiencies below 0.6, of which YLT had the lowest at only 0.04. While the annual production and CSR stage efficiencies were volatile and declining, the second stage efficiencies were higher than the first stage.
Except for LZLJ, SXFJ, SJF, SXNY and WWGF, all of which had annual labour efficiencies of 1, labour efficiency improvements were needed in the other 13 companies, with the average labour efficiency of 0.34 in YJGJ 0.6 at JGJ being the most urgent. Of the other 11 companies, nine had labour efficiencies between 0.7 and 0.85 and JHJ and MT had labour efficiencies higher than 0.94. In general, from 2016 to 2018, the annual liquor companies’ labour efficiencies were mainly fluctuating or declining.
Of the 18 companies, YJGJ has the lowest wastewater treatment efficiency at only 0.44, YHGF and JGJ had wastewater treatment efficiencies lower than 0.6, two companies had wastewater treatment efficiencies between 0.6 and 0.7, eight companies had wastewater treatment efficiencies higher than 0.7 and lower than 0.95 and five companies had wastewater treatment efficiencies of 1. Most liquor companies experienced significant wastewater treatment efficiency changes over the three years. In general, from 2016 to 2018, the annual liquor companies’ wastewater treatment efficiencies were mainly fluctuating or declining.
Most companies had poor poverty alleviation efficiencies。JZZJ, MT, SJF, SXNY and WWGF and other five companies has poverty alleviation efficiencies of 1 and the poverty alleviation at WLY was 0.95 and at LZLJ was 0.91; however, the poverty alleviation efficiencies at the other 11 companies were all lower than 0.7; therefore, the poverty alleviation efficiencies need a great deal of improvement. The lowest poverty alleviation efficiency score was at YLT at only 0.07, followed by SDJY and YJGJ at only 0.14. In general, from 2016 to 2018, the annual liquor companies’ poverty alleviation efficiencies were fluctuating or declining.
Except for SJF, SXNY and WWGF, which all had wastewater treatment and poverty alleviation efficiencies of 1, the wastewater treatment efficiencies at 11 enterprises were higher than the poverty alleviation input efficiencies, with JZZJ, JGJ and MTWLY having higher poverty alleviation efficiencies than wastewater treatment efficiencies. However, YLT's average poverty alleviation efficiency was much lower than the other companies at only 0.07; therefore, significant improvements are needed.
LZLJ, SXFJ, SJF, SXNY and WWGF had revenue efficiencies of 1, the other 13 companies had revenue efficiencies of higher than 0.7, with YJGJ having the lowest revenue efficiency at 0.73. In general, from 2016 to 2018, the liquor companies’ revenue efficiencies were fluctuating or declining.
Overall, the average net profit efficiencies in 13 companies needed improvements. Seven companies had average net profit efficiencies higher than 0.8 and the other six: JHJ, QQKJ, SDJY, YHGF, YLT and YJGJ: had average net profit efficiencies lower than 0.75 but higher than 0.66, the lowest of which was SDJY. From 2016 to 2018, the annual net profit liquor company efficiencies were mainly fluctuating and declining.
Six of the 13 companies had intangible assets efficiencies of less than 0.8, with the lowest being YLT at 0.53. In general, the average intangible assets efficiencies were mainly fluctuating and declining.
Based on the above, the following policy recommendations are given.
Government and liquor industry perspective
Benchmarking companies such as WLY and MT could exemplify their social responsibility efforts to encourage others to improve their social responsibility.
The wastewater treatment efficiencies at the Chinese liquor companies were found to be higher than the poverty alleviation efficiencies primarily because wastewater treatment has a short-term direct impact on environmental improvement. Other enterprises should focus on monitoring their environmental responsibilities and encouraging greater investments in environmental protection.
The government should praise outstanding enterprises for their poverty alleviation and environmental protection behaviours, which could have a positive impact on the company's brand and reputation, thereby incentivising other companies to improve their social responsibility.
The official media annually selects winners for the ‘People's Corporate Social Responsibility Award’, the ‘Annual Poverty Alleviation Award’, and the ‘Recommended Cases for Building a Model for Precision Poverty Alleviation Ability’, which encourages companies to establish good brand images. However, praising outstanding companies should not only be done by the official media as the government should also give recognition awards to highly performing companies that fulfil their social and environmental responsibilities.
The Ministry of Industry and Information Technology of the People's Republic of China has awards for outstanding ‘green factories’, Sichuan awards outstanding companies with their ‘Annual Environmental Integrity Enterprise’, and prefecture-level cities award outstanding enterprises as ‘Advanced Responsible Units for Environmental Quality Continuous Improvement and Performance Evaluation.’ However, the government should strengthen the commendations for liquor companies that demonstrate good environmental and social responsibility.
The government needs to formulate strict discharge standards and strictly monitor company wastewater discharges to encourage them to strengthen their wastewater treatment investments.
In 2012, the Ministry of Environmental Protection and the General Administration of Quality Supervision, Inspection and Quarantine of the People's Republic of China implemented the ‘Water Pollutant Discharge Standards for the Liquor Industry’ (GB 27631-2001), which set specific requirements for the discharge of liquor industry water pollutants. In 2018, the Ministry of Environmental Protection of the People's Republic of China formulated the ‘Policy for the Prevention and Control of Pollution in the Beverage and Wine Manufacturing Industry’ (Ministry of Environmental Protection Announcement No. 7 of 2018), which put in place strict technical regulations on pollution prevention and control in beverage and wine manufacturing and production processes. The government should strengthen the supervision of wastewater discharge standards, define the incentives and punishment measures, and improve wastewater treatment efficiency.
Enterprises perspective
The environmental treatment and social responsibility investment achievements companies make impact their brand reputations; therefore, strategic company planning needs to include specific goals and objectives that highlight their environmental and social responsibilities.
In addition to participating and investing in poverty alleviation programs and other social public welfare activities, other front-line brand enterprises such as MT and WLY should also focus on ensuring wastewater treatment investment efficiencies by including technological research and development investments and waste water treatment technologies into corporate social responsibility performance activities.
Second and third-tier brand manufacturers need to examine the expected benefits of their short-term social responsibility inputs from a strategic perspective, and improve their brand reputations through product quality improvements and effective environmental responsibility
Differences in production characteristics, brand advantages, and reputation have led to a lack of clarity regarding company social responsibility investments. Therefore, the active support and encouragement of both the government and industry are needed to maintain company enthusiasm for social responsibility investments.
Note
1. Due to the legal restrictions in China, the full names of the liquor companies cannot be revealed.
Disclosure statement
No potential conflict of interest was reported by the authors.
Additional information
Funding
References
- Amirteimoori, A. (2006). Data envelopment analysis in dynamic framework. Journal of Applied Mathematics and Computing, 181(1), 21–28. https://doi.org/https://doi.org/10.1016/j.amc.2006.01.003
- Aparicio, J., Borras, F., Pastor, J. T., & Vidal, F. (2013). Accounting for slacks to measure and decompose revenue efficiency in the Spanish Designation of Origin wines with DEA. European Journal of Operational Research, 231(2), 443–451. https://doi.org/https://doi.org/10.1016/j.ejor.2013.05.047
- Aparicio, J., Garcia-Nove, E. M., Kapelko, M., & Pastor, J. T. (2017). Graph productivity change measure using the least distance to the Pareto-efficient frontier in data envelopment analysis. Omega, 72, 1–14. https://doi.org/https://doi.org/10.1016/j.omega.2016.10.005
- Arunkumar, O. N., & Ramanan, T. R. (2017). Operational efficiency and its determinants of Indian food and beverages industries: A DEA approach. International Journal of Services and Operations Management, 27(1), 1–18. https://doi.org/https://doi.org/10.1504/IJSOM.2017.083332
- Bai, J., Pu, T., & Xing, J. (2011). Research on energy consumption analysis of beer brewing process [Paper presentation]. International Conference on Electronic and Mechanical Engineering and Information Technology.
- Banker, R. D., Charnes, A. C., & Cooper, W. W. (1984). Some models for estimating technical and scale inefficiencies in data envelopment analysis. Management Science, 30(9), 1078–1092. https://doi.org/https://doi.org/10.1287/mnsc.30.9.1078
- Bayraktar, E., Gunasekaran, A., Koh, S. C L., Tatoglu, E., Demirbag, M., & Zaim, S. (2010). An efficiency comparison of supply chain management and information systems practices: A study of Turkish and Bulgarian small- and medium-sized enterprises in food products and beverages. International Journal of Production Research, 48(2), 425–451. https://doi.org/https://doi.org/10.1080/00207540903174957
- Belasri, S., Gomes, M., & Pijourlet, G. (2020). Corporate social responsibility and bank efficiency. Journal of Multinational Financial Management, 54, 100612. https://doi.org/https://doi.org/10.1016/j.mulfin.2020.100612
- Camioto, F. D. C., Mariano, E. B., & Nascimento, R. D. A. (2017). Sustainability improvement opportunities in Brazilian sectors: Analhysis of DEA slacks. Brazilian Journal of Operations& Production Management, 14(3), 363–370.
- Carlucci, F. V., Salgado, J. A. P., & Lemos, S. V. (2018). Proposed best operating practices to improve technical efficiency in Brazilian sugar and ethanol plants [Paper presentation]. 40th Annual Conference of the Australian-Society-of-Sugar-Cane-Technologists (ASSCT).
- Charnes, A. C., Cooper, W. W., & Rhodes, E. L. (1978). Measuring the efficiency of decision making units. European Journal of Operational Research, 2(6), 429–444. https://doi.org/https://doi.org/10.1016/0377-2217(78)90138-8
- Chen, C. M. (2009). Network-DEA, A model with new efficiency measures to incorporate the dynamic effect in production networks. European Journal of Operational Research, 194(3), 687–699. https://doi.org/https://doi.org/10.1016/j.ejor.2007.12.025
- Chen, M. J., Chiu, Y. H., Jan, C. L., Chen, Y. C., & Liu, H. H. (2015). Efficiency and risk in commercial banks – Hybrid DEA estimation. Global Economic Review, 44(3), 335–352. https://doi.org/https://doi.org/10.1080/1226508X.2015.1067865
- Chen, Y., & Zhu, J. (2004). Measuring information technology's indirect impact on firm performance. Information Technology and Management, 5(1/2), 9–22. https://doi.org/https://doi.org/10.1023/B:ITEM.0000008075.43543.97
- Chung, Y. H., FäRe, R., & Grosskopf, S. (1997). Productivity and undesirable outputs: A directional distance function approach. Journal of Environmental Management, 51(3), 229–240. https://doi.org/https://doi.org/10.1006/jema.1997.0146
- Färe, R., & Grosskopf, S. (1996). Productivity and intermediate products: A frontier approach. Economics Letters, 50(1), 65–70. https://doi.org/https://doi.org/10.1016/0165-1765(95)00729-6
- Färe, R., & Grosskopf, S. (2010). Directional distance functions and slacks-based measures of efficiency. European Journal of Operational Research, 200(1), 320–322. https://doi.org/https://doi.org/10.1016/j.ejor.2009.01.031
- Färe, R., Grosskopf, S., & Whittaker, G. (2007). Network DEA. In Zhu & Cook (eds.), Modeling Data Irregularities and Structural Complexities in Data Envelopment Analysis (pp. 209–240). New York, USA: Springer.
- Fernando, V., Pastor, J. T., & Borras, F. (2013). Efficiency analysis of the designations of origin in the Spanish wine sector. Spanish Journal of Agricultural Research, 11(2), 294–304.
- Galluzzo, N. (2018). A non-parametric analysis of technical efficiency in Bulgarian farms using the FADN dataset. European Countryside, 10(1), 58–73. https://doi.org/https://doi.org/10.2478/euco-2018-0004
- Giovanna, B. M., Claudio, D., & Marco, V. (2019). Comparative efficiency of agricultural cooperatives and conventional firms in a sample of quasi-twin companies. Annals of Public and Cooperative Economics, 90(1), 53–56.
- Goncharuk, A. G. (2009). Improving of the efficiency through benchmarking: A case of Ukrainian breweries. Benchmarking: An International Journal, 16(1), 70–87. https://doi.org/https://doi.org/10.1108/14635770910936522
- Goncharuk, A. G., & Figurek, A. (2017). Efficiency of winemaking in developing countries. International Journal of Wine Business Research, 29(1), 98–118. https://doi.org/https://doi.org/10.1108/IJWBR-02-2016-0007
- Goncharuk, A. G., & Lazareva, N. (2017). International performance benchmarking in winemaking. Benchmarking: An International Journal, 24(1), 24–33. https://doi.org/https://doi.org/10.1108/BIJ-07-2015-0071
- Hamed, K. P., Ashkan, N. P., & O'Dwyer, J. (2017). Environmental management of tea production using joint of life cycle assessment and data envelopment analysis approaches. Environmental Progress & Sustainable Energy, 36(4), 1116–1121.
- Jones, P., Hillier, D., & Comfort, D. (2013). The leading spirits and beer companies and corporate social responsibility. Corporate Governance: The International Journal of Business in Society, 13(3), 249–260. https://doi.org/https://doi.org/10.1108/CG-03-2011-0023
- Joo, S. J., Stoeberl, P. A., & Fitzer, K. (2009). Measuring and benchmarking the performance of coffee stores for retail operations. Benchmarking: An International Journal, 16(6), 741–753. https://doi.org/https://doi.org/10.1108/14635770911000088
- Jradi, S., Chameeva, T. B., Delhomme, B., & Jaegler, A. (2018). Tracking carbon footprint in French vineyards: A DEA performance assessment. Journal of Cleaner Production, 192, 43–54. https://doi.org/https://doi.org/10.1016/j.jclepro.2018.04.216
- Kao, C. (2009). Efficiency decomposition in network data envelopment analysis: A relational model. European Journal of Operational Research, 192(3), 949–962. https://doi.org/https://doi.org/10.1016/j.ejor.2007.10.008
- Kao, C., & Hwang, S. (2008). Efficiency decomposition in two-stage data envelopment analysis: An application to non-life insurance companies in Taiwan. European Journal of Operational Research, 185(1), 418–429. https://doi.org/https://doi.org/10.1016/j.ejor.2006.11.041
- Kaur, N., & Kaur, K. (2016). Efficiency, productivity and profitability changes in the Indian food processing industry: A firm level analysis. Pacific Business Review International, 8(12), 264–272.
- Kedžo, G., & Lukač, Z. (2020). The financial efficiency of small food and drink producers across selected European Union countries using data envelopment analysis. European Journal of Operational Research, https://doi.org/https://doi.org/10.1016/j.ejor.2020.01.066
- Klopp, G. A. (1985). The analysis of the efficiency of production system with multiple inputs and outputs [PhD dissertation]. University of Illinois, Industrial and System Engineering College.
- Lekic, N., Savic, G., & Knezevic, S. (2018). The efficiency analysis in small wineries in the Republic of Serbia. Ekonomika Poljopirvreda-Economics of Agriculture, 65(4), 1529–1544.
- Li, H., Ru, Y., Han, J., & Xu, W. (2013). What makes a difference? An evaluation and identification approach to distribution center productivity using DEA. Information Technology Journal, 12(24), 8308–8312. https://doi.org/https://doi.org/10.3923/itj.2013.8308.8312
- Nemoto, J., & Goto, M. (1999). Dynamic data envelopment analysis: Modeling intertemporal behavior of a frim in the presence of productive inefficiencies. Economics Letters, 64(1), 51–56. https://doi.org/https://doi.org/10.1016/S0165-1765(99)00070-1
- Nemoto, J., & Goto, M. (2003). Measurement of dynamic efficiency in production: An application of data envelopment analysis. Journal of Productivity Analysis, 19(2/3), 191–210. https://doi.org/https://doi.org/10.1023/A:1022805500570
- Olanrewaju, O. A., Munda, J. L., & Jimoh, A. A. (2015). Assessing possible energy potential in a food and beverage industry: Application of the IDA-ANN-DEA approach. Journal of Energy in Southern Africa, 26(1), 74–85. https://doi.org/https://doi.org/10.17159/2413-3051/2015/v26i1a2223
- Ormeci, K. M. C., Gul, M., & Karadag, G. A. (2018). Technical efficiency in grape production: A case study of Denizli, Turkey. Scientific Papers-Series Management Economic Engineering in Agriculture and Rural Development, 18(4), 211–217.
- Pantani, D., Peltzer, R., Cremonte, M., Robaina, K., Babor, T., & Pinsky, I. (2017). The marketing potential of corporate social responsibility activities: the case of the alcohol industry in Latin America and the Caribbean. Addiction, 112(1), 74–80. https://doi.org/https://doi.org/10.1111/add.13616
- Payam, M., Mohammad, B. A., & Majid, K. (2018). Coupled life cycle assessment and data envelopment analysis for mitigation of environmental impacts and enhancement of energy efficiency in grape production. Journal of Cleaner Production, 197, 937–947.
- Pu, T. C., & Bai, J. (2012). Energy consumption analysis of beer brewing process based on data envelopment analysis. Advanced Materials Research, 608–609, 1215–1219.
- Puggioni, D., & Stefanou, S. E. (2018). The value of being socially responsible: A primal-dual approach [Working paper]. Documentode Investigación, Banco de México.
- Santos, M., Marta-Costa., & Santos, C. (2018). Efficiency of wine grape growers at farm level: A case study. XII Congreso Internacional Terroir, E3S Web of Conferences, 50, 01010.
- Sellers-Rubio, R., Más-Ruiz., & Francisco, J. (2015). Economic efficiency of members of protected designations of origin: Sharing reputation indicators in the experience goods of wine and cheese. Review of Managerial Science, 9(1), 175–196. https://doi.org/https://doi.org/10.1007/s11846-014-0124-x
- Setiawan, M., Emvalomatis, G., & Lansink, A. O. (2012). The relationship between technical efficiency and industrial concentration: Evidence from the Indonesian food and beverages industry. Journal of Asian Economics, 23(4), 466–475. https://doi.org/https://doi.org/10.1016/j.asieco.2012.01.002
- Sueyoshi, T., & Sekitani, K. (2005). Returns to scale in dynamic DEA. European Journal of Operational Research, 161(2), 536–544. https://doi.org/https://doi.org/10.1016/j.ejor.2003.08.055
- Taulo, J. L., & Sebitosi, A. B. (2013). Improving energy efficiency in Malawian tea industries using an integrated multi-objective optimlzation method combining IDA, DEA and evolutionary algorithms [Paper presentation]. Industrial & Commercial Use of Energy Conference.
- Tone, K. (2001). A slacks-based measure of efficiency in data envelopment analysis. European Journal of Operational Research, 130(3), 498–509. https://doi.org/https://doi.org/10.1016/S0377-2217(99)00407-5
- Tone, K., & Tsutsui, M. (2009). Network DEA: A slacks based measurement approach. European Journal of Operational Research, 197(1), 243–252. https://doi.org/https://doi.org/10.1016/j.ejor.2008.05.027
- Tone, K., & Tsutsui, M. (2010). Dynamic DEA: A slacks-based measure approach. Omega, 38(3-4), 145–156. [Database] https://doi.org/https://doi.org/10.1016/j.omega.2009.07.003
- Tone, K., & Tsutsui, M. (2014). Dynamic DEA with network structure: A slacks-based measure approach. Omega, 42(1), 124–131. https://doi.org/https://doi.org/10.1016/j.omega.2013.04.002
- Vazquez-Rowe, I., Villanueva-Rey, P., & Iribarren, D. (2012). Joint life cycle assessment and data envelopment analysis of grape production for vinification in the Rias Baixas appellation. Journal of Cleaner Production, 27, 92–102.
- Wang, G., Li, K., & Xiao, Y. (2019). Measuring marine environmental efficiency of a cruise shipping company considering corporate social responsibility. Marine Policy, 99, 140–147. https://doi.org/https://doi.org/10.1016/j.marpol.2018.10.028
- Yoon, S., & Lam, T. (2013). The illusion of righteousness: Corporate social responsibility practices of the alcohol industry. BMC Public Health, 13(1), 630–630. https://doi.org/https://doi.org/10.1186/1471-2458-13-630