
 ?Mathematical formulae have been encoded as MathML and are displayed in this HTML version using MathJax in order to improve their display. Uncheck the box to turn MathJax off. This feature requires Javascript. Click on a formula to zoom.
Abstract
The creation of value in listed companies has been of interest to the research field and to practitioners in the investment arena for more than eighty years. It can be considered to have two aspects the first with more quantitative elements related to financial and performance aspects, and the second with more qualitative elements related to company competitiveness. The stated goal is the evaluation of the factors that influence value creation in different economic contexts and their possible changes of listed infrastructure companies with data referring to before, during and after the crisis of 2008. The fuzzy-set QCA method has been used, where the relationship between both factors, qualitative and comparative, can be reflected on an output related to value creation, represented by the Total Shareholder Return (TSR). The TSR is an appropriate indicator as it provides a broader measure, which includes the share price, and represents the overall return that the investor can achieve, that is, the amount returned to shareholders. The conclusions reached highlight the importance of qualitative and quantitative factors, as well as their combination, in creating value and that there are differences that exist before, during and after the crisis.
1. Introduction
The study of the creation of value in listed companies has an academic interest and also high interest from practitioners, since it is used to analyse the possible selection of securities when investing in listed companies. In recent years, the main objectives of corporations have shifted towards creating value and achieving satisfactory returns through greater profitability and wealth of shareholders in order to maximise returns for shareholders (Alsoboa, Citation2017).
There is a general belief in financial theory and practice that variation in share price is one of the most objective indicators of value creation or destruction for shareholders (Čupić & Todorovic, Citation2011). The research and theories proposed in the last eighty years by the different schools of thought have provided a series of criteria to evaluate the creation of value, both in periods of growth and crisis. In this context, the financial crisis of 1929 caused the business and financial community to begin to consider what factors create sustained value in the face of fads, bubbles or irrational exuberance (Lafont et al., Citation2020).
Surprisingly, Lafont et al. (Citation2020) identify that there have been only a reduced number of articles published throughout history in this specific field. We can hypothesise that this could be due to the complexity of the field as well the potential interest of researchers not to distribute knowledge in the form of published articles, since this advanced knowledge may result in direct economic benefits for trading firms.
From an academic perspective, value creation of a listed company can be explained from two main angles: one quantitative and the other qualitative. From a quantitative perspective, a review of the behavioural models of listed companies proposed in recent years reveals that there are a number of financial factors linked to value creation (Sjödin, Citation2019 cited by Lafont et al., Citation2020).
On the other hand, from a qualitative perspective, different characteristics of the company appear without direct quantification and that mainly refers to the ability of a company to maintain competitive advantages over its competitors and its market share (Zeeshan et al., Citation2019). One of the aspects that is considered to be competitive is the reduction of costs. In many cases, a considerable reduction of investments could later have a negative impact on firms’ competitiveness (Shakina & Barajas, Citation2014).
The aim of this research is to evaluate the creation of value both from a qualitative and quantitative point of view, as well as to evaluate the impact of the different factors in different economic contexts, particularised for the 2008 crisis. To analyse the goal of this research, an analysis using qualitative comparative analysis (fsQCA) of a relevant group of infrastructure-listed companies was carried out in the different economic scenarios created as a consequence of the 2008 crisis. This analysis is especially relevant for different economic contexts because the company’s performance indicators vary between periods of crisis and periods without crisis (Lee et al., Citation2017).
The next section provides a literature review of Total Shareholder Return, its impact in the creation value and the propositions for this research. In the second part, an overview of the data and methodology used in this research is presented. In the third part, we present the results the research. The paper finishes with a discussion about the results, findings, and conclusions.
2. Total shareholder return: value creation for the shareholder
The creation of value in companies is an issue in the research for more than eighty years and it has an interest also in investors’ area. Despite the interest within the academic world, value creation has not been a traditional topic, and no notable studies have appeared until the end of the 20th century and, as a consequence, there is not much literature on this subject (Lafont et al., Citation2020).
The interest generated by the creation or destruction of value may be due to the fact that it has become one of the most important aspects to evaluate the performance of a company (Hall, Citation1998 cited by Alsoboa, Citation2017). Graham et al. (Citation1934) was the first one in establishing a line of research to measure investment value creation versus speculative investments. Later, Graham (Citation1954) incorporated the concept of value in acquiring rights as a practice to look for listed companies that create value consistently over time.
Since the end of the 20th century, there has been an increase in the number of publications indicating that the causes of market behaviour have been influenced by substantial changes (Baier-Fuentes et al., Citation2019 cited by Lafont et al., Citation2020). These changes have affected the scope of financial investment due to high growth and recession unusual rates and limits. These have been in periods influenced by a great expansion and the cycles of crises where hyperinflation, deflation and real estate, energy, technology, financial and credit bubbles have had an important role (Dey et al., Citation2019 cited by Lafont et al., Citation2020).
The literature on estimating shareholder value has been approached in many ways (Alsoboa, Citation2017). We use the Total Shareholder Return (TSR) to evaluate value creation as a possible function, which considers the qualitative and quantitative factors described above. The TSR is an appropriate indicator as it provides a broader measure, which includes the share price, and represents the overall return that the investor can achieve, that is, the amount returned to shareholders. The following traditional formula will be used to calculate it (Čupić & Todorovic, Citation2011).:
where,
TSR: Total Shareholder Return
Pfinal: Final Stock Price
Pinicial: Initial Stock Price
Div: Dividend
From an academic perspective, value creation of a listed company can be explained from two main angles: one quantitative and the other qualitative. These aspects will be discussed hereafter.
2.1. Most relevant models and quantitative factors
From a quantitative perspective, a review of the behavioural models of listed companies proposed in recent years reveals that there are a number of factors linked to value creation (Sjödin, Citation2019 cited by Lafont et al., Citation2020). Studies highlight the following: the profitability of stable investments, recurring generation of cash, profitable growth (profits, margin), and low systemic dependency (low sensitivity of results and cash generation to changes in market cycles).
A model representing the quantitative variables in detail is proposed by Olsen et al. (Citation2007) and Čupić and Todorovic (Citation2011) with the following most significant factors: Increased Sales and Revenues, Free Cash Flow (FCF) yield and Variation in Earnings Before Interest, Taxes, Depreciation and Amortization (EBITDA). Revenue is an essential parameter as it is related to other measures of financial performance (Stanley, Citation2018). It can be considered that the increase in Sales and Revenues can be identified by Net Income, the increase in EBITDA by the same variation of this factor and finally, in terms of Free Cash Flow yield, they represent the FCF per share of the company. In a more generic way, we are going to consider the increase in FCF that represents the possible growth forecasts.
2.2. Relevant qualitative factors: economic moats
From a qualitative perspective, different characteristics of the company appear without direct quantification. These characteristics are linked to idea of competitiveness and the ability to create value including the development of barriers to entry, customer loyalty, the sustainability of the customer portfolio, and the application of ESG principles to manage investments (Zeeshan et al., Citation2019). The latter is in line with what Whitney and Deming (Citation1996) affirm, that corporate responsibility and excellence in environmental, social and governance (ESG) models are factors that affect value creation.
These qualitative factors that complement the quantitative factors, as mentioned above, can give us an idea of the competitiveness of a company over a long period of time and they are related to the Morningstar Economic Moats, where one of the keys to finding superior long-term investments is buying companies that can stay one step ahead of their competitors.
This line of thinking has been adopted by companies that are world leaders, run by people such as Warren Buffet, who identifies, in line with our research, quantitative and qualitative variables (moats) of companies that lead to the creation of value throughout time and a sustained increase in the price of such companies.
There are different attributes that can give companies economic moats. Sellers (Citation2003) and Morningstar (Citation2004), cited by Boyd and Quinn (Citation2006) and Manditch (Citation2018), proposes the following main attributes:
Network Effect/Advantage. The Network Effect occurs when the value of a company’s service increases for both new and current users, the more the service is used.
Brand/Intangible Asset ESG. They refer to intangible assets such as patents, trademarks, licenses and other intangible assets that can prevent competitors from copying the products of a company or allowing them to charge a significant price premium. An aspect that is considered relevant from the point of view of the intangible asset is the environmental, social and governance (ESG) aspects, since there is a relationship between the sustainable performance of companies and the financial results of the investments made by socially responsible funds (Stankevičienė & Čepulytė, Citation2014).
Cost Advantage. Companies with a structural cost advantage can have a lower price than the one of competitors and obtain similar or higher margins.
Barriers/Switch cost. When it is too costly or problematic to stop using a company’s products, the supplier may be able to set prices.
Efficient Scale. There may be an efficient scale when a niche market is effectively served by one or a small handful of companies.
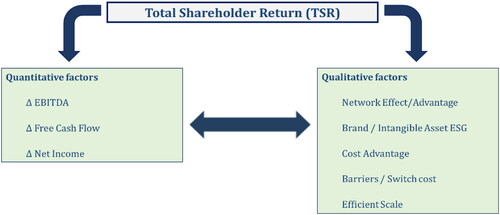
In summary, it can be said that we are going to use a model based on quantitative factors (EBITDA, FCF and Net Income) and on qualitative factors (Economic Moats) to verify their behaviour and impact on TSR. represents the proposed model.
Figure 1. Total shareholder return model (own source).
2.3. Propositions development
To verify the goal mentioned above in the previous section and evaluate the impact on shareholder value in different economic contexts, particularized for the 2008 crisis, the following propositions are posed:
Proposition 1 (P1): The effect of the 2008 crisis caused a variation in the impact of the quantitative factors (EBITDA, Free Cash Flow and Net Income) in the creation of shareholder value.
Proposition 2 (P2): The effect of the 2008 crisis caused a change in the weight of the some of qualitative factors (Cost Advantage, Barriers/Switch cost, Brand/Intangible Asset ESG and Network Advantage) in the creation of shareholder value.
Proposition 3 (P3): Some companies’ financial conditions (EBITDA, Free Cash Flow and Net Income) and some qualitative factors (Cost Advantage, Barriers/Switch cost, Brand/Intangible Asset ESG and Network Advantage) influence jointly in the creation of shareholder value.
To analyse the main goal of this research and to verify the propositions, an analysis using qualitative comparative analysis (fsQCA) of a relevant group of infrastructure-listed companies was carried out before, during and after the 2008 crisis based on the model proposed above.
3. Data and method
The goal of this study is to study the effect of different economic contexts in shareholder return and creation of value in listed companies of the infrastructure sector and in the differences in the quantitative and qualitative factors that influence Total Shareholder Return (TSR). To evaluate this effect, a sample of 37 Infrastructure-listed Companies has been selected according to their relevance to be analysed with fsQCA (Drass & Ragin, Citation1992). This qualitative comparative analysis allows evaluation of the impact of the conditions and their combinations in an outcome. The sources of the data are Bloomberg, Datastream and Morningstar and the data used correspond to the 2008 crisis (before, during and after).
The analysis starts with the dataset preparation and it is based on the definition, the outcome and the conditions. The outcome will be Total Shareholder Value (TSR), that is the total amount returned to investors. It shows the long-term value, the most accurate metric for gauging success that was created by the company, so it can be considered as a level of a good company’s performance. Before calibrating, outcome TSR is calculated as percentage variation from the previous year and the average value is calculated in each period: before the crisis, during the crisis and after the crisis. Then TSR is calibrated as a Fuzzy value, with values from 0 to 1.
To define the conditions that influence in the success of the outcome, we take into account the model presented in . So we will have two types of conditions: one quantitative and the other qualitative. In the case of quantitative conditions, the factors will be EBITDA, Free Cash Flow, and Net Income. As the outcome TSR, the quantitative conditions are calculated as percentage variation from the previous year and the average value is calculated in each period: before the crisis, during the crisis and after the crisis. Then these conditions are calibrated as a Fuzzy value, with values from 0 to 1.
In relation to the qualitative Cost Advantage, Barriers/Switch cost, Brand/Intangible Asset ESG, and Network Advantage. We do not consider the Moat “Efficient Scale” because there is no point in applying it in the infrastructure sector as there are many companies working in it. These conditions are calibrated as a Crisp value, with values 0 and 1, based on the information from Morningstar. shows the outcome and the conditions selected, and the codification used: Fuzzy or Crisp value.
Table 1. Outcome and conditions: description and codification (own source and Ragin Citation2008).
At the end, the result is a fine calibration of the membership of the dataset, with values from 0 to 1. There are different ways, suggested by Ragin (Citation2008), to calibrate the conditions and the outcome. It is recommended to use at least three values that identify the different thresholds. So the calibrations of quantitative conditions (VKA1, VKA2 and VKA3) have been performed for the 30th, 60th and 90th percentile cut-off, in line with other previous studies (Fiss, Citation2011; García-Castro et al., Citation2013). The dataset has been divided into three groups and the value of the corresponding variable has been calculated for which there are 30%, 60% and 90% of the data, respectively. Once the groups have been established, the calibration is carried out. The first group includes data whose variable is less than that obtained for 30% and would correspond to Full non-membership (0.3). The second group includes the data whose variable is between those obtained between 30% and 60%, which would correspond to the Crossover point (0.6). The third and last group is made up of those whose variable is greater than that obtained for 60% and would correspond to Full membership (0.9).
The values of the membership of the outcome (TSR) and quantitative conditions (VKA1, VKA2 and VKA3) are presented in and have been performed for the case of before of crisis and then have been maintained in order to compare the results.
Table 2. Calibration of the outcome and conditions (own source and Ragin Citation2008).
As mention above, VQ1, VQ2, VQ3 and VQ4, qualitative variables, use Crisp set values (0 and 1).
Once the variables have been calibrated, the next step is to perform an analysis of necessary conditions that is based on evaluating the participation of the conditions when the result participates. Finally, the sufficient conditions analysis is carried out. This analysis allows the study of the combined and causally connected conditions as pathways that result in the presence or absence of a result.
The sufficient conditions analysis begins with the construction of the truth table. Fuzzy set scores are used to construct a data matrix like a truth table with 2k rows to operate Boolean algebra (Ragin, Citation2008). Subsequently, the possible combinations are minimized through the Quine–McCluskey algorithm and the possible combinations obtained (Chang & Cheng, Citation2014; Ragin, Citation2008, Citation2009). The results obtained are three types of solutions: complex, intermediate and parsimonious.
To perform the analysis in different economic contexts, three datasets related to the crisis of 2008 have been taken in account: one before the crisis (years from 2003 to 2007), during the crisis (years from 2008 to 2012), and another that corresponds to after the crisis (years from 2013 to 2019). The object is to compare the results and verify the influence and relationship of the quantitative (VAK1, VAK2 and VAK3) and qualitative conditions (VQ1, VQ2, VQ3, VQ4) in the outcome TSR in every period.
4. Value creation in listed infrastructure companies
As mentioned above, fsQCA allows the causal configurations to be obtained that proceed to the success or to the absence of the success of the outcome (Drass & Ragin, Citation1992). In this case, the outcome is related to the creation value of the company represented by TSR – Total Shareholder Return and the conditions are the following: VAK1-EBITDA, VAK2-Free Cash Flow, VAK3 – Net Income, VQ1 – Cost Advantage, VQ2 – Barriers/Switch cost, VQ3 – Brand/Intangible Asset ESG, and VQ4 – Network Advantage. Following this is the model used for the analysis based on the information about outcome and conditions presented in section 3:
Model: TSR = f(VAK1, VAK2, VAK3, VQ1, VQ2, VQ3, VQ4)
As mentioned in the previous section, the analysis has two parts that are applied to both datasets. The first part is related to the Analysis of the Necessary Conditions and the second one to the Study of Sufficient Conditions. Following this, both analyses will be commented on.
4.1. Analysis of necessary conditions
The fsQCA analysis starts with the evaluations of the necessary conditions. This study is based on the evaluation of the participation (presence) of the conditions when the outcome participates (presence). The rule of this necessary condition is based on the consistency being higher or equal to 0.9 (Tóth et al., Citation2015).
shows the results for before the crisis (years from 2003 to 2007), during the crisis (years from 2008 to 2012), and after the crisis (years from 2013 to 2019). The conditions VAK1 – EBITDA, VAK2 – Free Cash Flow and VAK3 – Net Income after crisis have the consistency equal to or higher than 0.9. It means that they are necessary conditions, that is, when the value of TSR is high, these three conditions are presented, which are of quantitative origin. Besides consistency for VAK1 – EBITDA (before crisis) and VQ1 – Cost Advantage (before, during and after crisis) has a consistency value near to 0.9 could be considered as relevant conditions from the point of necessary analysis.
Table 3. Analysis of necessary conditions (own source and Ragin Citation2008).
4.2. Analysis of sufficient conditions
Once Necessary Conditions are analysed, it proceeds to analyse the sufficient conditions. In this case, three analyses have been performed: before the crisis (years from 2003 to 2007), during the crisis (years from 2008 to 2012), and after the crisis (years from 2013 to 2019).
For the analysis corresponding to before the crisis, a frequency threshold of 1 was adopted for success and 29 cases were included in the analysis of conditions leading to the presence of TSR, and a consistency cutoff of 0.83 for presence of TSR was used. In relation to the analysis corresponding to during the crisis, a frequency threshold of 1 was adopted for success and 33 cases were included in the analysis of conditions leading to the presence of TSR, and a consistency cutoff of 0.83 for presence of TSR was used. Finally, in the analysis corresponding to after the crisis, a frequency threshold of 1 was adopted for success and 7 cases were included in the analysis of conditions leading to the presence of TSR, and a consistency cutoff of 0.83 for presence of TSR was used.
As mentioned above, fsQCA is a method that allows the study of the conditions that are combined and causally connected as paths that result in the presence or absence of a result. In this case, for the selected companies, the TSR is considered as the outcome so that a high value indicates presence and a low value indicates absence.
With this method, three types of solutions are obtained (complex, intermediate and parsimonious) which are comparable. present the results of the intermediate and parsimonious solution, according to the notation proposed by Fiss (Citation2011) for the analysis of before, during and after the crisis.
Table 4. Analysis of sufficient conditions – Before the Crisis (Presence of TSR) (own source and Fiss Citation2011).
Table 5. Analysis of sufficient conditions – During the Crisis (Presence of TSR) (own source and Fiss Citation2011).
Table 6. Analysis of sufficient conditions – After the Crisis (Presence of TSR) (own source and Fiss Citation2011).
According to the notation of Fiss (Citation2011) mentioned above, the conditions are identified as follows. Black circles indicate their presence and white ones indicate absence. When the circles are large, they indicate a core condition, that is, it appears in both the intermediate solution and the parsimonious one. If they are small circles, both black and white, this represents that it only appears in the intermediate solution. In this case, they are called peripheral conditions. Moreover, if there are blank spaces, it is an absent condition and is irrelevant.
As mentioned above, shows the solutions for Before the crisis. According to Schneider et al. (Citation2010), only models with a consistency greater than 0.75 are acceptable. Consistency indicates the level at which data subsets are present in the outcome. This value is considered sufficient although there are other authors such as Ragin (Citation2008) and Eng and Woodside (Citation2012) who propose that it must be greater than 0.8. All proposed models meet the condition of having a consistency greater than 0.75 so all configurations can be considered valid for the high TSR.
Other important parameters are Solution Coverage, Raw Coverage and Unique Coverage. Solution Coverage indicates the level of explanation of the solution. The value is 0.83, high for the model.
Raw coverage measures the level of explanation of the result in each configuration. In general, the values are from 0.03 to 0.34, acceptable for the model. Finally, Unique Coverage measures the proportion of cases that are members of the result and that only belong to that configuration. This parameter has lower values than the others and in this case, they go from 0.02 to 0.12.
In order to consider that the analysis of sufficient conditions is valid, you should have a consistency cutoff greater than 0.75 (Rihoux & Ragin, Citation2009). In this case, it can be seen that all comply.
All eleven configurations may be accepted according to the criteria proposed by Ragin (Citation2009) and Eng and Woodside (Citation2012).
In , the following is highlighted. The importance of VAK1 – EBITDA,VKA3 – Net Income) and VQ4 – Network Advantage is observed in the two configurations with more weight, 1 to 2 and VAK2 – Free Cash Flow don´t care. VQ4 condition – Network Advantage has a relevant role because it is a core condition and ispresent in almost all configurations, in 9 of the 11 combinations. Also having a relevantrole, but not as much as the previous one, is the condition VAK1 – EBITDAthat appears in 6 of the 11 configurations.
As mentioned above, shows the solutions for During the crisis. According to Schneider et al. (Citation2010), only models with a consistency greater than 0.75 are acceptable. Consistency indicates the level at which data subsets are present in the outcome. This value is considered sufficient although there are other authors, such as Ragin (Citation2008) and Eng and Woodside (Citation2012), who propose that it must be greater than 0.8. All proposed models meet the condition of having a consistency greater than 0.75 so all configurations can be considered valid, for the high TSR.
Other important parameters are Solution Coverage, Raw Coverage and Unique Coverage. Solution Coverage indicates the level of explanation of the solution. The value is 0.80, high for the model.
Raw coverage measures the level of explanation of the result in each configuration. In general, the values are from 0.02 to 0.36, acceptable for the model. Finally, Unique Coverage measures the proportion of cases that are members of the result and that only belong to that configuration. This parameter has lower values than the others and in this case, they go from 0.01 to 0.08.
The analysis of sufficient conditions is valid; you should have a consistency cutoff greater than 0.75 (Rihoux & Ragin, Citation2009). In this case it can be seen that all comply.
All twelve configurations may be accepted according to the criteria proposed by Ragin (Citation2009) and Eng and Woodside (Citation2012).
On the other hand, in , it highlights the importance of the conditions VAK2 – Free Cash Flow, VQ2 – Barriers/Switch cost and VQ4 – Network Advantage. In the configuration 2, with more weight, VQ4 – Network Advantage is a relevant because it is present as core condition. Besides this condition is present in almost all configurations, in 10 configurations of the 12. In the case of configuration 3, second the most relevant, VAK2 – Free Cash Flow and VAK3 – Net Income are important because they are core conditions. Moreover the VAK2 – Free Cash Flow appears in 6 configurations of the 12. In relation with and VQ2 (Barriers/Switch cost) appear as peripheral condition in both configurations, 2 and 3. Besides it appear in 7 configurations of the 12 respectively.
As mentioned above, shows the solutions for After the crisis. According to Schneider et al. (Citation2010), only models with a consistency greater than 0.75 are acceptable. Consistency indicates the level at which data subsets are present in the outcome. This value is considered sufficient, although there are other authors, such as Ragin (Citation2008) and Eng and Woodside (Citation2012), who propose that it must be greater than 0.8. Most of the proposed configurations, four of five, meet the condition of having a consistency greater than 0.75. Only configuration 3 has a consistency of 0.73, which is very near to 0.75. It can be considered that all configurations are valid for the high TSR.
Other important parameters are Solution Coverage, Raw Coverage and Unique Coverage. Solution Coverage indicates the level of explanation of the solution. The value of Solution Coverage is 0.52. As can be observed, this value is lower than in the other two cases corresponding to before and during the crisis. This is due to the decrease in the number of companies that contribute with their membership to the creation of value that is identified by the TSR outcome. It must be taken into account that the calibration has been carried out for the pre-crisis data and has been maintained in the other two cases to be able to compare the results and see the possible evolution. In this case, it can be seen how it has varied, having decreased the intention to create value for the shareholder.
Raw coverage measures the level of explanation of the result in each configuration. In general, the values are from 0.04 to 0.19, acceptable for the model. Finally, Unique Coverage measures the proportion of cases that are members of the result and that only belong to that configuration. This parameter usually has lower values than the others but in this case has very similar values and they go from 0.02 to 0.17.
In order to consider that the analysis of sufficient conditions is valid, you should have a consistency cutoff greater than 0.75 (Rihoux & Ragin, Citation2009). In this case, it can be seen that all comply. All five configurations may be accepted according to the criteria proposed by Ragin (Citation2009) and Eng and Woodside (Citation2012).
On the other hand, in , it highlights. the importance role of the conditions VAK2 – Free Cash Flow and VQ4 - Network Advantage. In the heaviest configuration, the first, VAK1 – EBITDA and VAK2 – Free Cash Flow are core conditions. In the case of configuration 3, the second most relevant, no conditions highlight. In both configurations VQ4 - Network Advantage is present as peripheral condition. On the other hand, VAK2 – Free Cash Flow is also relevant because is present in 3 of the 4 configurations, most of the cases as core condition. The condition VQ4 – Network Advantage has a relevant role too as it is present in almost all configurations. It appears in all 5 configurations. most of the cases as peripheral condition.
As a summary, it can be said that the most relevant conditions in the TSR – Total Shareholder Return in the period corresponding to Before the crisis are VAK1- EBITDA, VKA3 – Net Income and VQ4 – Network Advantage. Regarding the results obtained in the case of During the crisis, VAK2 – Free Cash Flow, VQ2 – Barriers/Switch cost and VQ4 – Network Advantage stand out in particular. Finally, After the crisis, the conditions that stand out principally are VAK2 – Free Cash Flow and VQ4 – Network Advantage.
5. Conclusions
The aim of this research is to evaluate the creation of value for shareholders both from a qualitative and quantitative point of view, as well as to evaluate the impact of the different factors of different economic contexts. To carry out a qualitative comparative analysis, a Fuzzy analysis was carried out applied to a selection of publicly-listed companies in the infrastructure sector in the context of the 2008 crisis.
To carry out his research, we have developed a model based on the Literature Review where two types of factors – qualitative and quantitative – have been selected taking account their influence in the creation of shareholder value. The quantitative conditions are based on EBITDA, Free Cash Flow and Net Income. Regarding the qualitative conditions, Morningstar Moats have been chosen, which aim to assess the competitiveness of the company in the long term. Those considered are: Cost Advantage, Barriers/Switch cost, Brand/Intangible Asset ESG and Network Advantage. The Efficient Scale factor has not been used since it is not applicable to a sector such as infrastructure. Finally Total Shareholder Return (TSR) has been selected as the outcome to evaluate value creation because it represents the overall return that the investor can achieve.
Once the model was defined, three Fuzzy analyses were carried out: before the crisis (years from 2003 to 2007), during the crisis (years from 2008 to 2012), and after the crisis (years from 2013 to 2019). In the analysis, it has been found that there is a variation of the quantitative variables that are relevant, depending of the moment in time. Before the crisis, variation of EBITDA and Net Income, oriented to generate profitability and income, were relevant. During the crisis and After the crisis, the influence of Free Cash Flow variation, oriented to liquidity, is the most important. As a consequence, it is observed that there is an impact on the financial factors that change as the different phases of the crisis pass. Once the crisis is over, they focused mainly on the variation of Free Cash Flow (Lee et al., Citation2017), anticipating that behaviour During the crisis period is to be prepared and oriented to have liquidity. On the other hand, After the crisis, there is a high value of TSR if conditions VAK1, VAK2 and VKA3 are present. This is relevant because it indicates the importance of these financial conditions for the creation of value. It does not happen before or during the crisis. These results confirm proposition P1 in the sense that the financial conditions change, which influence the creation of value.
Regarding the qualitative factors, the relevance of the Network Advantage has been maintained while During the crisis the Barriers/Switch cost factor appears as significant too, giving an idea that the change of a provider is complicated During the crisis due to the cost it can carry. In relation with Brand/Intangible Asset ESG, the importance Before and After the crisis is verified, as a peripheral condition present in the most important configurations, losing some relevance During the crisis, that is, there is a role change in this parameter (Shakina & Barajas, Citation2014). These results confirm the proposition P2 in the sense that a new qualitative factor appears during the crisis that is not relevant Before and After the crisis.
In relation to joint action of quantitative conditions and quantitative factors, it can be seen that some of them can act together and impact value creation. This is the case, for example, for EBITDA, Net Income and Network Advantage Before the crisis, During the crisis for Free Cash Flow with VQ2 (Barriers/Switch cost) and VQ4 (Network Advantage), and for Free Cash Flow and Network Advantage After the crisis. It does not mean that there cannot be other conditions that can have influence and these represent examples of joint action. These results confirm proposition P3 that financial conditions and qualitative factors can jointly influence value creation.
As a conclusion, we can say that Before the crisis the companies were oriented to generate more profitability and income, which can have a better impact in the creation of value for the shareholder. In this period, the Network Advantage, related to the level of service to users, is relevant. During the crisis, the Barriers/Switch cost appears as relevant due to the cost that a change of provider can eventually have, the Network Advantage is maintained as relevant, too. From a financial point of view, there is a need for liquidity reflected in the importance of Free Cash Flow that will remain After the crisis. Once the crisis is over, the Barriers/Switch cost loses importance and the Network Advantage remains as the only relevant qualitative condition as it happened Before the crisis.
The initial goal of this study has been verified since a model has been defined to evaluate the creation of value and analyse the impact in different economic contexts of the different factors, both qualitative and quantitative, having been able to observe a greater effect in some than others. In this context, it is considered that research can contribute to the state of knowledge and be of interest to researchers and managers of infrastructure companies or potential investors in the stock markets.
This research has the limitation that it has been applied to the infrastructure sector and more specifically to listed companies. As future research, a study about another group of listed companies from another sector(s) is proposed, where the Efficient Scale factor is applicable, and in the near future to apply this study to see how the crisis has impacted due to Covid-19.
Disclosure statement
No potential conflict of interest was reported by the authors.
References
- Alsoboa, S. S. (2017). The influence of economic value added and return on assets on created shareholders value: A comparative study in Jordanian public industrial firms. International Journal of Economics and Finance, 9(4), 63–78. https://doi.org/https://doi.org/10.5539/ijef.v9n4p63
- Baier-Fuentes, H., Merigó, J. M., Amorós, J. E., & Gaviria-Marín, M. (2019). International entrepreneurship: A bibliometric overview. International Entrepreneurship and Management Journal, 15(2), 385–429. https://doi.org/https://doi.org/10.1007/s11365-017-0487-y
- Boyd, D. P., & Quinn, R. C. (2006). Financial metrics in wide-moat firms. Journal of Business & Economics Research, 4(6). https://doi.org/https://doi.org/10.19030/jber.v4i6.2676
- Chang, M. L., & Cheng, C. F. (2014). How balance theory explains high-tech professionals’ solutions of enhancing job satisfaction. Journal of Business Research, 67(9), 2008–2018.
- Čupić, M., & Todorovic, M. (2011). Total shareholder return – Decomposition, internal equivalent and alternatives. Problems of Competitiveness of Contemporary Economies, 379–392.
- Dey, B. L., Babu, M. M., Rahman, M., Dora, M., & Mishra, N. (2019). Technology upgrading through co-creation of value in developing societies: Analysis of the mobile telephone industry in Bangladesh. Technological Forecasting and Social Change, 145, 413–425. https://doi.org/https://doi.org/10.1016/j.techfore.2018.05.011
- Drass, K., & Ragin, C. C. (1992). Qualitative comparative analysis 3.0. Institute for Policy Research, Northwestern University.
- Eng, S., & Woodside, A. G. (2012). Configural analysis of the drinking man: Fuzzy-set qualitative comparative analyses. Addictive Behaviors, 37(4), 541–543. https://doi.org/https://doi.org/10.1016/j.addbeh.2011.11.034
- Fiss, P. C. (2011). Building better causal theories: A fuzzy set approach to typologies in organization research. Academy of Management Journal, 54(2), 393–420. https://doi.org/https://doi.org/10.5465/amj.2011.60263120
- García-Castro, R., Aguilera, R. V., & Ariño, M. A. (2013). Bundles of firm corporate governance practices: A fuzzy set analysis. Corporate Governance: An International Review, 21(4), 390–407.
- Graham, B., Dodd, D. L. F., & Cottle, S. (1934). Security analysis. McGraw Hill.
- Graham, B. (1954). The intelligent investor. Harper & Row.
- Hall, J. H. (1998). The agency problem, agency cost and proposed solutions there to: A South African perspective. Meditari Accountancy Research, 6 (2), 144– 161.
- Lafont, J., Ruiz, F., Gil-Gómez, H., & Oltra-Badenes, R. (2020). Value creation in listed companies: A bibliometric approach. Journal of Business Research, 115, 428–434. https://doi.org/https://doi.org/10.1016/j.jbusres.2020.01.012
- Lee, C. C., Chen, M. P., & Ning, S. L. (2017). Why did some firms perform better in the global financial crisis? Economic research-Ekonomska Istraživanja, 30(1), 1339–1366. https://doi.org/https://doi.org/10.1080/1331677X.2017.1355258
- Manditch, E. (2018). Can economic moats provide investors with a competitive advantage? Economics Student Theses and Capstone Projects, 95. https://creativematter.skidmore.edu/econ_studt_schol/95
- Morningstar (2004). StockInvestor reader’s guide. Morningstar, Inc.
- Olsen, E., Plaschke, F., Stelter, D. (2007). Avoiding the cash trap. The 2007 BCG Value Creators Report. Retrieved 01.06.2010, from http://www.bcg.com/documents/file15099.pdf
- Ragin, C. (2008). Redesigning social inquiry: Fuzzy sets and beyond. University of Chicago Press.
- Ragin, C. C. (2009). Qualitative comparative analysis using fuzzy sets (fsQCA). Configurational Comparative Methods: Qualitative Comparative Analysis (QCA) and Related Techniques, 51, 87–121.
- Rihoux, B., & Ragin, C. C. (2009). Configurational comparative methods. Sage.
- Shakina, E., & Barajas, A. (2014). The dynamics of intellectual resources during the economic crisis. Economic research-Ekonomska Istraživanja, 27(1), 861–881. https://doi.org/https://doi.org/10.1080/1331677X.2014.974918
- Sellers, M. A. (2003). The four principles of profitable investing. Morningstar, Inc.
- Schneider, M. R., Schulze-Bentrop, C., & Paunescu, M. (2010). Mapping the institutional capital of high-tech firms: A fuzzy-set analysis of capitalist variety and export performance. Journal of International Business Studies, 41(2), 246–266. https://doi.org/https://doi.org/10.1057/jibs.2009.36
- Sjödin, D. (2019). Knowledge processing and ecosystem co-creation for process innovation: Managing joint knowledge processing in process innovation projects. International Entrepreneurship and Management Journal, 15(1), 135–162. https://doi.org/https://doi.org/10.1007/s11365-018-0550-3
- Stankevičienė, J., & Čepulytė, J. (2014). Sustainable value creation: Coherence of corporate social responsibility and performance of socially responsible investment funds. Economic Research-Ekonomska Istraživanja, 27(1), 882–898. https://doi.org/https://doi.org/10.1080/1331677X.2014.976058
- Stanley, D. J. (2018). Measures of a firm’s financial performance and long-term shareholder value. In Competition forum (Vol. 16, No. 1, pp. 32–37). American Society for Competitiveness.
- Whitney, J. O., & Deming, W. E. (1996). The economics of trust: Liberating profits and restoring corporate vitality. McGraw-Hill.
- Tóth, Z., Thiesbrummel, C., Henneberg, S. C., & Naudé, P. (2015). Understanding configurations of relational attractiveness of the customer firm using fuzzy set QCA. Journal of Business Research, 68(3), 723–734. https://doi.org/https://doi.org/10.1016/j.jbusres.2014.07.010
- Zeeshan, M., Rashid, Y., Ayub, U., & Waseem, A. (2019). Quantifying value co-creation: Examining the relationship between realized value facets and customer experience in a B2B context. International Journal of Services Operations and Informatics, 10(1), 43–64. https://doi.org/https://doi.org/10.1504/IJSOI.2019.100616