
 ?Mathematical formulae have been encoded as MathML and are displayed in this HTML version using MathJax in order to improve their display. Uncheck the box to turn MathJax off. This feature requires Javascript. Click on a formula to zoom.
Abstract
This study examines the short- and long-run of the causal correlation between economic growth (G.R.) and renewable electricity generation sources for a panel of 25 developing nations over the period 1990–2017. To do so, second-generation cross-sectional dependence (C.D.) test Im, K.S., Pesaran and Augmented Dickey-Fuller panel unit root test, panel cointegration, autoregressive distributed lag in view of the pooled mean group estimation and panel heterogeneous Dumitrescu Hurlin (2012) causality methods are utilised. The main findings indicate that the positive and significant impact of renewable electricity generation on G.R. shows that renewable electricity generation sources stimulate G.R. in the long run for these selected countries. It is also demonstrated that there is bidirectional causality between renewable electricity generation and G.R. both in the short run and long run. Based on our findings, the feedback hypothesis is valid for developing countries.
JEL CODES:
1. Introduction
Energy is the basic building chunk to all sectors of modern economic growth (G.R.) and is considered an essential source for all kinds of production activities, i.e., more energy is expended to running machines, vehicles, to manufacturing goods (Zafar et al., Citation2019). However, energy underpins all of the social and economic activities in our daily life. In the twenty-first century, developing countries face energy challenges, i.e., a huge populace has no access to electricity, especially in rural parts. The energy demand is growing in these countries due to an increase in population growth and the implementation of economic activities. To satisfy the needs of the individuals who still have a shortage of access to essential electricity facilities demands urgent attention. It is a fact that the global demand for electricity is projected to double by 2050 (Acaravci & Ozturk, Citation2010a). Considering the above, the questions now become arise how we can meet the global growing electricity demand? How we can generate electricity by clean, effective and sustainable energy sources to meet this growing demand. What will be the significant results of economic, political and environmental factors in order to increase this reliable electricity supply?
Non-renewable energy (N.R.E.) is considered for the development of G.R. but with prompt exhaustion of these energy sources for power generation and growing energy demand, globally, the primary usage of energy increased by 1.8% during 2012 (British Petroleum, Citation2014). Whereas, a rapid climate change and global warming originated by greenhouse gas emissions have been seen as an emerging issue of the modern world due to the combustion of fossil fuels (Yahya & Rafiq, Citation2019), (Destek & Sinha, Citation2020). As a result, several issues arise, i.e., resource depletion, local energy supply and energy security issues that lead to foreign energy dependency (Saad & Taleb, Citation2018), (Kahia et al., Citation2017). To tackle these issues for future energy supply, sustainable G.R. and for better environmental quality, many countries have turned towards alternative energy sources such as renewable energy (R.E.).
The great attention on R.E. due to its huge potential to stimulate a number of factors, i.e., reduce the dependency on the foreign energy sources, the consequences of environmental quality, improve energy security, huge potential to meet the growing power demand (Apergis & Payne, Citation2010a) Moreover, it has more prospects to require electricity in rural regions to eliminate the deprivation and reduction of traditional fuels. Therefore, the development of R.E. generation is very important for these selected countries. The goal of the analysis is to scrutinise short run and long run estimation and causal correlation between R.E. and G.R. in a multivariate context. We compare short-run and long-run coefficients along with the trend of causality and derive policy implications according to our outcomes of this article.
The rest of the article is structured as fellows. Section 2 ‘Renewable Energy’ illuminates the potential of R.E. sources in power generation and its implementations. Section 3, ‘Literature Review’, studies the evidence from prior reviews. ‘Data, Methodology and Empirical Results’ are discussed in Sections 4 and 5. Section 6 concludes and draws policy implications.
2. Renewable energy
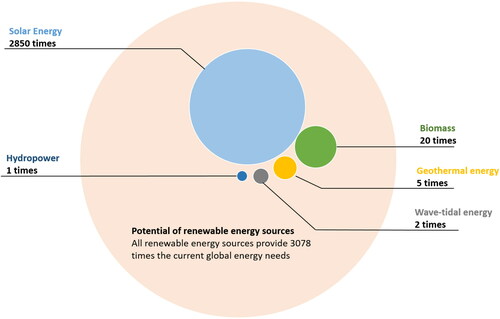
R.E. sources provide around 15–20% of energy over the world. These sources are clean, natural, domestics inexhaustible sources, require more capital-intensive and have massive potential for electricity generation relative to fossil fuel energy (International Energy Agency [IEA], 2015). illustrates the potential of R.E. gained over 3000× of the current worldwide energy needs. R.E. can be used for electricity generation again and again and is directly derived from the sun (i.e., thermal, photo-chemical and photo-electric), indirectly from the sun such as (hydropower, wind, geothermal, tidal power, and photosynthetic energy stored in biomass).
Figure 1. Clean energy sources around the globe (RE-thinking, 2010).
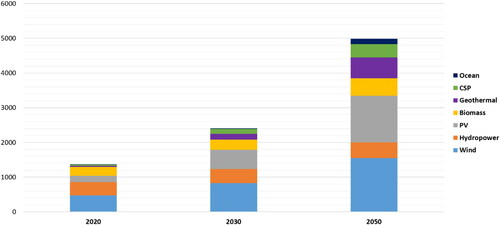
Over the few decades, the markets of electricity generation from R.E., cooling and heating are rapidly rising. The establishment of R.E. technologies rapidly increased, opened up new opportunities and also shrink the cost. Globally, almost 330 gigawatt (G.W.) of power production capacity needs to be invested in meeting future demand, which shows 42% of the current capacity (EWEA, Citation2011a). illustrates the installed capacity of renewable electricity. In 2020, the share of renewable is at least 20%, but for growing electricity demand, it is expected to increase 34% to meet the demand. The world’s R.E. source's contribution to electricity consumption (E.L.C.) is presented in .
Figure 2. RE installed capacity around the world (RE-thinking, 2010).
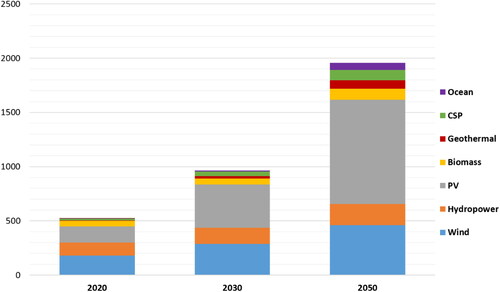
Figure 3. Contribution of renewable electricity technologies to electricity consumption (TWh) (RE-thinking, 2010).
2.1. Renewable energy sources power generation
According to the renewable global status report (REN21), the annual percentage of different R.E. sources for electricity generation comes from hydropower 15.8%, wind 5.5%, solar 2.4%, biomass 2.2%, among others (waste, tidal) 0.4%, respectively (Outlook, 2010). The description of R.E. sources with their power generation ability is discussed in the following section.
2.2.1. Solar
Solar energy has a huge potential to generate electricity and requires safe, clean and consistent power (Mohsenipour et al., Citation2020). Solar energy comes into two forms for electricity generation, such as solar thermal system or solar photovoltaic (P.V.) and concentrating solar energy system (C.S.P.). The use of P.V. cells converts sunlight directly into electricity without vibration, emission or noise, while on the other hand, solar thermal C.S.P. collect and concentrate sunlight to generate heat into the high temperature for electricity generation. The worldwide installed capacity of solar P.V. increased by 55% in the last five years (Jaber, 2012). This technology reduces the CO2 and it needs more space for a small amount of power production (Hu et al., Citation2018; Topcu & Ulengin, Citation2004).
2.1.2. Biomass
The source of this type of energy, as any organic, decomposable matter, stems from plants or animals. The cost of biomass energy is rational for electricity generation, increase energy security, promote rural economies as well as it leads to mitigate carbon emission (Angelis-Dimakis et al., Citation2011). It is expected that the production of biomass reaches 3000 terawatt-hours (T.W.h.) by 2050 (IEA, Citation2012). The huge potential of biomass power generation in developing countries is found because these are agricultural countries and 68% of the population live in rural areas, directly or indirectly belong to agriculture or related agricultural professions (Perrin et al., Citation2017).
2.1.3. Wind
Globally, wind energy has enlarged the potential of power. The speed of wind energy is at (10m–30m) above ground of 18 kmph–22 kmph is mandatory for electricity generation, annually (Azam et al., Citation2016). Wind power production has reached 282 G.W. with an average growth rate of 25% from onshore wind installation over the last years worldwide. As reported by the Global Wind Energy Council (G.W.E.C.), overall wind capacity doubles every three years and it reaches 900 G.W. in 2020 (EWEA, Citation2011b). G.W.E.C. stated that the reliable exploitation of economically sustainable and effective wind resources could easily gain the world’s E.L.C. of 1/5th by seven times over. The cost of wind energy has been reduced due to rival with traditional technologies for power generation (Guo et al., Citation2020; Pekez et al., Citation2016; Savino et al., Citation2017).
2.1.4. Tidal
Tidal or wave source converts the energy into electricity or supplementary power utilisation practices. It is required grids stability in addition to its backing to intermittent R.E. (Destouni & Frank, Citation2010)
2.1.5. Geothermal
Geothermal is clean and sustainable energy to generate electricity. For power production in domestic and heating, the resource of geothermal range as natural steam and hot water (Angelis-Dimakis et al., Citation2011). Geothermal energy has low-temperature which can be easily utilised for electricity generation.
2.1.6. Hydropower
Hydropower is the most important source that is derived from the energy source of moving water for power generation. As renewables global status (Jaber, 2012) reported that 87% of the electricity is produced from hydropower sources of R.E.. Hydropower is a clean, environment-friendly energy source as well as requires grids stability also, and it supports intermittent R.E. (Destouni & Frank, Citation2010). After the explanation of R.E.S. in power generation, yet each source has some advantages and disadvantages, as shown in .
Table 1. Pros and cons of different R.E. sources.
2.2. Development of renewable energy future scenarios and policies
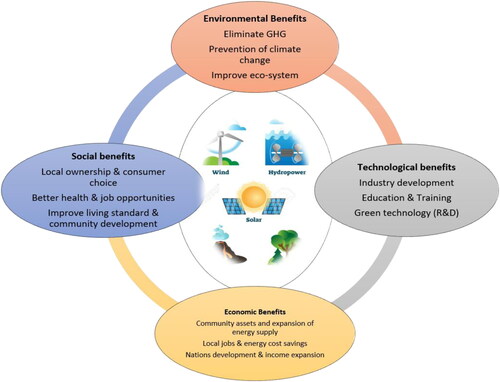
As reported by International Energy Agency (I.E.A.), the annual demand for R.E. is expected to increase by 7.3%, with a growth rate of 1.5% during 2007–2030 globally. As a result, if no steps are taken by the government interventions, then import dependency of most countries would increase (IEA, Citation2009). Given the importance of R.E., it is crucial to know their economic, social and environmental benefits as presented in .
Figure 4. Renewable electricity generation global benefits (Ellabban et al., Citation2014).
In imminent, it is expected to surge the portion of R.E. by 35% of an estimated worldwide primary energy supply of 170,000 T.W.h., whereas global electricity production of 45,000 T.w.h. at the growth rate of 50% would increase (Destouni & Frank, Citation2010). The world’s electricity generation from R.E. will ensure 100% by 2050 (Pekez et al., Citation2016). This long-term plan reduced the dependence on natural gas, coal and increased the R.E. sector. Moreover, the government should introduce R.E. policies in order to fulfill a number of aspects such as easing of electricity access especially in rural areas, creation of health benefits, require environmental befits, development of energy security by expanding the new energy technologies for the availability of resources and better the social and economic development situations by the vast potential of employment opportunities (IEA, Citation2014). In addition, taxes and extra prices on energy lead to an increase in innovations and a reduction in traditional energy demand as it becomes higher.
3. Literature review
Due to the importance of energy in stimulating G.R. and progress, a plethora of literature has focused on the causal correlation between energy consumption (E.C.) and G.R., but the empirical evidence is diverse due to dissimilar approaches, hypotheses, countries selection and time period; however, it is a controversial issue. Simultaneously, the exploration of the energy-growth relationship required steam of information regarding the direction of causality. The empirical literature regarding the causal connection between energy-growth might be stated into four testable hypothesis growth hypotheses, feedback hypothesis, conservation hypothesis and neutrality hypothesis.
Firstly, the ‘growth hypothesis’ suggests that E.C. is a basic element of G.R. that directly affects input and indirectly as a supplement to capital and labor inputs in the production cycle. Based on this hypothesis, unidirectional causation from E.C. to G.R. indicates that the economy of the country is dependent on energy and energy is a limiting factor for G.R. Against this backdrop, energy conservation strategies may unfavorably affect the economy or lead to poor economic performance. Secondly, the ‘conservation hypothesis’ argues that G.R. originates from a rise in E.C. Unidirectional causality ranging from G.R. to E.C. suggests that the policies for energy conservation have slight to almost no negative influence on G.R. Third, the ‘feedback hypothesis’ states to bidirectional causation amongst E.C. and G.R. In other words, energy use and G.R. can act as complements, and policies on energy efficiency can restrict the economy. Fourthly, the ‘neutrality hypothesis’ stated that the association between E.C. and G.R. is not causal. A rise or fall in energy has no effect on G.R. according to this postulate.
With respect to the causal relationship, the ground-breaking investigation of Kraft and Kraft (Citation1978) discover unidirectional causality flowing from G.N.P. to E.C. Soytas and Sari (Soytas & Sari, Citation2003) used the bivariate model and found no causation among E.C. and G.R. for the U.S.A. and U.K. Soytas and Sari (Citation2006) found bidirectional causality between E.C. and G.R. Acaravci and Ozturk (Citation2010b) examined the linkage between E.C. and G.R. by using a multivariate model and found bidirectional causality. Similarly, Erdal et al. (Citation2008) analysed the linkage between E.C. and G.R. in Turkey from 1970–2006. The results show that there is a bidirectional causality in the bivariate framework. Al-Iriani (Al-Iriani, Citation2006) analysed the nexus between G.R. and E.C. in G.C.C. countries and found a unidirectional causality in the bivariate model. Lean and Smyth (Lean & Smyth, Citation2010) state that G.R. is affected by other indicators not only the E.C. Salisu et al. (Salisu et al., Citation2018) analyse the effect of E.C. on E.G. for oil exploring and oil-importing countries from the period 1980–2014 and argue that changes in E.C. impact G.R. for oil-exporting and oil-importing countries by using the bivariate model and effect is observed to be higher anterior than the latter. Azam et al. (Erdal et al., Citation2008) investigate the E.C.–G.R. nexus in Pakistan from 1990–2015. The findings reveal that there is a unidirectional causality running from G.R. to E.C. The conservative hypothesis is valid for this country.
Moreover, in recent years research on aggregate energy into types such as R.E. and N.R.E. and G.R. nexus has been examined in the literature. Shahbaz et al. (Citation2015) find unidirectional causation directing from G.R. to renewable E.C. in the short run, whereas in long-run bidirectional causality is found amongst series in a panel study of 12 E.U. states by using vector error correction model (V.E.C.M.) over the period 1990–2014. Shahbaz et al. (Citation2015) studied the relationship between R.E. and G.R. for Pakistan over the period 1972–2011 by employing the A.R.D.L. Model, Johnsen Co-integration and V.E.C.M. Granger Causality assessment. The findings revealed the existence of bidirectional causation among variables. Seong-Hoon Lee and YongHun Jung (Shahbaz et al., Citation2015) find evidence of the conservation hypothesis in South Korea by using A.R.D.L. and V.E.C.M. model from 1990–2012. The findings of this investigation display that R.E. has a negative influence on G.R.; as a result, R.E. is not the only element affecting the G.R.
Electricity is an imperative source of total final E.C. that may be produced from conventional and non-conventional energy. Today, emerging economies, in particular, developing countries, heavily rely on electricity and are facing power shortage problems. In developing countries, sufficient and consistent electricity supply is the most fundamental aspect that leads to economic development (Morimoto & Hope, Citation2004). E.L.C. has pre-orders for economic sectors, including in agricultural development, industrial production, transportation, construction, among others, a scarcity in electricity may have serious issues in manufacture and amenities. However, the stability in the electricity supply can lead to great importance for economic development (Aydin, Citation2019). Al-Mulali et al. (Al-Mulali et al., Citation2014) analyse the association between G.R., R.E.L.C. and N.R.E.L.C. for Latin American countries over the interval of 1980–2010 by assuming the dynamic ordinary least square (D.O.L.S.) estimation method and V.E.C.M. Granger causation check. The findings illustrate that R.E.L.C. is more important than N.R.E.L.C. in both short- and long-term on G.R. in the selected countries and V.E.C.M. results display that there is bi-directional causality between R.E.L.C. and G.R. as well as between N.R.E.L.C. and G.R. (Apergis & Payne, Citation2012) explored the association for Central American countries from 1990–2007 by using the fully modified ordinary least square (F.M.O.L.S) procedure and V.E.C.M. causality test. The findings indicate that all series have a positive and substantial effect on G.R., except for the R.E.L.C., and also suggested that a unidirectional causality between G.R. and R.E.L.C. occurred in long-term and bidirectional causation among G.R. and N.R.E.L.C. in both short and long-term.
Similarly, another article by Apergis and Payne (Citation2011a) examines the causal association between R.E.L.C. and N.R.E.L.C. by assuming co-integration of the Larsson system and V.E.C.M. causality test for the period 1990–2007. The study found that with the exception of R.E.L.C., all variables had a positive and noteworthy influence on G.R. and also showed a short-term unidirectional causality between R.E.L.C. and G.R. Dogan (Citation2015) focused on the potential existence of a short-term and long-term correlation between R.E.L.C., N.R.E.L.C. for Turkey through the use of the Gregory-Hansen co-integration study, the A.R.D.L. model and the V.E.C.M. Garner Causality Study from 1990–2012. The study concluded that all variables had a long-term positive impact on G.R., but renewable E.L.C. is negative and insignificant to explain G.R. Aydin (Aydin, Citation2019) investigates the causal connection between R.E.L.C., N.R.E.L.C. and G.R. by applying two types of causality: time-domain Granger causation and frequency domain Granger causativeness check for 26 O.E.C.D. countries for 19980–2015 and demonstrated the existence of bidirectional causality between R.E.L.C. and G.R. from time domain granger causality as well as bidirectional causation was found between G.R., N.R.E.L.C. from frequency domain granger causality test.
This study finds a number of gaps from previous studies in the literature. First, we study energy-growth literature by making a distinction between E.C., E.L.C. and electricity generation. This inquiry explores the association between renewable electricity generation and G.R., while prior studies focus on renewable E.L.C. and G.R. The word consumption differs from generation; consumption denotes the energy conveyed to end-use sectors. Whereas electricity generation measured in K.W.H. refers to the firm's production instead of end user’s consumption. Second, this is the first study to investigate the electricity generation from renewable sources and G.R. for 25 developing nations in a multi-variate context to avoid omitted variable bias problem. This motivates the study for using the indicator of electricity generation instead of consumption in these selected countries. Third, the time period of this study is chosen from 1990–2017, the latest data. The sample for the analysis has been governed by the data availability which is accessible for all series from 1990 onwards. Fourth, and the most important contribution is that we apply the A.R.D.L. model and to address the cross-sectional dependence (C.D.), panel heterogenous Dumitrescu Hurlin causality test, A.R.D.L. approach that is most widely used. Fifth, this study sheds light on the association of electricity generation by disaggregate entire electricity into types such as renewable and N.R.E. generation. reviews the prior studies that analyse the total E.C.–G.R., R.E. consumption-G.R., E.L.C.–G.R. and R.E.L.C. and N.R.E.L.C.–G.R., respectively, but the empirical evidence on the relationship was mixed.
Table 2. Survey of existing literature.
4. Model, data and methodology
The studies of Dogan (Citation2015), Apergis and Payne (Citation2012) and Aydin (Citation2019) debate on the energy–growth nexus, this study analyse the short run and long run effect of explanatory variables on target variable as well as causal relationship. Generally, the equation of the econometric production function model is given as follows:
(1)
(1)
we can re-write EquationEq. (1)
(1)
(1) in panel data form as presented below:
(2)
(2)
Where the subscript i = 1,…N for each state in the panel and t = 1,…,T indicates the time period, the output elasticities with respect to RE, NRE, K L are β1, β2, β3, β4 respectively. εit is the normally distributed error term and the coefficient β0 allows for the possible country-fixed effect. The annual data is used for the pane of 25 developing countries as represented in over the period 1990–2017, spanning 27 years. The data were obtained from U.S. E.I.A. (IEA, Citation2015) and world development indicators (WDI; World Bank, Citation2017). G.R. is measured in current US$, R.E. is the electricity generation from renewable sources (hydro, wind, solar, geothermal, biomass measured in k.W.h.), N.R.E. electricity generation from non-renewable sources (oil, coal, gas measured in k.W.h.), K is the gross fixed capital formation express (in current US$) and L is the total labor force (in millions) (World Bank, Citation2017). The summary of the descriptive statistics is represented in .
Table 3. List of designated developing nations.
Table 4. Source of the analysis variables and descriptive statistics.
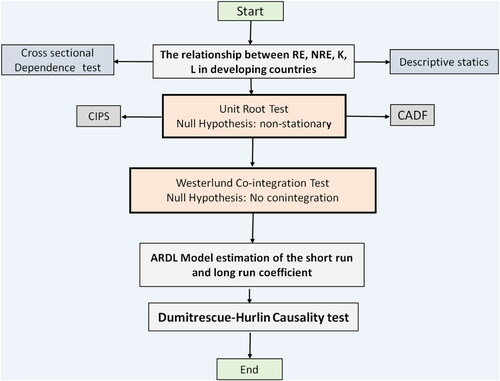
The econometric methods used in this are: firstly, we will apply a cross-section dependence test to determine which unit root test is appropriate for this investigation. Secondly, we will use a second-generation panel unit root test Pesaran (Pesaran, Citation2006) to examine the stability of all variables in the same order. Thirdly, a panel cointegration test Westerlund (Pesaran, Citation2006) will be used to check whether the series are integrated, then we employ the panel A.R.D.L. model (Pesaran et al., Citation1999) to estimate the short and long run analysis. Lastly, we will use Dumitrescu Hurlin (Pesaran, Citation2006) causality test to infer the direction of causation. The overview of the methodological framework is illustrated in .
Figure 5. Methodological framework of the study.
Source: Authors.
5. Empirical results and discussion
To select the appropriate unit root test type, it is significant to test C.D. for the given series in panel data sets (Pesaran, Citation2006). Therefore, we use Lagrange Multiplier (L.M.) and bias-adjusted L.M. proposed by Breusch and Pagan (Citation1980), Pesaran et al. (Citation2008) and C.D. (Friedman, Citation1937) and CDLM (Pesaran, Citation2004) approaches.
As mentioned above, L.M. test is chosen for small N and large T:
(3)
(3)
CDLM tactic is appropriate for large samples N and T as given below in (EquationEq. 5(5)
(5) )
(4)
(4)
CD method is suitable for large N and fixed T as given below in (EquationEq. 5(5)
(5) )
(5)
(5)
This test is appropriate for fixed T and N. The improved LMadj test statistics are presented as fellows in EquationEq. 6(6)
(6) :
(6)
(6)
In these statistics, is the sample estimation for the pairwise residual correlation, µTij and υ2 Tij indicate the mean and variance. The LMadj test statistics obtained from the above EquationEq. 6
(6)
(6) represent the standard normal distribution.
illustrates the results of this test. Based on the results of this method, the null hypothesis is rejected because (P-values < 5%), which indicates that the existence of C.D. at a 1% significance level for all series.
Table 5. Cross-sectional dependence test outcomes.
Since it has been considering the potential of cross-section dependency in our study, we utilise a second generation panel unit root test proposed by (Pesaran et al., Citation2008), including cross-sectional Im, K.S., Pesaran, M.H., Shin, Y (C.I.P.S.) unit root test and cross-sectionally Augmented Dickey-Fuller (C.A.D.F) methods. Pesaran (Pesaran et al., Citation2008) reported that the conventional A.D.F. regression with a cross-sectional average and its first difference to get the C.A.D.F. method. The C.A.D.F. model can be presented as follows in EquationEq. 7(7)
(7) .
(7)
(7)
Where in the C.A.D.F. Equationeq. 7(7)
(7) ȳt-1 is the average of lagged levels at time t of all N observations and ȳt is the first difference of the individual series of the model. After estimating the C.A.D.F. regression for each cross-section, the C.I.P.S. statistics can be obtained by averaging the t-statistics on the lagged value:
(8)
(8)
Where the CADFi is the cross-sectional augmented Dickey-Fuller statistics for ith cross-section unit. In the existence of C.D., this test gives more consistent and accurate results than the first generation test.
Results of C.I.P.S. and C.A.D.F. methods are reported in and . Both tests revealed that series are non-stationary at their respective levels but becomes stationary at their first difference. The rejection of the null hypothesis of the unit root for all variables of both tests is at 1% significance levels, respectively. This shows that all the series such as GR, RE, NRE, K and L are integrated at the same orde (I(1). Next, we can proceed with the Westerlund co-integration test Westerlund (Pesaran, Citation2004) to estimate the long-run association among the studied variables.
Table 6. Results of panel unit root CIPS test.
Table 7. Results of panel unit root C.A.D.F. test.
Westerlund (Pesaran, Citation2004) co-integration method is based on four test statistics such as Gt, Ga, Pt and Pa. The first two test statistics show the co-integration for group mean a test that estimates the coefficient for a single region and the other two tests and the other two methods are dependent on the panel as a whole. represents the Westerlund co-integration test results. According to this test, three out of four test statistics represent that the studied variables are cointegrated.
Table 8. Results of Westerlund co-integration test.
Further, this study applies the A.R.D.L./P.M.G. method developed by (Dumitrescu & Hurlin, Citation2012) in order to estimate both the short-run and long-run dynamics relationships amidst series. This model is most widely used and has unique advantages than other cointegration techniques which include: (i) if the series are cointegrated at I(1) or I(0) or a mix of both I(0) and I (1), but none of the variables are integrated I (2). Under this situation, we can use the ARDL method; (ii) concurrently; it can be estimated both short-term and long-term influences with the single linear transformation; (iii) it takes a sufficient number of lags in order to capture data generation system in general to a particular form; and (iv) lastly, this method is relatively more consistent and efficient infinite and small sample data size and provide the significant cointegration results for small sample size. The panel A.R.D.L. (p, q) framework, including lag p on the target variable and lag q for the independent variables. This model can be formulated as follows in EquationEq. 9(9)
(9)
(9)
(9)
Where G.R. indicates the response variable and other R.E., N.R.E., K and L are explanatory variables, Δ suggests the difference operator,φ, θ, ω, β, δ are the short-run coefficients, while λ1, λ2, λ3, λ4, λ5 indicate the long-run coefficients, p, q, q, q,q represent the maximum number of lag length and εit is the error term.
The findings of short and long-run coefficients on R.E., N.R.E., K and L display in . The results show that all estimated coefficients are positive and significant, and most important, the coefficient for R.E.S.E. Start from long-run results, a 1% improvement in renewable electricity generation boosts the G.R. by 0.1449% at1% significance level and an increase in N.R.E. consumption by 1% will increase by 0.1374%. Furthermore, a 1% augment in gross capital formation increase G.R. by 0.612% and a 1% increase in labor promotes G.R. by 2.162% at 1% significance levels, respectively. It indicates that an increase in all analysed variables augments the G.R. in the long run. As in short-run analysis, both kinds of E.L.C., renewable and non-renewable, are insignificant in explaining the G.R.. Whereas a 1% rise in gross capital formation and labor stimulates the G.R. with a fair degree of 0.0070% and 0.023%, respectively, at 1% and 5% significance levels. Since the lagged error correction term E.C.T. (-1), the coefficient of E.C.T. is negative and statistically significant at the 1% level which represents the occurrence of the long-run correlation between G.R., R.E., N.R.E., k and L. In addition, the coefficient estimation of E.C.T.(-1) indicates that the deviations from long-run equilibrium are amended by almost 39% in each year. As concluded from the short-run analysis, the G.R. is not influenced by variations in R.E. and N.R.E., while G.R. is affected by fluctuations of K and L in the short run.
Table 9. Results of A.R.D.L. estimation model using P.M.G. estimator.
For the sake of evaluation between long run coefficient of G.R. with respect to other relevant explanatory variables such as R.E., N.R.E., K and L in this study and other previous studies as shown in . We compare only long-run coefficient estimation with prior studies because they did not approximate short-run coefficients on R.E., N.R.E., K and L. The results of our study are in line with earlier studies of Apergis and Payne (Citation2011a, Citation2012), who argues that the estimated long-run coefficients of renewable electricity generation are positive and significant but contrary to those (Fallahi, Citation2011) in which renewable electricity generation has no long-run impact on G.R. As mentioned above, these studies focus only on long-run coefficients, whereas we focus on the long run as well as short-run estimation in this study. This might cause the declared difference in this study with these previous studies.
Table 10. Compare the long run estimation of our study with past studies.
The direction of causality helps the policymakers in order to levy relevant economic policies for sustainable G.R.. For this purpose, we employ Dumitrescu-Hurlin (2012) heterogeneous Granger causality method that assumes the short-run causality as well as long-run causality. The D.H. has two advantages over other traditional panel causality methods: (i) it can be applied under the situation of T > N and T < N, for unbalanced data and for heterogeneous panels; and (ii) considers cross-sectional dependency. Based on the D.H., short-run causality among the series is determined and the long-run causation is analysed by statistical significance of error correction term E.C.T.(-1) obtained from the residual of EquationEq.3(3)
(3) . DH based on the following linear heterogeneous model:
(10)
(10)
Where the subscripts i indicate the individual cross-sectional unit and t refers to the time period. is individual effects which assumesto be be fixed in tme dimension. j refers to the optimum lag interval for all cross-sections,
assumes the autoregressive coefficients and
is the regression parameter allowed to vary among the groups, εit is the vector of error terms x and y represent the series in which causality will be assessed. Under this situation, the aim of this test is to detect whether the X cause Y or not.
The outcomes of both sort run and long run causalities are shown in . The short-run results indicate that there is bidirectional causation among R.E., K and G.R. support the feedback hypothesis. There is a unidirectional causality running from G.R. to N.R.E., revealing the conservative hypothesis. There is also a short run unidirectional causality flowing from L to G.R. While on the other hand, there is long-run bidirectional causality among G.R. and the error correction mechanism is supporting the feedback hypothesis. The results indicate that improvement in the R.E., K, L, N.R.E. can influence G.R. vice versa. As the response variable is G.R., we only compared the direction of causality between G.R. and R.E., G.R. and N.R.E., G.R. and K, G.R. and L series of our studies with other preceding studies in . Since outcomes are mixed at best, and without any sort of doubt, no clear agreement has been found on the causal association among G.R. and R.E. as well as in N.R.E.
Table 11. Panel Dumitrescu-Hurlin causality results.
Table 12. Comparison between the direction of causality in this study and prior studies.
6. Conclusion and implications for policy
The main aim of this study is to investigate short-run and long-run relationships along with the direction of causality between G.R. and R.E. for 25 developing nations within a multi-variate context over the period 1990–2017. Our study uses second-generation tests such as C.I.P.S. and C.A.D.F. that into account the existence of both heterogeneity and C.D., panel heterogonous co-integration test, A.R.D.L. model and Dumitrescu-Hurlin Granger causality test is applied to infer the direction of causality.
The outcomes from the Pesaran C.D. test refers to the presence of heterogeneity and C.D. over nations for studied series. Both C.I.P.S. and C.A.D.F. panel unit root techniques present that explored variables are non-stationary at their levels but becomes stationary at their first difference. The co-integration test revealed that all variables are co-integrated. Moreover, the P.M.G./A.R.D.L. approach specifies that an increase in R.E., N.R.E., K and L stimulates the G.R. in the long run. While on the other hand, R.E. sources electricity generation and N.R.E. generation are insignificant in examining the G.R. in the short run. Moreover, findings from D.H. heterogeneous panel causality in short-run indicate that there is bidirectional causation between R.E., K, L and G.R. support the feedback hypothesis. In addition, a short run uni-directional is found from N.R.E. to G.R., revealing the conservative hypothesis. Since in the long-run there is bidirectional causality between G.R. and error correction mechanism supporting the feedback hypothesis. The results indicate that improvement in the R.E., K, L, N.R.E. can influence G.R. vice versa.
The outcomes of this study represent that R.E. and G.R. cause with each other, which means to use more R.E. sources for sustainable G.R.. However, policymakers should upsurge their investment in R.E. energy sources by providing loans in favorable circumstances for excessive electricity supply. Moreover, policymakers need to lunch the innovations for the implementation and market availability of R.E. such as tax credits, R.E. portfolio standards, reimbursements for the installation of R.E. system and the formation of markets R.E. certificates for the enhancement R.E. sector. Moreover, these countries should diminish the electricity production from N.R.E. sources by executing their energy-saving projects and increasing energy efficiency.
Acknowledgments
The authors gratefully acknowledge the funding of the National Natural Science Foundation of China (71673085) and the Fundamental Research Funds for the Central Universities (2018ZD14). The authors would also like to acknowledge great thanks to anonymous reviewers for their valuable comments which largely improve the academic quality of this article. The usual caveats apply.
Disclosure statement
No potential conflict of interest was reported by the authors.
Correction Statement
This article has been republished with minor changes. These changes do not impact the academic content of the article.
References
- Acaravci, A., & Ozturk, I. (2010a). Electricity consumption-growth nexus: Evidence from panel data for transition countries. Energy Economics, 32(3), 604–608. https://doi.org/https://doi.org/10.1016/j.eneco.2009.10.016
- Acaravci, A., & Ozturk, I. (2010b). On the relationship between energy consumption, CO2 emissions and economic growth in Europe. Energy, 35(12), 5412–5420. https://doi.org/https://doi.org/10.1016/j.energy.2010.07.009
- Akinlo, A. E. (2009). Electricity consumption and economic growth in Nigeria: Evidence from cointegration and co-feature analysis. Journal of Policy Modeling, 31(5), 681–693. https://doi.org/https://doi.org/10.1016/j.jpolmod.2009.03.004
- Al-Iriani, M. A. (2006). Energy–GDP relationship revisited: An example from GCC countries using panel causality. Energy Policy, 34(17), 3342–3350. https://doi.org/https://doi.org/10.1016/j.enpol.2005.07.005
- Al-Mulali, U., Fereidouni, H. G., Lee, J. Y., & Sab, C. N. B. C. (2013). Examining the bi-directional long run relationship between renewable energy consumption and GDP growth. Renewable and Sustainable Energy Reviews, 22, 209–222. https://doi.org/https://doi.org/10.1016/j.rser.2013.02.005
- Al-Mulali, U., Fereidouni, H. G., & Lee, J. Y. M. (2014). Electricity consumption from renewable and non-renewable sources and economic growth: Evidence from Latin American countries. Renewable and Sustainable Energy Reviews, 30, 290–298. https://doi.org/https://doi.org/10.1016/j.rser.2013.10.006
- Al Jaber, S. A. (2012). Renewables 2012 global status report. REN21 Renewable Energy Policy Network/Worldwatch. https://www.ren21.net/Portals/0/documents/Resources/GSR2012_low%20res_FINAL.pdf
- Angelis-Dimakis, A., Biberacher, M., Dominguez, J., Fiorese, G., Gadocha, S., Gnansounou, E., Guariso, G., Kartalidis, A., Panichelli, L., Pinedo, I., & Robba, M. (2011). Methods and tools to evaluate the availability of renewable energy sources. Renewable and Sustainable Energy Reviews, 15(2), 1182–1200. https://doi.org/https://doi.org/10.1016/j.rser.2010.09.049
- Apergis, N., & Payne, J. E. (2012). The electricity consumption-growth nexus: Renewable versus non-renewable electricity in Central America. Energy Sources, Part B: Economics, Planing and Policy, 7(4), 423–431. https://doi.org/https://doi.org/10.1080/15567249.2011.639336
- Apergis, N., & Payne, J. E. (2012). Renewable and non-renewable energy consumption-growth nexus: Evidence from a panel error correction model. Energy Economics, 34(3), 733–738. https://doi.org/https://doi.org/10.1016/j.eneco.2011.04.007
- Apergis, N., & Payne, J. E. (2011a). The renewable energy consumption-growth nexus in Central America. Applied Energy, 88(1), 343–347. https://doi.org/https://doi.org/10.1016/j.apenergy.2010.07.013
- Apergis, N., & Payne, J. E. (2011b). Renewable and non-renewable electricity consumption-growth nexus: Evidence from emerging market economies. Applied Energy, 88(12), 5226–5230. https://doi.org/https://doi.org/10.1016/j.apenergy.2011.06.041
- Apergis, N., & Payne, J. E. (2010a). Renewable energy consumption and economic growth: Evidence from a panel of OECD countries. Energy Policy, 38(1), 656–660. https://doi.org/https://doi.org/10.1016/j.enpol.2009.09.002
- Apergis, N., & Payne, J. E. (2010b). A panel study of nuclear energy consumption and economic growth. Energy Economics, 32(3), 545–549. https://doi.org/https://doi.org/10.1016/j.eneco.2009.09.015
- Apergis, N., Payne, J. E., Menyah, K., & Wolde-Rufael, Y. (2010). On the causal dynamics between emissions, nuclear energy, renewable energy, and economic growth. Ecological Economics, 69(11), 2255–2260. https://doi.org/https://doi.org/10.1016/j.ecolecon.2010.06.014
- Aydin, M. (2019). Renewable and non-renewable electricity consumption–economic growth nexus: Evidence from OECD countries. Renewable Energy, 136, 599–606. https://doi.org/https://doi.org/10.1016/j.renene.2019.01.008
- Azam, A., Rafiq, M., & Arif, I. (2016). The economics of wind energy of Pakistan. In 2016 International Conference on Emerging Technologies (ICET) (pp. 1–6). IEEE. https://doi.org/https://doi.org/10.1109/ICET.2016.7879543
- Bayar, Y., & Özel, H. (2014). Electricity consumption and economic growth in emerging economies. Journal of Knowledge Management, Economics and Information Technology, 4(2), 15.
- Bildirici, M. (2012). Economic growth and electricity consumption in Africa and Asia: MS-VAR and MS-Granger causality analysis. https://papers.ssrn.com/sol3/papers.cfm?abstract_id=2129017
- Breusch, T. S., & Pagan, A. R. (1980). The Lagrange multiplier test and its applications to model specification in econometrics. The Review of Economic Studies, 47(1), 239–253. https://doi.org/https://doi.org/10.2307/2297111
- British Petroleum. (2014). BP statistical review of world energy, June 2014. http://large.stanford.edu/courses/2014/ph240/milic1/docs/bpreview.pdf
- Costantini, V., & Martini, C. (2010). The causality between energy consumption and economic growth: A multi-sectoral analysis using non-stationary cointegrated panel data. Energy Economics, 32(3), 591–603. https://doi.org/https://doi.org/10.1016/j.eneco.2009.09.013
- Destek, M. A., & Sinha, A. (2020). Renewable, non-renewable energy consumption, economic growth, trade openness and ecological footprint: Evidence from organisation for economic Co-operation and development countries. Journal of Cleaner Production, 242, 118537. https://doi.org/https://doi.org/10.1016/j.jclepro.2019.118537
- Destouni, G., & Frank, H. (2010). Renewable energy. AMBIO, 39 (S1), 18–21. https://doi.org/https://doi.org/10.1007/s13280-010-0059-7
- Dogan, E. (2015). The relationship between economic growth and electricity consumption from renewable and non-renewable sources: A study of Turkey. Renewable and Sustainable Energy Reviews, 52, 534–546. https://doi.org/https://doi.org/10.1016/j.rser.2015.07.130
- Dumitrescu, E.-I., & Hurlin, C. (2012). Testing for Granger non-causality in heterogeneous panels. Economic Modelling, 29(4), 1450–1460. https://doi.org/https://doi.org/10.1016/j.econmod.2012.02.014
- Ellabban, O., Abu-Rub, H., & Blaabjerg, F. (2014). Renewable energy resources: Current status, future prospects and their enabling technology. Renewable and Sustainable Energy Reviews, 39, 748–764. https://doi.org/https://doi.org/10.1016/j.rser.2014.07.113
- Erdal, G., Erdal, H., & Esengün, K. (2008). The causality between energy consumption and economic growth in Turkey. Energy Policy, 36(10), 3838–3842. https://doi.org/https://doi.org/10.1016/j.enpol.2008.07.012
- EREC. (2010). 2050: A 100% renewable energy vision for the European Union. https://ec.europa.eu/clima/sites/clima/files/docs/0005/registered/91650013720-46_european_renewable_energy_council_en.pdf
- EWEA. (2011a). Pure power-wind energy targets for 2020 and 2030. EWEA.
- EWEA. (2011b). EU Energy policy to 2050. EWEA.
- Fallahi, F. (2011). Causal relationship between energy consumption (EC) and GDP: A Markov-switching (MS) causality. Energy, 36(7), 4165–4170. https://doi.org/https://doi.org/10.1016/j.energy.2011.04.027
- Friedman, M. (1937). The use of ranks to avoid the assumption of normality implicit in the analysis of variance. Journal of the American Statistical Association, 32(200), 675–701. https://doi.org/https://doi.org/10.1080/01621459.1937.10503522
- Guo, X., Zhang, X., Du, S., Li, C., Siu, Y. L., Rong, Y., & Yang, H. (2020). The impact of onshore wind power projects on ecological corridors and landscape connectivity in Shanxi. Journal of Cleaner Production, 254, 120075. https://doi.org/https://doi.org/10.1016/j.jclepro.2020.120075
- Ho, C.-Y., & Siu, K. W. (2007). A dynamic equilibrium of electricity consumption and GDP in Hong Kong: An empirical investigation. Energy Policy, 35(4), 2507–2513. https://doi.org/https://doi.org/10.1016/j.enpol.2006.09.018
- Hu, H., Xie, N., Fang, D., & Zhang, X. (2018). The role of renewable energy consumption and commercial services trade in carbon dioxide reduction: Evidence from 25 developing countries. Applied Energy, 211, 1229–1244. https://doi.org/https://doi.org/10.1016/j.apenergy.2017.12.019
- Huang, Z., Wang, F., Wang, Q., Yao, W., Sun, K., Zhang, R., Zhao, J., Lou, Z., & Li, J. (2019). Significantly enhanced electrical performances of eco-friendly dielectric liquids for harsh conditions with fullerene. Nanomaterials, 9(7), 989. https://doi.org/https://doi.org/10.3390/nano9070989
- IEA. (2009). International energy outlook: 2009. Energy Inf. As sociation.
- IEA. (2012). Technology roadmap: Bioenergy for heat and power. https://www.iea.org/reports/technology-roadmap-bioenergy-for-heat-and-power
- IEA. (2015). Energy and climate change, world energy outlook special report. https://www.actu-environnement.com/media/pdf/news-24754-rapport-aie.pdf
- International Energy Agency (IEA). (2015). Energy technology perspectives 2015. https://doi.org/https://doi.org/10.1787/energy_tech-2015-en
- International Energy Agency (IEA). (2014). Sustainable energy for all 2013–2014: Global tracking framework report. The World Bank.
- International Energy Outlook. (2010). Energy information administration. Department of Energy, 92010, pp. 1–15. http://large.stanford.edu/courses/2010/ph240/riley2/docs/EIA-0484-2010.pdf
- Kahia, M., Kadria, M., Aissa, M. S., Ben., & Lanouar, C. (2017). Modelling the treatment effect of renewable energy policies on economic growth: Evaluation from MENA countries. Journal of Cleaner Production, 149, 845–855. https://doi.org/https://doi.org/10.1016/j.jclepro.2017.02.030
- Kraft, J., & Kraft, A. (1978). On the relationship between energy and GNP. Journal of Energy Development, 3(2), 401–403.
- Kumari, A., & Sharma, A. K. (2016). Analyzing the causal relations between electric power consumption and economic growth in India. The Electricity Journal, 29(4), 28–35. https://doi.org/https://doi.org/10.1016/j.tej.2016.04.008
- Lean, H. H., & Smyth, R. (2010). CO2 emissions, electricity consumption and output in ASEAN. Applied Energy, 87(6), 1858–1864. https://doi.org/https://doi.org/10.1016/j.apenergy.2010.02.003
- Marinaș, M.-C., Dinu, M., Socol, A.-G., & Socol, C. (2018). Renewable energy consumption and economic growth. Causality relationship in Central and Eastern European countries. PLoS One, 13(10), e0202951. https://doi.org/https://doi.org/10.1371/journal.pone.0202951
- Menegaki, A. N. (2011). Growth and renewable energy in Europe: A random effect model with evidence for neutrality hypothesis. Energy Economics, 33(2), 257–263. https://doi.org/https://doi.org/10.1016/j.eneco.2010.10.004
- Menyah, K., & Wolde-Rufael, Y. (2010). CO2 emissions, nuclear energy, renewable energy and economic growth in the US. Energy Policy, 38(6), 2911–2915. https://doi.org/https://doi.org/10.1016/j.enpol.2010.01.024
- Mohsenipour, M., Ebadollahi, M., Rostamzadeh, H., & Amidpour, M. (2020). Design and evaluation of a solar-based trigeneration system for a nearly zero energy greenhouse in arid region. Journal of Cleaner Production, 254, 119990. https://doi.org/https://doi.org/10.1016/j.jclepro.2020.119990
- Morimoto, R., & Hope, C. (2004). The impact of electricity supply on economic growth in Sri Lanka. Energy Economics, 26(1), 77–85. https://doi.org/https://doi.org/10.1016/S0140-9883(03)00034-3
- Nazlioglu, S., Kayhan, S., & Adiguzel, U. (2014). Electricity consumption and economic growth in Turkey: Cointegration, linear and nonlinear granger causality. Energy Sources, Part B Economic Planning, Policy, 9(4), 315–324. https://doi.org/https://doi.org/10.1080/15567249.2010.495970
- Ohler, A., & Fetters, I. (2014). The causal relationship between renewable electricity generation and GDP growth: A study of energy sources. Energy Economics, 43, 125–139. https://doi.org/https://doi.org/10.1016/j.eneco.2014.02.009
- Ouédraogo, I. M. (2010). Electricity consumption and economic growth in Burkina Faso: A cointegration analysis. Energy Economics, 32(3), 524–531. https://doi.org/https://doi.org/10.1016/j.eneco.2009.08.011
- Pekez, J., Radovanovc, L., Desnica, E., & Lambic, M. (2016). The increase of exploitability of renewable energy sources. Energy Sources, Part B Econ. Planning, Policy, 11(1), 51–57. https://doi.org/https://doi.org/10.1080/15567249.2011.580318
- Perrin, A., Wohlfahrt, J., Morandi, F., Østergård, H., Flatberg, T., De La Rua, C., Bjørkvoll, T., & Gabrielle, B. (2017). Integrated design and sustainable assessment of innovative biomass supply chains: A case-study on miscanthus in France. Applied Energy, 204, 66–77. https://doi.org/https://doi.org/10.1016/j.apenergy.2017.06.093
- Pesaran, H. M. (2004). General diagnostic tests for cross-sectional dependence in panels. Cambridge Work. Pap. Econ. 435, University of Cambridge.
- Pesaran, M. H. (2006). Estimation and inference in large heterogeneous panels with a multifactor error structure. Econometrica, 74(4), 967–1012. https://doi.org/https://doi.org/10.1111/j.1468-0262.2006.00692.x
- Pesaran, M. H., Shin, Y., & Smith, R. P. (1999). Pooled mean group estimation of dynamic heterogeneous panels. Journal of the American Statistical Association, 94(446), 621–634. https://doi.org/https://doi.org/10.1080/01621459.1999.10474156
- Pesaran, M. H., Ullah, A., & Yamagata, T. (2008). A bias‐adjusted LM test of error cross‐section independence. The Econometrics Journal, 11(1), 105–127. https://doi.org/https://doi.org/10.1111/j.1368-423X.2007.00227.x
- Saad, W., & Taleb, A. (2018). The causal relationship between renewable energy consumption and economic growth: Evidence from Europe. Clean Technologies and Environmental Policy, 20, 127–136. https://doi.org/https://doi.org/10.1007/s10098-017-1463-5
- Sadorsky, P. (2009). Renewable energy consumption and income in emerging economies. Energy Policy, 37(10), 4021–4028. https://doi.org/https://doi.org/10.1016/j.enpol.2009.05.003
- Salisu, A., Oloko, T., Okunoye, I., Opeloyeru, O., & Olabisi, N. (2018). Energy consumption and economic growth in oil importing and oil exporting countries: A Panel ARDL approach. Working Papers 048, Centre for Econometric and Allied Research, University of Ibadan.
- Savino, M. M., Manzini, R., Della Selva, V., & Accorsi, R. (2017). A new model for environmental and economic evaluation of renewable energy systems: The case of wind turbines. Applied Energy, 189, 739–752. https://doi.org/https://doi.org/10.1016/j.apenergy.2016.11.124
- Shahbaz, M., Loganathan, N., Zeshan, M., & Zaman, K. (2015). Does renewable energy consumption add in economic growth? An application of auto-regressive distributed lag model in Pakistan. Renewable and Sustainable Energy Reviews, 44, 576–585. https://doi.org/https://doi.org/10.1016/j.rser.2015.01.017
- Soytas, U., & Sari, R. (2006). Energy consumption and income in G-7 countries. Journal of Policy Modeling, 28(7), 739–750. https://doi.org/https://doi.org/10.1016/j.jpolmod.2006.02.003
- Soytas, U., & Sari, R. (2003). Energy consumption and GDP: causality relationship in G-7 countries and emerging markets. Energy Economics, 25(1), 33–37. https://doi.org/https://doi.org/10.1016/S0140-9883(02)00009-9
- Squalli, J. (2007). Electricity consumption and economic growth: Bounds and causality analyses of OPEC members. Energy Economics, 29(6), 1192–1205. https://doi.org/https://doi.org/10.1016/j.eneco.2006.10.001
- Topcu, Y. I., & Ulengin, F. (2004). Energy for the future: An integrated decision aid for the case of Turkey. Energy, 29(1), 137–154. https://doi.org/https://doi.org/10.1016/S0360-5442(03)00160-9
- Tugcu, C. T., Ozturk, I., & Aslan, A. (2012). Renewable and non-renewable energy consumption and economic growth relationship revisited: evidence from G7 countries. Energy Economics, 34(6), 1942–1950. https://doi.org/https://doi.org/10.1016/j.eneco.2012.08.021
- World Bank. (2017). World development indicators database: 2017. World Bank Group.
- Yahya, F., & Rafiq, M. (2019). Unraveling the contemporary drivers of renewable energy consumption: Evidence from regime types. Environmental Progress & Sustainable Energy, 38(5), 13178. https://doi.org/https://doi.org/10.1002/ep.13178
- Yuan, J., Zhao, C., Yu, S., & Hu, Z. (2007). Electricity consumption and economic growth in China: Cointegration and co-feature analysis. Energy Economics, 29(6), 1179–1191. https://doi.org/https://doi.org/10.1016/j.eneco.2006.09.005
- Zafar, M. W., Shahbaz, M., Hou, F., & Sinha, A. (2019). From nonrenewable to renewable energy and its impact on economic growth: The role of research & development expenditures in Asia-Pacific Economic Cooperation countries. Journal of Cleaner Production, 212, 1166–1178. https://doi.org/https://doi.org/10.1016/j.jclepro.2018.12.081
- Zhang, H., Zhang, X., Zhao, C., & Yuan, J. (2019). Electricity consumption and economic growth in BRI countries: Panel causality and policy implications. Emerging Markets Finance and Trade, 2019, 1–16. https://doi.org/https://doi.org/10.1080/1540496X.2019.1601551
- Zhixin, Z., & Xin, R. (2011). Causal relationships between energy consumption and economic growth. Energy Procedia, 5, 2065–2071. https://doi.org/https://doi.org/10.1016/j.egypro.2011.03.356