
 ?Mathematical formulae have been encoded as MathML and are displayed in this HTML version using MathJax in order to improve their display. Uncheck the box to turn MathJax off. This feature requires Javascript. Click on a formula to zoom.
Abstract
After the opening policy in 1978, China’s tourism increasingly took relevance, up to become an important industry in the last two decades. Despite this, no analysis has been conducted at macroeconomic level to check both tourism industry interdependencies and wealth creation. To fill this gap, in this paper we elaborated an innovative conceptual model for the theory-based analysis of the tourism phenomenon in China, having the Keynesian macroeconomic theory as the background and using an SAM as the model accounting representation, and conducted an original, comprehensive methodological analysis of China’s tourism industry. As the database, we used a purposively elaborated 2015 SAM for China with 19 industries, on whose basis we identified endogenous and exogenous accounts, set up an innovative impact multiplier model adjusted to them and conducted an economic analysis of tourism interdependencies never performed so far. Evidence shows that manufacturing, agriculture and trade industries provide a relevant support to tourism services production, and that tourism greatly contributes to value added/GDP and household income creation. Overall, tourism industry has direct policy management implications, representing a sector on which enterprises and government can profitably base their decisions, with exogenous tourism demand shocks positively activating China’s economic system and growth.
1. Introduction
1.1. An overview on tourism industry in China
The importance of China’s tourism for the economic growth of the country is witnessed by the internal and international debate and the empirical analyses that are being performed on the role and the activity of all the operators that revolve around the production of tourist services and on the domestic, inbound and outbound demand of them.
While at the early stage of the People’s Republic travel and tourism were considered a form of political activity, which growth was further limited by the Cultural Revolution, 1978 China’s opening the door to the outside world policy made tourism as a relevant economic strategy among other growth options, which have jointly contributed to the subsequent country’s economic and socio-cultural transformation (Xiao, Citation2006; Wen, Citation2001).
Considering tourism as a form of economic activity had manifold positive consequences on China’s current social life as well at the macro and micro economic scale.
Domestic tourism remarkably increased, allowing Chinese population, widely spread territorially, with strong income, cultural, educational inequality in urban and rural areas, and divided into innumerable nationalities, to get to know better each other and to strengthen the community social fabric.
Inbound tourism, and more recently, outbound one, increased as well, allowing the Chinese population to enter in contact with people having different habits, traditions, mentalities, and therefore to open up to the new and make an effort to understand and accept different races, religions, cultures, thus strengthening its attitude to friendship and acceptance.
This stimulated competition among tourism enterprises, institutions and public and private bodies, with positive effects on prices and quality of tourism services. As a result, according to the World Economic Forum (Citation2017), China ranked 15th globally, and 4th in Asia and the Pacific area in the global Travel & Tourism Competitive Index 2017.
Just to catch some background element, useful to highlight the importance that tourist phenomenon is gaining in the economic context, let us have a look at two fundamental parameters, such as Gross Domestic Product (GDP) and income produced by tourism and at their contribution to global GDP and global household disposable income, respectively.
Indeed, in 2017, the GDP for China accounted for 827,121.7 billion yuan (National Bureau of Statistics of China, Citation2018), equivalent to 231,686.8 billion international US$, using the PPP GDP for China provided by the International Comparison Program (ICP) equal to 3.57 (World Bank, Citation2018). The GDP from travel and tourism accounted for 14,594.1 billion yuan making the direct contribution of this industry to global GDP equal to 1.8%, lower than the average 7.0% recorded in the most important western countries, but relevant at all if regarded in the framework of the global evolution of Chinese tourism since the opening policy. From the same source, 2017 China’s household disposable income accounted for 36,105.9 billion yuan, whereas the household income from tourism accounted for 2,513.2 billion international US$, obtained by summing 1,234.2 billion international US$from inbound tourism based on foreign exchanges to 45,660.8 100 million yuan, equivalent to 1,279.0 international US$. Thus, the direct contribution to household disposable income accounted for 7.0%, a very high figure. Both these percentages witness the importance of tourism on the China’s macroeconomic framework.
The perception of the relevance of tourism industry within the Chinese economy emerged in the last decades, at the government and at the academic research levels. This is confirmed by the increasing attention put by the former and by the great number of papers has been written to analyse it: Leung et al. (Citation2014) surveyed 147 for the period 2010–2012 only. They deal with nearly all the aspects of the economic, social and cultural life of China, such as history, politics, and culture, psychology, literature, tourism economics, hotel and restaurant administration, urban and regional planning, marketing, business, political science, education, finance.
Nonetheless, no analysis on tourism industry and its relations with the other industries, institutional sectors and factors, and on the impact of external demand for tourism on them has been performed at a macroeconomic scale, that is, in the framework of China’s economic system.
In this paper, we want just to approach and analyse the tourism phenomenon and contribute to the understanding of its characteristics in the above comprehensive way. To this purpose, we will conduct the study in the background of the Keynesian theory, by using a Social Accounting Matrix (SAM) as the database and an adjusted impact multiplier model as the methodology. Indeed, this way of proceeding is completely new, never attempted so far.
In China, a number of SAMs have been elaborated for the most varied analyses aimed at being carried out in the framework of the country’s economic system. In what follows, we briefly illustrate and discuss their characteristics and their possible use as tools for the analysis of tourism.
1.2. Literature review on SAMs for China
Environment and taxation have carved out a prominent place in the interest of researchers.Footnote1 The environmentally extended SAM (ESAM) proposed by Xie (Citation2000) and Xie and Saltzman (Citation2000) stand as pioneer in the sector. It was used as a consistent data set for calibrating a computable general-equilibrium (CGE) model to develop an integrated economic and environmental policy analysis for evaluating the effectiveness of Chinese environmental policies on pollution control and their impacts on the Chinese economy. Liang et al. (Citation2009) developed a static, multisector CGE calibrated over a 16-sector SAM-2002 with specific detail in energy use and CO2 emissions. Zhang et al. (2013) focused on taxation only: based on the 2007 SAM for Xinjiang, purposively constructed, take a regional perspective on China's resource tax reform to quantitatively calculate its degree of influence and qualitatively analyze its mechanism of influence by adopting an energy CGE model and an SAM price model. Fang et al. (Citation2016) developed an extended SAM of Jiangsu province, China, to simulate various scenarios by increasing discharge fee on water pollution and examine the impact of subsequent lighter pollution on the overall economy and individual industries. Wang et al. (Citation2016) tacked up on air pollution by employing the 2007 SAM for China to examine the direct and indirect CO2 emissions caused by urban and rural household expenditure. Liu and Wu, G. (Citation2017) used an SAM to identify the price impacts and transmitting paths among different economic sectors of imposing CO2, methane, and nitrous oxide emission taxes. Liu and Wu, F. (Citation2017) turned their attention to carbon price and forestry economy, elaborated a 2014 SAM for China to calibrate a forestry-based CGE model and simulated different carbon price scenarios to explore the effects of carbon subsidy and carbon taxation policies on the forestry economy. On the same line, Wang et al. (Citation2018) elaborated an SAM to calibrate a CGE model and assess the impact of energy taxation on economy, environmental and public health quality in Tianjin, China. Zhou et al. (Citation2017) linked the environment to the economy: in their study, a water resource embedded SAM was constructed for the Chinese Gaotai County to simulate the impact of different water scarcity policies on socio-economic development. Again, Li and Masui (Citation2018) elaborated an SAM on which a CGE model was calibrated with the objective of evaluating the social-economic features of China’s waste management activities in different sustainable scenarios. Ma et al. (Citation2018) used a purposively elaborated 2015 SAM for China (Ma et al., Citation2018) to conduct a comprehensive analysis of China’s economic system and to measure the effects of a VAT rate cut after the tax reform. Xiong and Li (Citation2019) used the ecological deficit in various regions of China as an unpaid input factor to elaborate a green SAM on which they calibrated a recursive dynamic CGE model used to analyse the effects of a tax policy on the compensation for the ecological deficit value.
Similarly, economy as a whole represented a fertile ground for the elaboration and use of SAMs for China. First, in temporal order, the SAM used by Li et al. (Citation2004) to analyse the characteristics of the Chinese industrial structure and income distribution. Then, the paper by Zhao and You (Citation2008), with its 2005 SAM for China-based impact multiplier model investigation of the impact of electricity price adjustment on the national economy represents the first use of an SAM of the XXI century in this perspective. The topic of prices will be then resumed by Zhang et al. (Citation2017), who using the 2012 SAM and the related CGE model, showed that increases in natural gas prices led to an increase in the consumer price index (CPI) and to reductions in GDP. Moving on investments, Sangda et al. (Citation2010) used a 2002 SAM for China to calibrate a static CGE model and simulate the economic effects and the efficiency of investment in transport infrastructure, whereas Wanhao et al. (Citation2011) elaborated a 2007 SAM for China and calibrated a CGE model to analyze the impact of large aircraft investment on national economy and other industries. More widely, it is interesting the 2007 SAM elaborated by Zhang and Diao (Citation2013) and used to assess the impact of the 2008-2009 global recession and the Chinese government’s stimulus policy on China’s economic growth.
Ou et al. (Citation2016) elaborated an 8-sector 2007 SAM on which a CGE model was calibrated to simulate the economic impact of hard and soft power shortage. Liu et al. (Citation2019) used an SAM multiplier model to analyse the economic effects of renewable and coal energy in China.
At a sub-national scale, SAMs were used as well for various purposes. Koike et al. (Citation2011) analysed the comprehensive impacts of water price reform in the Zhangye district of Gansu province by using an SAM-based CGE model. Deng et al. (Citation2011) used an SAM to calibrate a CGE model to simulate the structural changes of land use in Jiangxi Province during 2010 − 2020, whereas Qin (Citation2011) in his thesis dissertation elaborated a 2008 SAM for Beijing, Tianjin, and Hebei. Luo et al. (Citation2014), based on a CGE model calibrated on an SAM, carried out a study of the land use in Yunnan province during the period of 2008–2020. Wang et al. (Citation2016) dealt with the environmental theme in a fluvial-marine perspective to develop an integrated model by linking a regional SAM model to an ecological model to assess the implementation of ecosystem-based fisheries management in the Pearl River Estuary of the South China Sea. Xue et al. (Citation2019) constructed a two-region 2012 SAM with Beijing as one region, and the other region representing the rest of China to calculate the price transmission of each sector in Beijing when carbon pricing was implemented in Beijing or in the whole China.
Furthermore, SAMs have been constructed for a number of purposes. Zhai and Wang (Citation2002) focused on the rural-urban migration and the urban unemployment effects of China's WTO accession they evaluated through a 53-sector recursive dynamic CGE model for China benchmarked to the most recent version of the Chinese SAM. Cohen (Citation2002) conducted a 1990 SAMs for China and Russia based impact multiplier analysis to compare their economic growth in a crucial year for the two countries. Hou and Ju (Citation2007) based on SAMs for Beijing and other regions of China to calibrate a CGE model and simulate the degree of influence of Olympic Games on the economies of these areas. By using the 7 industry purposively elaborated 2002 financial SAM and the multiplier analysis, Li (Citation2008) shed light on the linkage between real side and financial side of Chinese economy. Tan et al. (Citation2009) used an SAM and the related CGE model to analyze the impact of economic policy on the demand for electricity in China. On specific topics, the SAM elaborated by Xie et al. (Citation2012) to undertake multiplier decomposition and structural path analysis and to analyze the influence on endogenous economy by the rise of exogenous demand for medical products and the macro SAM based on the forestry sector elaborated by Zeng and Shen (Citation2014). In the same above mentioned medical direction, the 2011 SAM extracted from the GTAP 9 database by Keogh-Brown et al. (Citation2016) and used to calibrate a CGE model to assess the impact of Alzheimer disease on Chinese economy. Jiang and Khan (Citation2017) used a 3 industry SAM to calibrate a CGE model and simulate the effect on industry of structural changes in industrial investment demand increase, industrial wage increase, exchange rate depreciation, and government spending increase.
Elaboration and use of SAMs for tourism analysis attracted almost no attention. Perhaps, Guo (Citation2002), who attempted to measure the economic impact of tourism in China using a 48 sector SAM, has accomplished the most important study. He calculated SAM multipliers, finding that although the government gave inbound tourism a priority, domestic tourism expenditure has a larger impact on Chinese economy, making the development of the latter more desirable.
A second research, due to Li and Lian (Citation2010), used a purposively elaborated tourism 2002 SAM for Jiangsu Province to measure the income of the tourism industries in the province. The 27 industries of this SAM were subdivided into two groups, the industries closely related with tourism activity (13), called tourism industries, and the remaining 14 called non-tourism industries. Then, the relative income distribution among the tourism industries and the non-tourism industries, as well as the income distribution between tourism industries and the urban residents at different income levels were quantitatively measured, finding that the tourism industries didn’t contribute significantly to the income of non-tourism industries, whereas brought more relative income to urban residents at high income levels.
These two SAM-based studies are very specific, focusing, the first one, on domestic tourism expenditure and not on production, and, the second one, on the income of the tourism industries of a Chinese province. Therefore, they do not provide at all any information about the importance of tourism industry within China’s economic structure and its contribution to the country’s economic growth. As a result, a comprehensive study of tourism industry within China’s economic system is still missing.
In this paper, we want just to fill this gap and measure:
the degree of interdependence of the tourism industry with the other industries, and, more widely, its degree of integration in the production sphere, and how much labour and capital income, that’s, how much value added/GDP, and household income it creates,
the direct and indirect multiplier impact on tourism industry and on the other industries, value added/GDP, household income and system’s final demand due to exogenous increases of tourism demand, and
the consequent effects on production activity, purchasing and sale policy and investment decisions of the enterprises, including the tourism ones, as well as the effects on government’s economic policy.
We will do this through a Keynesian theory based macro-accounting analysis carried out by using a 44 × 44, 2015 SAM for China with 19 industries and the properly adjusted impact multiplier model (Pyatt and Round, Citation1979). The definition of subjects and operations of the SAM is reported in of the appendix. The whole SAM is available on request. This SAM has been elaborated at the Shanxi University of Finance and Economics with the collaboration of the Department of Statistics of the University of Florence (Ma et al. Citation2018). It is based on a 2012 I-O table for China with 42 industries at producers’ prices (National Bureau of Statistics of China, Citation2016) and on the Flow of Funds Accounts (Physical Transactions) 2012 (National Bureau of Statistics of China, Citation2014).
Thus, in Section 2, after selecting endogenous and exogenous accounts in the SAM, we will design the impact multiplier model calibrated on them. In Section 3, we will proceed to an in-depth analysis of the relevance of the tourism industry and its interdependencies with the other industries, factors and households, to highlight its weight and degree of integration in the country's economic system, and the effects on tourism enterprise production and management. In Section 4, we shift the analysis to the activation level, by focusing on the impact of tourism on the economic structure and the stimulus it may give to enterprises and government investment and economic development decisions and to the country’s economic growth. In Section 5, we draw the conclusion.
2. The impact multiplier model
Having an SAM as the database, to design the impact multiplier model it is first necessary to identify in its structure the tourist sector. As is commonly recognized, this is represented by the ‘Hotel and Catering Services’ industry.
Impact multiplier analysis requires to look at industries, factors, institutional sectors, and operations as accounts and then to identify the endogenous accounts, i.e., the policy objectives, and the exogenous accounts, i.e., the policy instruments.
It is commonly agreed to define in an SAM the endogenous accounts as the following sets of accounts: (i) value of goods and services produced (industries), (ii) payment from factors (Gross Value Added (GVA), or more widely, GDP), and (iii) households’ income. As the exogenous accounts, the following sets of accounts are usually selected: (i) Public and private expenditure, (ii) capital accounts, and (iii) Rest of the World (RoW).
In our SAM, we selected the following endogenous accounts: (1) the 19 industries, (2) the GDP components (items 20 to 31), and (3) the household income (item 39), for a total of 32 accounts. As exogenous accounts we selected the following 12 accounts: (1) Household expenditure (item 32), (2) Government expenditure (item 33), (3) Capital transfers, (4) Gross fixed capital formation, (5) Changes in inventories, (6) Acquisition less disposal of non-financial assets, (7) Net lending (items 34 to 38), (8) Non-financial corporations, (9) Financial corporations, (10) General government, (11) RoW current account, and (12) RoW capital account (items 40 to 44). These 12 exogenous accounts have been aggregated into one account only labelled ‘Government’.
This arrangement is reported in and , where the two steps of the selection and aggregation are shown, which definitions are abbreviations of those reported in of the appendix.
Table 1. Endogenous-exogenous arrangement.
Table 2. Endogenous-exogenous arrangement.
In , Government (32 × 1) z vector represents the injection, that is, the exogenous expenditure account on endogenous accounts, (32 × 1) y vector, e.g., agricultural subsidies. Leakages (1 × 32) l vector represents endogenous expenditure accounts on exogenous account, e.g., taxes on income. Government vector total, zl, represents residual balances consisting of transfers between exogenous account, e.g., government savings.
Similarly to what we do in Input-Output tables, we write the balance equation, adjusted to account for the above endogenous-exogenous modelling, as follows:
(1)
(1)
where Y is the (32 × 1) vector of totals, y is the (32 × 1) vector of endogenous accounts totals, and z is the (32 × 1) vector of exogenous expenditure account on endogenous accounts (Bellù, Citation2012).
To represent the economic system by a system of simultaneous linear equations implies the following assumptions to hold: (i) absence of substitution between different inputs and factors for all productive sectors and between different final goods for all institutions); (ii) exogenous expenditure fully supplied by goods and services from the economic system, i.e., no constraints on the economic system in terms of productive capacity (hypothesis of surplus productive capacity); and (iii) prices of goods and services invariance because of the impact of changes on exogenous demand (hypothesis of fixed prices).
Let’s define the (32 × 32) A matrix of the endogenous accounts coefficients: A = After re-writing (1) accordingly:
the solution is achieved and the impact multiplier model is obtained:
(2)
(2)
where I is the identity matrix and M the impact multiplier matrix.
3. The relevance of tourism, its interdependencies/integration within China’s economic system, and the repercussions on enterprises
3.1. The relevance of tourism industry, its interdependencies and integration
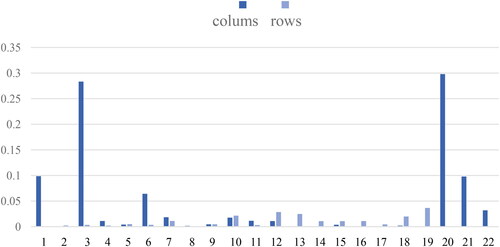
From the estimation of the matrix A of the endogenous accounts coefficients, we can obtain the column and row vectors concerning tourism, as reported in .
Table 3. Endogenous accounts coefficients.
Column vector Ai8, i = 1,…,32; 8 = Hotels and Catering Services of matrix A depicts production (i = 1,…,19), GDP components (i = 20,…,31) and household income (i = 32) costs of the tourism sector. This overall cost structure allows the evaluation of the degree of dependence of tourism on the other industries, that is, its integration within China’s productive structure, the composition of its value added, that is the share of labour and capital employed and remunerated, and of its GDP and that of the household income generated by tourism.
Row vector A8j, j = 1,…,32 of matrix A depicts tourism revenue from the other industries (j = 1,…,19), providing their degree of dependence/integration on tourism. Obviously, payments to tourism from GDP components and household income do not make sense, therefore cells j = 20,…,32 are empty.
From reading by column, it emerges that tourism’s production costs are basically directed towards ‘Manufacturing’ (coefficient equal to 0.2833). This strong dependence of tourism on manufacturing shows the link with an industry that, according to the NACE classification, (Eurostat, Citation2008), largely contains ‘Manufacture of food products’, which includes the processing of the products of agriculture, forestry and fishing into foods for humans and animals and the production of various intermediate products that are not directly food products. Therefore, this result is perfectly consistent with a strongly manufacturing-oriented country like China, with hotels and restaurants that typically represent a large share of both tourism and manufacturing sector.
With a lower but not negligible intensity, tourism’s production costs are due to the purchase of the inputs from several other industries, which makes a further in-depth analysis worthy.
In fact, ‘Agriculture, Forestry, Animal Husbandry and Fishery’ is a second industry, which, although at a minor extent, tourism production depends upon (coefficient 0.0985). This is a consistent result as well, because in the NACE classification, this sector includes ‘beneficiating of agriculture products’, a typical tourist activity that makes it a good tourism supplier. The same holds for ‘Wholesale and Retail Trade’, an industry which tourism is directly dependent on (coefficient 0.0642).
The coefficients of ‘Transport, Storage and Post’, ‘Financial Intermediation’, ‘Real Estate’, ‘Leasing and Business Services’ although not being high, are certainly in line with expectations. All of them are anyhow suppliers of inputs to tourism industry, confirming the overall degree of integration of tourism in the productive fabric.
From the point of view of the formation of value added, it should be stressed that tourism well remunerates the factors it uses, especially labour, which is compensated three times higher than capital (coefficient of ‘Compensation of Employees’ equal to 0.2981, versus endogenous coefficient of ‘Gross Operating Surplus’ equal to 0.0978).
Regarding household income, obviously the coefficient is zero, as the tourism industry production does not need any contribution from this sector.
While tourism takes much lot from many other industries, it does not provide them with as many outputs. A look at the row of tourism shows that ‘Public Management, etc.’, ‘Leasing and Business Services’, ‘Scientific Research, etc.’, ‘Financial Intermediation’, ‘Culture, Sports, etc.’, only slightly contribute to its earnings, whereas the other industries contribute nearly imperceptibly.
The overall good integration degree of tourism in the productive sphere, and its particular dependence on the three above industries, as well as its average good remuneration of labour and capital, including net taxes on production, in other words, of all the GDP components, can also be well assessed visually from the graphic representation in .
Figure 1. Endogenous accounts coefficients.
Source: the authors.
3.2. The repercussions on the production activity and management of tourism enterprises
The framework of interdependencies highlighted by the analysis conducted has operational repercussions on the production processes, on the purchasing of raw materials and on the sale of services of the Chinese tourism enterprises.
To know that their production cost structure strongly depends on the manufacturing industry, as well as on agriculture and wholesale and retail trade industries, is a crucial factor in helping and advising them to properly address their decisions regarding the choice of the production processes of their services and of the purchase of the most suitable raw materials. This way, they can minimize costs and maximize profit. Indeed, it is evident that these enterprises will try to adjust their production techniques to the use of inputs from manufacturing and agriculture industries and to adopt purchasing and transport tools consistent and compatible with them. Furthermore, knowing that they are also dependent on trade, they will suitably calibrate their commercial structures for the purchase of raw materials and the sale of their services, which will allow minimizing production costs, and ultimately to set up an overall purchasing and sale policy.
It is equally evident that the confirmation of the labour intensive nature of the tourism industry will allow tourism enterprises to focus better on the most appropriate remuneration policy and effectively pursue a suitable equilibrium in the relations with their employees, also leveraging on the strong contribution to households income, thus dampening possible social conflicts. Furthermore, the finding that the demand for intermediate tourism services by other industries is on average rather weak may suggest to tourism enterprises to better balance their production processes, strongly directing them to the satisfaction of the final demand.
4. The direct and indirect multiplier impact of tourism on the China’s economic system and on its growth
4.1. The contribution of tourism to the country’s economic system
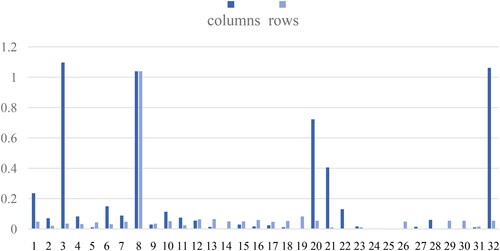
Let us now analyse the estimates of the column and row coefficient vectors, Mi8 and M8j, of the M inverse impact multiplier matrix in formula (2), reported in .
Table 4. Impact multiplier coefficients.
They provide the increase of endogenous account i that is attributable to a unitary increase of exogenous demand for tourism and the increase of tourist services production attributable to a unitary increase of exogenous demand for endogenous account j, respectively. Indeed, each impact multiplier of vector Mi8 can be interpreted as the partial derivative, of
with respect to
and each impact multiplier of vector M8j as the partial derivative,
of
with respect to
The reading of column Mi8 highlights that the exogenous demand for tourist services records by far its greatest indirect multiplier impact on ‘Manufacturing’, which reacts more than proportionally: a unitary increase in the demand for tourism has a strong multiplier effect as it increases manufacturing production by 1,097: in percentage terms, by about 110%.
This is a somewhat expected result, which confirms from the activation point of view the above highlighted high degree of dependence of tourism on manufacturing industry.
The exogenous demand for tourist services greatly multiplies also ‘Agriculture, Forestry, Animal Husbandry and Fishery’, which increases its production by slightly less than 24%. There are other industries that are indirectly multiplied by a unitary increase in exogenous tourist demand: the production of ‘Wholesale and Retail Trade’ industry increases by about 15% and that of ‘Financial Intermediation’ by 11%. Then, there is another couple of industries, that is, ‘Production and Supply of Electricity, Heat, Gas and Water’, and ‘Transport, Storage and Post’ that indirectly multiply production by around 8-9%. ‘Real Estate’ and ‘Mining’ industries productions multiply by about 7%, while there are significant impacts, averaging around 2-2.5% up to a peak of 5% on all other industries. Finally, the tourism itself is directly and indirectly multiplied by nearly 104%, the indirect impact of 4% being perfectly consistent with the feature of tourism of not activating large indirect return effects. By and large, evidence states that the whole production system, although with remarkable differences among industries, is multiplied directly and indirectly.
Unitary increases of endogenous demand for tourist services have a large multiplier impact on factors also: labour income increases by about 72%, a high figure very consistent with the labour-intensive vocation of tourism, whereas capital income increases by about 40%.
Finally, it should be stressed the high impact on ‘Household Income’ which increases by a generous 106%.
A look at row M8j shows that the activation of the production of tourist services deriving from a unitary increase in exogenous demand on each of the other industries is smaller, although quite significant, averaging around 4-5% with a low variability across all industries. Labour income and household income activate tourism similarly, whereas capital income does it quite insignificantly. In fact, it is consistent that increases of remunerations to workers and of household income do stimulate tourist services production: the more well-being, the more demand for tourism. Likewise, it is consistent that capital increases do it in a nearly imperceptible way: given the labour-intensive nature of the sector, capital increases only fairly limited and slowly turn into investments in tourism.
In , the direct and indirect impact of the exogenous demand for tourist services on China’s tourism industry is clearly visible, as well as the indirect impact greater than 1 on manufacturing and household income, besides the high impact on value added components.
Figure 2. Impact multiplier coefficients.
Source: the authors.
4.2. The impact on final demand of a government policy of tourism demand stimulation
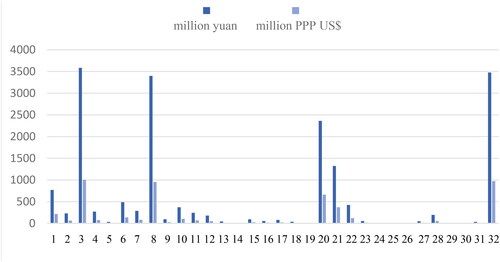
Let us now shift to the final demand and assume a government stimulation policy of tourism services exogenous demand that leads to the objective of a 6% annual rate of increase. This objective is consistent with the path of the exogenous demand for tourist services in China, which is growing at an annual rate that one might quantify around 5-6% (Travel China Guide, Citation2018).
After adjusting the cell of the demand for tourism in the exogenous expenditure account vector, z, to take account of this increase, re-estimating matrix M accordingly, the vector of final demand (Y vector in formula (2)) resulting from this shock and the consequent increases on final demand for industry products, on factors remuneration and on household income in million yuan and in million PPP US$are shown respectively in columns (2), (3) and (4) of .
Table 5. Final demand and final demand increase due to 6% shock in exogenous demand for tourism.
As was to be expected, the highest indirect impact is on ‘Manufacturing’, which sees the demand for its products to increase by 3,584.4 million yuan (or 1,004.0 million PPP US$).
The second indirectly impacted industry is ‘Agriculture, Forestry, Animal Husbandry and Fishery’, with a demand for its products that increases by nearly 770 million yuan (216 million PPP US$). Then, ‘Wholesale and Retail Trade’, which increases by 488 million yuan (136 million PPP US$). Again, to follow: ‘Financial Intermediation’ with nearly 371 million yuan (104 million PPP US$), ‘Transport, Storage and Post’ with 288 million yuan (81 million PPPUS$), ‘Production and Supply of Electricity, Heating, etc.’, with 270 million yuan (76 million PPP US$), ‘Real Estate’, with 244 million yuan (68 million PPP US$), ‘Mining’, with 229 million yuan (64 million PPP US$).
All the other industries record lower values, ranging from 8 to 179 million yuan (2 to 50 PPP US$), and averaging about 65 million yuan (18 PPP US$). Last but not least, 3,400 million yuan (952 million PPP US$) increase recorded by tourism itself as direct and indirect impacts.
Passing to factors, the income to labour increases by 2,362 million yuan (662 million PPP US$), whereas the income to capital increases by 1,322 million yuan (370 million PPP US$).
Finally, income to households increases by 3,476 million yuan (974 million PPP US$).
Some increases are relevant, other less, although noteworthy. The overall final demand increase accounts for 18,199 million yuan (5,500 million PPP US$), that is, 0.6‰.
For their suitable complementary visual perception, the above increases are represented in .
Figure 3. Final demand increase.
Source: the authors.
4.3. The implications on enterprises and government policy
The findings of the contribution of tourism exogenous demand on the country’s economic system and its growth represent for enterprises a basis for the technological improvements of their production processes and for a balanced and aware investment policy, and a tool for government’s economic policy.
In fact, based on them, manufacturing enterprises will be encouraged to strengthen investments in manufacture of food products to consistently respond to these stimuli. The same holds, even though at a lower extent, for agriculture enterprises and trade enterprises, which will be urged to invest to be ready to face tourism demand increases. Financial intermediation and transports enterprises will also be encouraged to invest to remodel their activity. Of course, tourism enterprises too will be strongly involved and massively invest.
On the other hand, the not strong, uniform reaction by the production of tourist services to the exogenous demand of the enterprises of each of the other industries, as well as that by wages and household income, advise tourism enterprises an undifferentiated production policy and non-selective market penetration.
This holds even more for the economic policy decisions of the government, which has a reliable tool to assess a tourism demand targeted to boost or discourage the production of the enterprises, as well as to set up policies for supporting wages and household income. Thus, for example, the government will be able to choose the most appropriate times and ways to implement selective tourism demand boosting policies, knowing that these will influence the above-mentioned enterprises to a greater extent than the others, thus achieving, within the general framework of the economic development planned, an efficient and effective economic growth of the country.
To this aim, government can also take advantage of the knowledge of the increase in the final demand for industrial products, factors and household income due to a shock on the exogenous demand for tourism.
5. Conclusion
This research, designed to measure the impact of tourism industry on China’s economy and its growth, is largely innovative as based on a new comprehensive theoretical, methodological approach, leading to an applied analysis that provided economically significant results, never achieved until now.
Indeed, this is the first time that a study on tourism in China is performed to check the positioning of this sector inside the economic system, in the framework of the Keynesian theory, using for the applied analysis an SAM as the database and the impact multiplier model adjusted to the chosen endogenous and exogenous accounts as the methodology.
Tourism industry turns out to be well integrated into the overall economic fabric; its interdependencies spread within the economic system make it a remarkable pillar of the productive activity, including raw material purchases and product sales, as well as of value added/GDP creation and ultimately, of wealth, possibly allowing tourism enterprises to also perform a function of social balance.
Above all, its strong links with manufacturing, agricultural and trade industries, and the resulting opportunities of production improvements that occur to the enterprises belonging to these sectors, which are crucial for China’s economy, make tourism a driving force for the country's productive system.
On the other hand, tourism exogenous demand heavily impacts on this picture of productive dynamism hinged on tourism industry, particularly regarding manufacturing, agriculture, trade, financial intermediation, transports, and tourism: their elastic reaction to its stimulus makes worthy for their enterprises to invest for technological improvements to adequately respond.
Tourism demand also greatly activates value added/GDP production, as well as household income, thus confirming tourism as a wealth feeder as well.
These are all results of a great informative content and importance for private and public policy makers, never obtained and released until now. They represent a solid basis for the preparation of an adequate industrial policy for tourism and of a targeted country’s economic growth, in a balanced framework of modernization of the overall productive sector, giving the measure of the relevant role played by tourism and of its great prospects and increasing impact on China’s economic growth of the years to come.
As pointed out repeatedly in the paper, underlining its characteristics of originality, this research is the first of its kind carried out. There is therefore no possibility of making a comparison between the results we obtained and the relevance of their implications and those of other studies. However, a comparison can be made between what emerges in our analysis in terms of the importance of the productive structure, factors and households’ income and their activation, with what springs from the work by Li et al. (Citation2004). They analyze the influence of the exogenous demand for restaurants on agriculture and construction on mining through paths in transmitting influence: their structural and the impact importance is very similar to that emerging from our study. Furthermore, the key role, underlined in our work, of the manufacturing industry and its strong impact on the labour factor and on the creation of additional jobs is confirmed, as well as the strong capital-intensive connotation of trade and the importance of food and transports on households income.
Just because its strong characteristics of originality and innovation, this research has some limits. The first and perhaps most evident is the fact that, based on an SAM, it was possible to use the Hotels & Restaurants industry only, and no other tourist services such as tourist agencies, tour operators, farmhouses, tourist transports and others. Furthermore, the possibility of creating additional jobs and their qualitative and quantitative characteristics, as well as their weight in the general working framework are aspects that the analysis does not grasp and that deserve to be investigated. Last but not least, no reference is made to the environmental problem, while the crucial importance of tourism environmental sustainability is now unanimously recognized.
It is on these issues that the present research will have to linger, focusing on an enlargement of the SAM and of its environmental extension and on the development of the impact multiplier model that allows measuring the transmission mechanisms of activation through a breakdown of the multipliers or path analysis models and the environmental implications.
Notes
1 This review extends the one made in Ma et al. (Citation2020), where there was the sole goal of showing and discussing the state of art of the SAMs for China elaborated for the analysis of the impact of a tax intervention on the overall economic system.
References
- Bellù, L. G. (2012). Social accounting matrix (SAM) for analysing agricultural and rural development policies. Conceptual Aspects and Examples, ANALYTICAL TOOLS. EASYPol MODULE 130. FAO, E-ISSN 2219-9497, 1–19.
- Cohen, S. I. (2002). Growth and distribution in Russia and China: A social accounting matrix analysis. International Advances in Economic Research, 8(4), 296–304. https://doi.org/10.1007/BF02295504
- Deng, X., Yin, F., Lin, Y., Jin, Q., & Qu, R. (2011). Equilibrium analyses on structural changes of land uses in Jiangxi Province. Journal of Food, Agriculture and Environment, 1, 846–852.
- Eurostat (2008). (). Nace Rev.2. Statistical classification of economic actovities in the European Community. Metodologies and Working Papers. Luxembourg.
- Fang, G., Wang, T., Si, X., Wen, X., & Liu, Y. (2016). Discharge fee policy analysis: A computable general equilibrium (CGE) model of water resources and water environments. Water, 8(9), 413. https://doi.org/10.3390/w8090413
- Guo, S. (2002). Measuring the economic impact of tourism in China. Forum of International Development Studies, 21, 67–94.
- Hou, Y.-P., Ju, X.-F. (2007). The study on the influence channel and the degree of impact of Olympic economy of Beijing. Proceedings of 2006 International Conference on Management Science and Engineering, ICMSE'06 (13th), 1145–1150.
- Jiang, X., & Khan, H. A. (2017). Structural Change and Energy Use in China: A SAM-based CGE Analysis. The Chinese Economy, 50(6), 405–427. https://doi.org/10.1080/10971475.2017.1380021
- Keogh-Brown, M. R., Jensen, H. T., Arrighi, H. M., & Smith, R. D. (2016). The impact of Alzheimer’s disease on the chinese economy. EBioMedicine, 4, 184–190. February. https://doi.org/10.1016/j.ebiom.2015.12.019
- Koike, A., Xu, Z., Wang, K., & Itoga, B. (2011). Impact analysis of water price reform of Zhangye. International Journal of Geomate, 2, 122–129.
- Leung, D., Li, G., Fong, L. H. N., Law, R., & Lo, A. (2014). Current state of China tourism research. Current Issues in Tourism, 17(8), 679–704. https://doi.org/10.1080/13683500.2013.804497
- Liang, Q.-M., Fan, Y., & Wei, Y.-M. (2009). The effect of energy end-use efficiency improvement on China's energy use and CO2 emissions: A CGE model-based analysis. Energy Efficiency, 2(3), 243–262. https://doi.org/10.1007/s12053-009-9043-0
- Li, G., & Masui, T. (2018). Assessing China's waste management activities using a computable general equilibrium model. Chemical Engineering Transactions, 63, 67–72.
- Li, J. ( (2008). ). The financial social accounting matrix for China, 2002, and its application to a multiplier analysis. Forum of International Development Studies, MPRA paper No. 8174, 6, 215–239. http://mpra.ub.uni-muenchen.de/8174/
- Li, S., Gao, Y., & He, J. (2004). SAM-based multiplier analysis for China’s Economy, Paper prepared for the XIIINFORUM World Conference, Marina di Ascea-Velia, Italy September.
- Li, J., & Lian, C. (2010). An empirical study on relative income determination of tourism industries with social accounting matrix of Jangsu Province, China in 2002. Tourism and Hospitality Research, 10(3), 219–233. https://doi.org/10.1057/thr.2010.6
- Liu, J., & Wu, F. (2017). Forest carbon sequestration subsidy and carbon tax as part of China’s forestry policies. Forests, 8(3), 58. https://doi.org/10.3390/f8030058
- Liu, J., Li, J., & Yao, X. (2019). The economic effects of the development of the renewable energy industry in China. Energies, 12(9), 1808. https://doi.org/10.3390/en12091808
- Liu, L.-C., & Wu, G. (2017). The effects of carbon dioxide, methane and nitrous oxide emission taxes: An empirical study in China. Journal of Cleaner Production, 142, 1044–1054. https://doi.org/10.1016/j.jclepro.2016.08.011
- Luo, J., Zhan, J., Lin, Y., & Zhao, C. (2014). An equilibrium analysis of the land use structure in the Yunnan Province, China. Frontiers of Earth Science, 8(3), 393–404. https://doi.org/10.1007/s11707-014-0425-z
- Ma, K., Mi, Z., & Ferrari, G. (2018). A SAM for China 2015. NA WorkingPaper N. 6. Shanxi University of Finance and Economics.
- Ma, K., Ferrari, G., & Mi, Z. (2020). SAM based analysis of China’s economic system and measurement of the effects of a VAT rate cut after tax reform. National Accounting Review, 2(1), 26–52. . https://doi.org/10.3934/NAR.2020002
- National Bureau of Statistics of China. (2014). China statistical yearbook: The flow of funds tables 2012.
- National Bureau of Statistics of China. (2016). China statistical yearbook: input-output table for China 2012.
- National Bureau of Statistics of China. (2018). China statistical yearbook.
- Ou, P., Huang, R., & Yao, X. (2016). Economic impacts of power shortage. Sustainability ( Sustainability), 8(7), 687. https://doi.org/10.3390/su8070687
- Pyatt, G., & Round, J. I. (1979). Accounting and fixed price multipliers in a SAM framework. The Economic Journal, 89(356), 850–873.
- Qin, C. (2011). Mitigating China’s water scarcity and pollution: environmental and economic accounting, modelling and policy analysis. ITC Dissertation. University of Twente.
- Sangda, Z., Feng, S., & Zhang, X. (2010). Efficiency assessment of transport infrastructure investment within a CGE framework [Paper presentation]. IET Conference Publications, 573, 245–250.
- Tan, X., Hu, Z., Shan, B., & Li, M. (2009). Study on electric policy modeling based on CGE. Kybernetes, 38(3/4), 497–505. https://doi.org/10.1108/03684920910944218
- Travel China Guide (2018). China Tourism: Statistics and Data of 2007 to 2018. Beijing. https://www.travelchinaguide.com/tourism/
- Wang, B., Liu, B., Niu, H., Liu, J., & Yao, S. (2018). Impact of energy taxation on economy, environmental and public health quality. Journal of Environmental Management, 206, 85–92. https://doi.org/10.1016/j.jenvman.2017.10.030
- Wang, Q., Liang, Q.-M., Wang, B., & Zhong, F.-X. (2016). Impact of household expenditures on CO2 emissions in China: Income-determined or lifestyle-driven? Natural Hazards, 84(S1), 353–379. https://doi.org/10.1007/s11069-015-2067-1
- Wang, Y., Hu, J., Pan, H., Li, S., & Failler, P. (2016). An integrated model for marine fishery management in the Pearl River Estuary: Linking socio-economic systems and ecosystems. Marine Policy, 64, 135–147. https://doi.org/10.1016/j.marpol.2015.11.014
- Wanhao, D., Lanjuan, L., Jihui, S., & Jun, W. (2011). The impact of large aircraft investment on national economy and other industries: A CGE based analysis [Paper presentation]. 2011 International Conference on E-Business and E-Government, ICEE2011 – Proceedings, 8424–8427.
- Wen, J. (2001). Tourism and China's Development: Policies, regional economic growth and ecotourism. NJ World Scientific Publishing Co.
- World Bank. (2018). International Comparison Program (ICP).
- World Economic Forum. (2017). The travel and tourism competitive report 2017. Geneva.
- Xiao, H. (2006). The discourse of power: Deng Xiaoping and tourism development in China. Tourism Management, 27(5), 803–814. (https://doi.org/10.1016/j.tourman.2005.05.014
- Xie, J. (2000). An environmentally extended social accounting matrix. Environmental and Resource Economics, 4, 391–406.
- Xie, J., & Saltzman, S. (2000). Environmental policy analysis: An environmental computable general equilibrium approach of developing countries. Journal of Policy Modeling, 22(4), 453–489. https://doi.org/10.1016/S0161-8938(97)00076-8
- Xie, W., Li, N., Ji, Z., Wu, J. (2012). Spatial and economic impacts analysis of an emergency event. Proceedings – 2012 6th International Conference on New Trends in Information Science, Service Science and Data Mining (NISS, ICMIA and NASNIT) (ISSDM 2012), Taipei, Taiwan, 254–259.
- Xiong, Z., &Li, H. (2019). Ecological deficit tax: A tax design and simulation of compensation for ecosystem service value based on ecological footprint in China. Journal of Cleaner Production, 230, 1128–1137. https://doi.org/10.1016/j.jclepro.2019.05.172
- Xue, M.-M., Liang, Q.-M., & Wang, C. (2019). Price transmission mechanism and socio-economic effect of carbon pricing in Beijing: A two-region social accounting matrix analysis. Journal of Cleaner Production, 211, 134–145.
- Zhai, F., & Wang, Z. (2002). WTO accession, rural labor migration and urban unemployment in China. Urban Studies, 39(12), 2199–2217. https://doi.org/10.1080/0042098022000033827
- Zhang, Y., Diao, X. (2013). A 2007 social accounting matrix for China. http://hdl.handle.net/1902.1/21132. International Food Policy Research Institute [Distributor] V2 [Version]. Beijing.
- Zhang, W., Yang, J., Zhang, Z., & Shackman, J. D. (2017). Natural gas price effects in China based on the CGE model. Journal of Cleaner Production, 147, 497–505. https://doi.org/10.1016/j.jclepro.2017.01.109
- Zhao, H.-R., You, P.-P. (2008). The impact of electricity price adjustment on national economy based on SAM multiplier analysis. Proceedings of International Conference on Risk Management and Engineering Management, 339–343.
- Zeng, C., & Shen, Y. (2014). Construction of China’s macro social accounting matrix based on the forestry sector. Journal of Beijing Forestry University, 70–74. www.cnki.com.cn
- Zhou, Q., Deng, X., & Wu, F. (2017). Impacts of water scarcity on socio-economic development: A case study of Gaotai County. China. Physics and Chemistry of the Earth, 101, 204–213. https://doi.org/10.1016/j.pce.2017.03.009
Appendix
Table A1. Definition of subjects and operations of the 19 industry, 44x44 2005 SAM for China.