
 ?Mathematical formulae have been encoded as MathML and are displayed in this HTML version using MathJax in order to improve their display. Uncheck the box to turn MathJax off. This feature requires Javascript. Click on a formula to zoom.
Abstract
Governments around the world have responded to the COVID-19 outbreak with a mix of policies. The strictest responses of the New Zealand government are notable, given their abilities to contain and limit the spread of the virus. However, their impacts on stock returns remain unclear. This paper investigates the impact of three policies, namely lockdown, the stimulus package, and the travel ban, on the returns of 14 New Zealand industry stock indices. Using daily data from 1 January 2019 to 25 August 2020, evidence points to a heightened level of integration among the various industry stock indices during the early stages of the pandemic. Only lockdown has had a positive impact on aggregate stock returns, suggesting its ability to raise investors’ confidence in the overall stock market. At the industry level, the impact of the three response policies is generally positive but heterogeneous across industry stock indices. Notably, none of the three adopted policies significantly impact technology, healthcare, and real estate returns.
1. Introduction
The COVID-19 outbreak was a seismic health shock that ravaged human lives and provoked tremendous fear on a societal level. As of mid-August 2020, the total death toll from COVID-19 exceeded 850,000, and the number of confirmed cases reached 30 million. Most governments across the globe were unprepared for such a pandemic. However, they managed to respond by designing and implementing a mix of measures and policies that were frequently eased or tightened according to the virus’s speed of containment or sweep. While the responses seeking to slow down the spread of COVID-19 differ in their severity and nature across countries and regions, they generally cover health measures related to early case-detection, extensive testing, contact-tracing strategies, and isolation, as well as other measures and policies (e.g. social distancing, border control, lockdown). In addition to its devastating effects on human life, COVID-19 abruptly emerged as a systemic risk that shapes global economic activities in their various sectors (Baker et al., Citation2020). Its rapid spread across the globe has led to a global rout of financial markets (Rizvi et al., Citation2020). In fact, COVID-19 has triggered business closures and a reduction in the workforce. For example, industrial production decreased by almost 20% on average in more than 90% of countries.Footnote1 Many countries have experienced direct economic costs due to lockdowns and indirect economic costs arising from value chain disruptions. The decrease in the global demand for goods and services has led the global economy into a severe recession of a magnitude not seen since the Great Depression. Accordingly, economic support packages and stimulus (e.g., income support and tax relief) have been adopted to lessen the adverse economic effects of COVID-19 on society.
New Zealand’s battle against COVID-19 is considered one of the most successful among the 37 countries of the Organization for Economic Cooperation and Development (OECD) (Mazey & Richardson, Citation2020). It has so far managed to substantially decelerate the pace of coronavirus transmission among its residentsFootnote2. Based on statistics from the New Zealand Ministry of Health, as of the end of August 2020, the number of confirmed COVID-19 cases (1,397) and deaths due to COVID-19 (22) remained the lowest among the 37 OECD countriesFootnote3. This nation of five million people joined prime minister Jacinda Ardern as a harmonised team to combat COVID-19, which has intensified public confidence and devotion in applying onerous restriction measures that ultimately resulted in effective contamination of the virus, including a period of 102 days with no infections or community transmission from 1 May 2020 to 10 August 2020Footnote4. To confront the pandemic and keep its citizens safe as well as cope with its adverse economic costs, New Zealand’s government adopted three main response policies (lockdown, a stimulus package, and a travel ban). Notably, lockdown and the travel ban have undoubtedly induced negative economic effects that were remedied by the government’s stimulus program to support businesses and unemployed staff.
On the stock market level, COVID-19 has provoked a spike in the level of uncertainty, and equity prices dropped. Over the period 24 February 2020 to 23 March 2020, New Zealand’s major equity index, the NZ50 index, declined by 30%. At the disaggregated level, equity indices exhibited losses, especially financial, industrial, and airline and travel stocks. In the financial sector, non-performing loans increased substantially during the COVID-19 crisis. Many individuals and corporations struggled to obtain cash and pay debt services, which was coupled with a low-interest-rate environment that ultimately squeezed corporate profit margins and corporate earnings and, thereby, the stock prices of financial companies. In the travel and leisure industry, spending has been considerably hit by the lockdown measures and travel ban, which weakens the performance of this industry. As for consumer staple companies, they were more resistant to the pandemic, and some survival supplies showed positive purchase upticks. Ultimately, the impacts vary depending on how the restraint and control measures affect firms and sectors. For example, the factors that could shape the degree of impact on firms and thereby sectors and industries include the production capacity of the firm, its level of integration in local and international production networks, and the nature of the market that they serve (i.e. domestically oriented or concentrated on export/import). Based on those factors, some firms and sectors were better positioned to rapidly respond to the challenges and uncertainty arising from COVID-19 by adapting their operations to lessen the adverse effect of the pandemic on their activities. By late August 2020, the NZ50 managed to recover most of its losses as it seemed that the implementation of the governmental response policies succeeded in re-establishing investor confidence. However, the industry equity indices exhibit heterogenous performances.
There has been an increase in literature dealing with COVID-19 and governmental policies. However, it mostly focuses on the effectiveness of contamination measures in reducing the number of COVID-19 cases and casualties (Carraro et al., Citation2020; Dergiades et al., Citation2020), the price reaction and performance of equity funds during the pandemic while considering their level of higher human capital efficiency (Mirza et al., Citation2020a, Citation2020b; Yarovaya et al., Citation2021), and the variation in government responses across countries (Greer et al., Citation2020; Hale et al., Citation2020). Policies and measures regarding social distancing and closing borders are shown to be effective tools to stop the virus from spreading (Phan & Narayan, Citation2020). They have been appreciated in New Zealand (Mazey & Richardson, Citation2020). However, it is not clear how the various government policies related to COVID-19 have affected New Zealand’s industry stock returns.
Considering the above discussion and motivated by the New Zealand particularity and the lack of related empirical studies, the purpose of this paper is to examine the effects of governmental response policies (lockdown, the stimulus package, and the travel ban) to COVID-19 on aggregate and industry stock returns in New Zealand. For this purpose, we first model the dynamic conditional correlation among the 14 industry stock returns using the DECO-GARCH model (Engle & Kelly, Citation2012) and then use a multiple regression framework (Narayan et al., Citation2021) to assess the effects of three policies on stock returns and equi-correlation while considering several control variables. By using daily data for the period of 1 January 2019 to 25 August 2020, the early stages of the COVID-19 outbreak, we find evidence of a heightened level of integration among the various industry stock indices. Further analysis unfolds that only lockdown has had a positive impact on aggregate stock returns, suggesting its ability to raise investors’ confidence in the overall stock market. At industry level, the impact of the three response policies is generally positive but heterogeneous across industry stock indices. Notably, none of the three adopted policies significantly impact technology, healthcare, and real estate returns.
Under the seismic health shock and the systemic market risk, our above analysis is informative to understand how the three adopted governmental policies have impacted New Zealand’s stock market returns at both aggregate and industry levels. This is crucial not only because the stock market is a barometer of the economy but because such understanding helps governments in drawing lessons regarding optimal and anticipatory policymaking at the industry level during severe health crises such as the COVID-19’s. This also allows investors and portfolio managers to make a more refined portfolio diversification and risk management decisions, given their tendency to engage in switching activities across the various industry stock indicesFootnote5. Accordingly, uncovering the effects of the governmental policies on industry stock returns would make investors and portfolio managers more informed about the factors that shape equity returns. These will ultimately help optimise decision-making regarding price discovery and portfolio diversification during the COVID-19 outbreak.
Our contribution to the academic literature concerns several fronts. First, our current study adds to previous studies (e.g. Phylaktis & Xia, Citation2009; Dungey & Gajurel, Citation2014) that show an increase in the level of integration among industry stock returns during times of crisis. For example, Phylaktis and Xia (Citation2009) indicate strong comovement among industry stock returns in Europe, Asia, and Latin America and highlight the industry stock heterogeneity of comovement. Secondly, our paper extends the analysis of Mazey and Richardson (Citation2020), which appreciates the effectiveness of anticipatory policy making in New Zealand but disregards the effects of the government’s response to COVID-19 on aggregate and industry stock returns. Few studies (Phan and Narayan, 202; Rababah et al., Citation2020) consider the COVID-19 outbreak and the aggregate stock market data, ignoring the heterogeneity in the effects across industry stock returns in the particular context of New Zealand. Third, our paper expands the literature dealing with the factors driving the returns and affecting the stability of stock markets during stress periods (Bhargava et al., Citation2012). In this regard, our analyses show that the effects of various governmental policies differ according to the type of policies. Their effects are not the same across industries, which ultimately highlights the importance of industry (or sector) factor risks in portfolio management (Arouri et al., Citation2011; Balli et al., Citation2020).
The rest of the paper covers a review of the related studies (Section 2), a description of the dataset and methods (Section 3), a presentation and discussion of empirical results (Section 4), and some concluding remarks (Section 5).
2. Literature review
Our current study draws from two strands of literature: (1) equity industry integration and (2) factors and policies affecting stock returns, including those related to the COVID-19 outbreak.
2.1. Equity industry integration
Equity market integration is an attractive research area that has been broadly examined, with a particular focus on its sectoral space. Carrieri et al. (Citation2004) consider G7 stock indices at the sectoral levels within a conditional asset pricing framework. They show that global industry risk is not priced for all industries and provide evidence of industry-level segmentation. Berben and Jansen (Citation2005) assess market integration in Japan, Germany, the UK, and the US and reveal evidence of intensified correlations across countries and sectors. Phylaktis and Xia (Citation2009) focus on equity market linkages at the sectoral level in Europe, Asia, and Latin America. Using an asset pricing framework, they support the sector heterogeneity of contagion and highlight the possibility of exploiting portfolio diversification. Choudhry and Osoble (Citation2015) study the dynamic linkages between industry stock returns of the US and large emerging markets. They show heightened linkages at the time of market turbulence and provide evidence of potential diversification benefits at the industry level. Our current study is related to this strand, although our focus is different as it considers equity industry integration in the understudied and small open economy of New Zealand that has a higher degree of trade and financial openness under the unprecedented COVID-19 risk.
2.2. Governmental policies in response to COVID-19 and stock returns
The main focus of our study is to assess how government policies adopted in response to COVID-19 have affected industry stock returns in New Zealand. According to Baker et al. (Citation2020), the abrupt emergence of COVID-19 has led to a spike in the level of global economic uncertainty. Some studies focus on the COVID-19 outbreak and financial markets. They examine safe-haven assets (Gupta et al., Citation2021), market uncertainty and return connectedness (Bouri et al., Citation2020, Citation2021; Naeem et al., Citation2021a), and market efficiency (Aslam et al., Citation2020; Naeem et al., Citation2021b). Phan and Narayan (Citation2020) focus on the link between COVID-19 deaths and stock market returns in 25 countries. They highlight the overreaction and market correction by showing that the reaction of the stock market returns was negative at the early stages of the COVID-19 outbreak, but mostly became positive with time, suggesting a market correction. Mirza et al. (Citation2020c) focus on the effect of the pandemic on EU corporate solvency and provide some policy responses. They show that firm solvency deteriorates during the pandemic and that manufacturing, mining, and retail sectors are very vulnerable to a decrease in market capitalisation and a fall in sales revenues. Our current paper is different in several aspects. First, the existing literature generally overlooks the effects of policies adopted by governments in response to COVID-19 on stock market returns, especially at the industry stock returns. Instead, previous studies (e.g., Rababah et al., Citation2020) apply an event study to uncover the effect of the COVID-19 outbreak on stock sector returns in China. Shahzad et al. (Citation2021a, Citation2021b) indicate evidence of heterogeneity in the pandemic effect on the performance of the American and Chinese equity sectors and their relationships. Secondly, our current study addresses a research gap that involves the context of New Zealand and considers the heterogeneity of the industry stock returns. In the context of New Zealand, Mazey and Richardson (Citation2020) draw lessons from the New Zealand response to COVID-19 while highlighting the necessity for anticipatory policy formulation. Balli et al. (Citation2020) study returns and volatility transmission from local and global economic policy uncertainties (EPU) and sectoral stock indices. They point to how the responsiveness of some industry returns to both local and global EPU is closely related to whether the sector is domestically oriented or is dependent on export/import. Our current study is one of the first to uncover the effects of the various government policies related to COVID-19 on industry stock returns in New Zealand.
3. Research design
3.1. Data description
We use daily data for the period of 1 January 2019 to 25 August 2020 to investigate the reaction of various New Zealand industries to the government’s response to the COVID-19 crisis. New Zealand’s government, like many others around the world, adopted a number of policies to manage the crisis caused by COVID-19. Such policies include restrictions on the domestic movement of people or lockdown, an economic response by offering stimulus packages such as wage subsidy, and the closure of international borders or a travel ban.
We select New Zealand as the appropriate lens for understanding the impact of government policies to eradicate COVID-19 and industry reaction because New Zealand remained community transmission-free for 102 days, which is the longest period any country remained community transmission-free before the emergence of the second wave. New Zealand’s early action to implement lockdown and border closure, which the Prime Minister termed ‘go early and go hard’, has been acclaimed globally as the ‘role-model’ strategy for managing the spread of the virus. The World Health Organization (WHO) also praised it on their websiteFootnote6. New Zealand adopted one of the strictest lockdown strategies when only a few COVID-19 cases started to emerge; some other countries with denser populations and higher numbers of confirmed cases remained in far less strict lockdowns. New Zealand was able to relax its lockdown (move down from level 4 to level 3) within only five weeks. Therefore, implementing lockdown early, with only a few cases, led to an early opening of their economy, where it could operate without any restrictions. However, such a strict measure has been criticised by the country’s political party opposition as well as an Australian economics journalist, who stated that such strategy took a sledgehammer to New Zealand’s economyFootnote7. Although New Zealand succeeded in controlling the virus, the impact of such government initiatives on the economy is extremely complex and beyond the scope of this paper; therefore, it provides us an interesting setting to explore how such COVID-19 related government response factors impact industry level returns.
The dates for each of the government policies, i.e. lockdown (LOCKDOWN), stimulus package (STIMULUS), and travel ban (TRAVEL) are collected from various internet sources. New Zealand’s government initiated four levels of lockdown, where level 4 was a complete lockdown with only essential businesses operating, and level 1 meant normal movement for people inside the country. New Zealand entered level 4 of lockdown on 25 March 2020 and moved down to level 3 on 27 April 2020. At level 3Footnote8, in addition to essential businesses, those businesses that could not operate in the ‘work from home’ model, such as takeaway restaurants and drive-thrus, were allowed to operate. LOCKDOWN is a dummy variable that takes the value of one for the days New Zealand remained at lockdown and zero otherwise. On 17 March 2020, New Zealand’s government announced an initial NZD 12.1 billion scheme to protect businesses and workers for the first time. This initial stimulus package was equivalent to approximately 4% of New Zealand’s annual GDP. STIMULUS, another government policy, is a dummy variable that takes the value of one from the day the stimulus package has been announced and zero otherwise. From 19 March 2020, only New Zealand residents and citizens were allowed to enter New Zealand from overseas. Thus, our last government policy variable, TRAVEL, is a dummy variable that takes the value of one from the day of border closure and zero otherwise.
Regarding the potential heterogeneity of the impact of the COVID-19 outbreak on the various equity industry indices, it is well recognised that service industries such as tourism, hospitality, and transportation have undergone significant losses due to travel restriction. For example, travel restrictions were very harmful to the oil industry as it heavily depends on transportation and economic activities. Furthermore, the manufacturing industry has shown high sensitivity to the COVID-19 quarantine measures through the spike in layoffs. Mirza et al. (Citation2020c) show that the manufacturing, mining, and retail sectors are most vulnerable to insolvency during the COVID-19 pandemic. In contrast, there has been an increase or at least a stability in the demand for the goods and services of certain industries and sectors such as healthcare, online entertainment, information technology, and telecommunication services, which also stem from their no-cyclicality resilience to business cycle fluctuations and the growth and innovation opportunities that the COVID-19 pandemic brought to these industries. Accordingly, we argue that the economic impact of each of the three adopted policies is not the same on the various equity industry indices, and we further indicate that the impact would depend on the ability of each policy to ease the pessimism and fear of households and investors arising from the pandemic.
All the financial data are collected from DataStream for the New Zealand equity industry indices to develop industry returns. DataStream’s industrial indices comprise five levels, of which level 1 is the total market index for each industry, including all the subsectors. Thus, in this study, we use 14 industries from level 1. Our interest is in calculating industry-level returns; thereby, we use the NZX 50 (NZ50) index as the benchmark market index. Furthermore, we compute the log-difference returns for the industry-level prices and NZ50 index.
3.2. The DECO-GARCH model
Multivariate GARCH (MGARCH) models are deployed to capture the correlations among various markets or assets (Bauwens et al., Citation2006; Kang et al., Citation2017; Silvennoinen & Teräsvirta, Citation2009). One of the limitations of multivariate GARCH models is it is difficult to estimate all GARCH parameters with a high number of variables due to the extremely complicated structure of the multivariate covariance; therefore, the DCC-GARCH model was proposed by Engle (Citation2002) to overcome the limitation. However, the limitation of the DCC-GARCH model is it can only be successfully applied up to 100 assets, beyond which the estimation becomes more difficult with the increase in dimension (Engle & Sheppard, Citation2001). The DECO-GARCH model proposed by Engle and Kelly (Citation2012) is successful at eliminating both computational and presentational complications related with high-dimension systems (Aboura & Chevallier, Citation2014; Kang et al., Citation2017; Pan et al., Citation2016); thus, the DECO model can be considered as a modified version of DCC model. An advantage of DECO-GARCH is that the correlations between all pairs of assets are equal, while their common equi-correlation is time-varying. A second benefit of using the DECO-GARCH model is that the forecasting ability during crisis periods is superior (Clements et al., Citation2015). In this study, we quantify the linkage among 14 industries; therefore, the DECO-GARCH is the most appropriate model for the purpose of our research.
Consider a vector of return series
=
(1)
(1)
where
is a vector of constant terms, and
=
is the vector of error terms.
Next, we estimate the conditional volatilities from the univariate GARCH (1,1) process specified as below in EquationEq. (2)
(2)
(2) :
(2)
(2)
where
> 0,
≥ 0, and
≥ 0, and
+
< 1.
We use the DCC model specification (Engle, Citation2002) in order to obtain the dynamic correlations between the analysed variables. Assume that and
where
is the conditional expectation on using the information set available at time t. The conditional variance–covariance matrix,
is as follows:
(3)
(3)
where
=
is the conditional correlation matrix, while the diagonal matrix of the conditional variances is given by
= diag(
). Engle (Citation2002) models the right-hand side of EquationEq. (3)
(3)
(3) rather than
directly by proposing the following dynamic correlation structure:
(4)
(4)
(5)
(5)
(6)
(6)
where
is the standardised residuals (i.e.
).
is the (
) unconditional covariance matrix of
and
and
are non-negative scalars satisfying (
) < 1). The resulting model is called the DCC-GARCH model.
In this context, Aielli (Citation2013) proves that the estimation of the covariance matrix in this way is inconsistent since
and suggests the following consistent model with the correlation-driving process (cDCC):
(7)
(7)
where
is the unconditional covariance matrix of
Based on Engle and Kelly (Citation2012) suggestion we model by deploying the cDCC process to obtain the conditional correlation matrix
then taking the mean of its off-diagonal elements. This approach is known as DECO approach as it reduces the estimation time. The scalar equi-correlation is defined as follows:
(8)
(8)
where
=
which is the
element of matrix
from the cDCC model. We then use this scalar equi-correlation to estimate the conditional correlation matrix as follows:
(9)
(9)
where
is the
matrix of ones, and
is the
-dimensional identity matrix. This process allows us to represent the degree of comovement of a group of industries with a single time-varying correlation coefficient.
3.3. Regression model
Following the model specification of Garcia (Citation2013) and Narayan et al. (2021), we employ the ordinary least square (OLS) regression model using the daily stock returns. Notably, the p-values are generated after correcting for Newey and West (Citation1987) standard errors that are robust to heteroskedasticity and autocorrelation. Our regression model is as follows:
(10)
(10)
where RTNt is the industry stock return; COVFACt is one of the three COVID-19 related government response factors, i.e. i) LOCKDOWN, ii) STIMULUS, or iii) TRAVEL. Based on prior studies (e.g., Narayan et al., 2021); Narayan & Sharma, Citation2011; we control for oil price effects (OIL), day of the week effects (MONDAY, TUESDAY, THURSDAY, and FRIDAY), stock return volatility (VOL). OILt is the crude oil price returns (WTI crude oil price), and MONDAYt, TUESDAYt, THURSDAYt and FRIDAYt are dummy variables.
4. Empirical results and analysis
4.1. Summary statistics
plots the evolution of log-returns over our sample period for each of the 14 industries and market index NZ50. Over our sample period, almost all the industries and market indexes exhibit fairly small and stable returns during 2019. Large variability in returns is evident in TELE (telecom), COSTP (consumer staples), and FDBEV (food and beverage). On 30 January 2020, the WHO announced COVID-19 as a global outbreak, and later on 11 March 2020, declared that the outbreak was a pandemic. New Zealand’s government either announced or initiated policies to manage the COVID-19 crisis near the end of the first quarter of 2020 (stimulus packages announced on 17 March 2020; international travel ban from 19 March 2020; lockdown from 25 March 2020). Therefore, it is evident from that near the end of the first quarter of 2020, all the 14 industries experienced very large price volatility; however, this variability in return is less pronounced in COSTP (consumer staples), FDBEV (food and beverage) and UTILS (utilities).
Figure 1. Evolution of return series for NZ50 market index and industries.
Note: Time-period spans from January 1, 2019 to August 25, 2020. NZ50 (NZX 50 index), TECH (technology), TELE (telecom), HLTH (healthcare), FIN (financials), FINS (financial services), RLEST (real estate), COSTP (consumer staples), FDBEV (food and beverage), INDUS (industrials), INDGS (industrial goods), BMATR (basic materials), BRESR (basic resources), ENEGY (energy) and UTILS (utilities).
Source: Author's Computation.

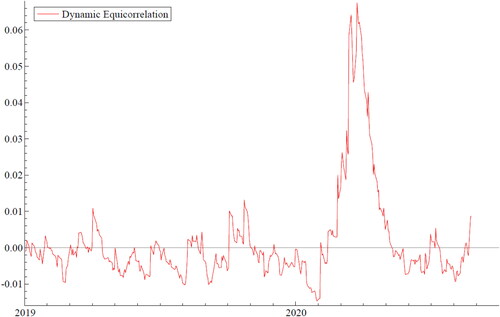
shows the dynamic equi-correlation graph. We observe a large day-to-day time variation in the equi-correlation dynamics that ranges from approximately −0.015 to 0.067. The correlations among the industry returns start to increase from the end of February 2020 until the end of March 2020 with a peak around the middle of March, approximately 0.067, which is the period when the WHO declared COVID-19 a pandemic and the New Zealand government started initiating policies to control the global crisis. An interesting observation is that this equi-correlation shows a mean-reversion pattern around the WHO’s announcement (on 30 January 2020) that COVID-19 was a global outbreak. After the announcement from the beginning of February 2020, the equi-correlation has a steady and substantial increase that implies a strong comovement and an increase in the level of integration among industries. Using U.S. sectoral data, Baruník et al. (Citation2016) document an increased connectedness among industries during the global financial crisis (GFC). This also indicates that for New Zealand, a global economic crisis caused by the COVID-19 can lead to contagious effects. For example, if an industry such as travel and leisure encounters a major crash, it will have a spill-over impact on other industries and sectors such as energy. In other words, this finding could also be attributable to investors’ pessimism and fear due to COVID-19Footnote9. For example, many individuals were using their houses as Airbnb or student accommodation, which helped them to pay off their mortgages. However, due to travel restrictions, such a source of household income has disappeared, and coupled with job losses, many individuals became unlikely to pay off their mortgages in a timely manner. Such a policy not only has a direct impact on real estate, but also indirect impact on financials, financial services, and consumer staples industries. Hence, investors’ pessimistic sentiment resulted in a hedging contagion.
Figure 2. Dynamic Equi-correlation among the NZ sectors.
Note: The dynamic equi-correlation among the NZ sectors is estimated using DECO-GARCH (1,1).
Source: Author's Computation.
Descriptive statistics of NZ50 and industry-wise returns for our sample period are reported in . Over the study period from 1 January 2019 to 25 August 2020, TECH (HLTH) has the lowest (highest) average return −0.244% (0.142%). The median return value of TECH and HLTH is 0.006 and 0.073, respectively. The average highest return by HLTH could be attributable to the New Zealand government’s economic stimulus package that includes NZD 500 million for healthcare funding. TELE exhibits the least volatility, whereas TECH is the most volatile. The high volatility in TECH is evidence that no industry is shielded from economic impact due to COVID-19. As of 31 March 2020, the top 25 tech firms have experienced an 11.9% decline in aggregate market capitalisationFootnote10. The New Zealand TECH industry has suffered due to triple challenges posed by the public health crisis, countrywide overnight digitisation, and economic recessionFootnote11. From Jarque-Bera (JB) statistics, it is apparent that all the return series are not normally distributed. The Augmented Dickey-Fuller (ADF) test results indicate that all return series are stationary at the 1% significance level.
Table 1. Descriptive statistics and unit root.
4.2. Regression results
reports OLS regression results for the association between each of the three government response strategies and NZ50 market returns using EquationEq. (10)(10)
(10) . The p-values are generated after correcting for Newey and West (Citation1987) standard errors that are robust to heteroskedasticity and autocorrelation. The sum of lag coefficients and p-values of the Wald test explore the null hypothesis of
We test LOCKDOWN, STIMULUS, and TRAVEL over a week (five days); thereby, the regression models include five lags.
Table 2. Effect of COVID factors (Lockdown, Stimulus package and Travel ban) on NZ50 market returns.
To interpret the results with five lagged coefficients for each of the COVID-19 response factors, we rely on the sum of the effects by employing the Wald test following Narayan et al. (2021), which produces the joint null hypothesis that the sum of the effects over the five days is zero. When shocks continue over time, it is crucial to observe the sum effects as it gives the accumulated or net effect of the shock. Wald test results are reported on the last row of the table. Based on the Wald test, we find that LOCKDOWN has a positive impact on NZ50 market returns (coefficient 0.335; p < 0.05). This implies that the government initiative to lockdown, in general, has increased investors’ confidence in the market. Narayan et al. (2021) find that in Canada, France, Japan, the UK, and the US, each day of lockdown has improved stock returns.
However, the coefficients of the Wald test for STIMULUS (coefficient 0.272) and TRAVEL (coefficient 0.217) are insignificant; thus, unlike lockdown, government policy to rescue the economy with a stimulus package and reduce imported cases by imposing an international travel ban has no impact on NZ50 market returns. According to Narayan et al. (2021) in France, Germany, Japan, and Italy stimulus packages had no impact on stock returns, and a travel ban was ineffective in Germany and Italy. The insignificant results from border closure could be attributed to the fact that New Zealand universities are expected to lose approximately NZD 400 million by 2021 from international studentsFootnote12. Some of the tertiary educational institutions have already been through restructuring or are temporarily closed. Although the economic stimulus package has been extended, the uncertainty remains once the extension period is over because tourism and aviation sectors are unlikely to return to pre-COVID-19 level operation as long as there is a restriction on international travel. Such a direct and indirect impact of government policies to fight against COVID-19 induces nervousness among investors.
The impact of government policies on market returns provides only a partial image; thus, in order to have a more in-depth understanding of how government policies affect each industry, we investigate each of the three COVID-19 response factors on industry returns. During the GFC, financial and household industries were under more pressure compared to other industries, with the banking industry losing approximately USD 13 trillion globally (McDonnell & Burgess, Citation2013). Economic recessions affect each industry and country differently; therefore, similar to the GFC, the effect of COVID-19 and government policies to manage the pandemic are likely to have an uneven impact across industries. Moreover, according to an article by InfometricsFootnote13, accommodation and food services are likely to have the highest job cuts, with approximately 53,000 jobs lost compared to financial and insurance services with approximately 7,500 job cuts (second lowest). Therefore, it is of crucial importance to investigate industry reactions to government responses.
The impact of LOCKDOWN on industry-wise returns are reported in . Based on the Wald test, we document that the effect of LOCKDOWN is overall positive on industry-wise returns and significant for eight (TELE, FIN, FINS, INDUS, INDGS, BMATR, BRESR, and UTILS) out 14 industries. TELE has the lowest return (coefficient 0.272; p < 0.05) and BMATR has the highest returns (coefficient 0.855; p < 0.05). The results from the lockdown policy indicate that the government’s attempt to restrict movements inside the country has led to an increase in investors’ confidence only in certain industries.
Table 3. Effect of Lockdown on NZ industry returns.
reports the effect of STIMULUS on industry returns. We interpret results based on the aggregate impact of shocks on returns with the help of the Wald test. The reported results from show that the impact of STIMULUS is overall positive on industry returns and significant for eight (FINS, COSTP, FDBEV, INDUS, INDGS, BMATR, BRESR, and UTILS) out 14 industries, with UTILS having the lowest return (coefficient 0.330; p < 0.05) and both COSTP and FDBEV having the highest returns (coefficient 0.619; p < 0.05). Although the stimulus package announced by the government includes NZD 500 million for healthcare funding and NZD 600 million for the aviation sector, such an economic stimulus package has been unable to raise investors’ confidence for the HLTH and RLEST sectors.
Table 4. Effect of Stimulus package on NZ industry returns.
Our final COVID-19 government response factor is border closure (TRAVEL). Results related to the impact of TRAVEL on industry returns are reported in . As mentioned earlier, economic recessions affect each industry unevenly; we find from the Wald test that border closure has an overall positive effect on industry returns and is significant for ten (TELE, FIN, FINS, COSTP, FDBEV, INDUS, INDGS, BMATR, BRESR, and UTILS) out 14 industries. For these ten industries, with each day of border closure, returns have improved by 0.257 (UTILS, p < 0.10) to 0.608 (BMATR, p < 0.05).
Table 5. Effect of Travel ban on NZ industry returns.
reports regression results for the association between each of the three government response strategies and the dynamic equi-correlation among industries. The coefficients from the Wald test are negative, indicating government intervention in the form of government policies have reduced the degree of integration and comovement among industries; however, the results are statistically insignificant. These insignificant results could be attributed to the global uncertainties and New Zealand’s anticipated 250,000 job losses over the next year (Infometrics). Accommodation and food services will have seven times more job cuts than media and telecommunication; however, this will have an indirect spill-over effect on the other industries.
Table 6. Effect of COVID-19 factors (Lockdown, Stimulus package and Travel ban) on the dynamic equi-correlation (DECO) among NZ industries.
Our findings suggest that LOCKDOWN has raised investors’ confidence in the overall New Zealand stock market. All three COVID-19 response factors have a positive impact on investors’ confidence; however, this impact varies across industries. An interesting observation from our findings is that none of the three factors has a significant impact on TECH, HLTH, and RLEST returns. This implies that although the government has plans to support the aviation and healthcare industry and is setting aside a fund for acquiring vaccines, such initiatives have been unable to increase investors’ confidence in the pandemic and its implication for the economy. Media and experts consider TECH as one of the major industries to play a key role in the ‘road to recovery’ from this economic crisis and one of the secured industries that will flourish in the coming years due to work-from-home culture and remote working opportunities. However, based on our findings, such assessments by experts and media have not been able to assure investors regarding investment in TECH. Tech firms that have an affiliation with China, for example, are likely to heighten investors’ uncertainty. This is aligned with prior studies that technology stocks are considered speculative by investors (e.g. Baker & Wurgler, Citation2006; Chen et al., Citation2013). Since the dot-com bubble in the 1990s, investors have moved investment towards consumer goods, financials, resources, and utilities (Anderson et al., Citation2010). In our industry-wise returns analysis, we find support that government policies raised investors’ confidence in FIN, FINS, COSTP, UTILS, BMATR, and BRESR, which is aligned with Anderson et al. (Citation2010).
5. Conclusion
In this paper, we examined the impact of three policies (lockdown, a stimulus package, and a travel ban) adopted by the New Zealand government to cope with the COVID-19 outbreak on 14 industry equity returns. We were motivated by the particularity of New Zealand as being one of the most successful countries among the OECD to deal with the pandemic using a curve-crushing response strategy called ‘go hard and go early’. While most countries struggled to confront the quick spread of COVID-19 cases, New Zealand, a nation of nearly five million people, was seen as one of the safest places as it managed to contain the spread of the virus and achieve a relatively long period of COVID-19‐free status spanning over 102 days. Notably, the academic literature lacks empirical evidence on the effect of coronavirus-related restriction policies on the aggregated and disaggregated levels of equity returns in New Zealand.
Using multivariate GARCH model and regression analyses, the main results show heterogeneity in the effects of the three governmental policies on industry stock returns. They can be summarised as follows. First, the dynamics of the equi-correlation among industry stock returns become positive around mid-March 2020 when the WHO declared COVID-19 a pandemic, reflecting an increase in the level of integration among the various industry stock indices. Second, lockdown has had a positive impact on NZ50 market returns, suggesting that the government initiative of lockdown has increased investors’ confidence in the market, which is not the case for the stimulus package and the travel ban. Third, the effect of each of the three governmental policies was positive and significant for at least eight industry returns. However, none of the three policies had a significant impact on technology, healthcare, and real estate returns.
The findings have important implications that concern policymakers and investors. For the former, several lessons can be drawn regarding the factors and policies that can affect stock market stability at the aggregate and industry levels. Specifically, the findings suggest that not all three policies are alike for the performance of stock market returns in New Zealand. This finding is important as it helps the local regulators and policymakers conclude the most suitable policies for the stock markets to be adopted against catastrophic events such as COVID-19, especially if the second wave of COVID-19 emerges. On the industry level, the findings point to the heterogeneous reaction of stock returns to various governmental policies, which would assist regulators and policymakers in formulating more targeted policies at the industry level that can maintain financial stability and the well-functioning of the stock markets in New Zealand. They matter for policy formulation and the resiliency of each industry to various events and action plans, which can be used to add more flexibility to the functioning of the New Zealand stock market for the sake of efficiency. Possible policy interventions beyond a tax referral might be needed to improve the creditworthiness of damaged firms during the pandemic. The findings might also serve as a reference for other countries in their battle against COVID-19 and to better learn from the effects of such emergency responses on stock market returns.
For investors and portfolio managers, the findings provide new insights on the effects of response policies related to COVID-19 on the price discovery in the stock markets at both aggregate and industry levels. This is useful to asset pricing and portfolio management as it helps to uncover specific factors and policies that can drive stock returns and, thus, market risk. Based on our findings, investors can refine their trading and investment strategies during health crisis periods to optimise returns, minimise risk, and conduct a switching strategy across industry stock indices for the benefits of diversification and hedging, as well as risk management.
However, given that the New Zealand government’s response to the pandemic comes at a high cost, it is too early to assess the adverse effect that the accumulative debt induced during the COVID-19 period will have on the local economy and stock markets in the long-run. Accordingly, future research should assess the effects of governmental response to COVID-19 on industry stock returns while differentiating between the short-term and the long-term. Other future studies can consider the same effects while considering a sample from all countries.
Disclosure statement
No potential conflict of interest was reported by the authors.
Additional information
Funding
Notes
2 Notably, New Zealand is not free from future potential outbreaks evolving from breakdowns of border-control and confinement measures.
5 Generally, investors move into defensive stocks during economic downturn, whereas they opt for cyclical stocks during economic booms.
8 New Zealand moved to level 2 and 1 on May 13, 2020 and June 08, 2020, respectively. Auckland has moved to level 3 and rest of the country to level 2 on August 12, 2020.
9 Due to restrictions on both domestic and international movements, travel and leisure subsectors suffered directly; such restrictions also hit the oil market as global demand for oil fell drastically leading to negative oil price.
References
- Aboura, S., & Chevallier, J. (2014). Volatility equicorrelation: A cross-market perspective. Economics Letters, 122(2), 289–295. https://doi.org/10.1016/j.econlet.2013.12.008
- Aielli, G. P. (2013). Dynamic conditional correlation: on properties and estimation. Journal of Business & Economic Statistics, 31(3), 282–299. https://doi.org/10.1080/07350015.2013.771027
- Anderson, K., Brooks, C., & Katsaris, A. (2010). Speculative bubbles in the S&P 500: Was the tech bubble confined to the tech sector? Journal of Empirical Finance, 17(3), 345–361. https://doi.org/10.1016/j.jempfin.2009.12.004
- Arouri, M. E. H., Jouini, J., & Nguyen, D. K. (2011). Volatility spillovers between oil prices and stock sector returns: Implications for portfolio management. Journal of International Money and Finance, 30(7), 1387–1405. https://doi.org/10.1016/j.jimonfin.2011.07.008
- Aslam, F., Aziz, S., Nguyen, D. K., Mughal, K. S., & Khan, M. (2020). On the efficiency of foreign exchange markets in times of the COVID-19 Pandemic. Technological Forecasting and Social Change, 161, 120261. https://doi.org/10.1016/j.techfore.2020.120261
- Baker, S. R., Bloom, N., Davis, S. J., & Terry, S. J. (2020). Covid-induced economic uncertainty. (No. w26983). National Bureau of Economic Research.
- Baker, M., & Wurgler, J. (2006). Investor sentiment and the cross‐section of stock returns. The Journal of Finance, 61(4), 1645–1680. https://doi.org/10.1111/j.1540-6261.2006.00885.x
- Balli, F., Balli, H. O., Hasan, M., & Gregory-Allen, R. (2020). Economic policy uncertainty spillover effects on sectoral equity returns of New Zealand. Journal of Economics and Finance, 44(4), 617–670. https://doi.org/10.1007/s12197-020-09508-6
- Baruník, J., Kočenda, E., & Vácha, L. (2016). Asymmetric connectedness on the US stock market: Bad and good volatility spillovers. Journal of Financial Markets, 27, 55–78. https://doi.org/10.1016/j.finmar.2015.09.003
- Bauwens, L., Laurent, S., & Rombouts, J. V. (2006). Multivariate GARCH models: a survey. Journal of Applied Econometrics, 21(1), 79–109. https://doi.org/10.1002/jae.842
- Berben, R. P., & Jansen, W. J. (2005). Co‐Movement in International Equity Markets: A Sectoral View. Journal of International Money and Finance, 24(5), 832–857. https://doi.org/10.1016/j.jimonfin.2005.04.001
- Bhargava, V., Dania, A., & Malhotra, D. K. (2012). Industry effects and volatility transmission in portfolio diversification. Journal of Asset Management, 13(1), 22–33. https://doi.org/10.1057/jam.2011.17
- Bouri, E., Cepni, O., Gabauer, D., & Gupta, R. (2021). Return Connectedness across Asset Classes around the COVID-19 Outbreak. International review of financial analysis, 73, 101646.
- Bouri, E., Demirer, R., Gupta, R., & Pierdzioch, C. (2020). Infectious diseases, market uncertainty and oil volatility. Energies, 13(16), 4090. https://doi.org/10.3390/en13164090
- Carraro, A., Ferrone, L., & Squarcina, M. (2020). Are COVID-19 Containment Measures Equally Effective in Different World Regions?. (No. wp2020_11. rdf). Universita'degli Studi di Firenze, Dipartimento di Scienze per l'Economia e l'Impresa.
- Carrieri, F., Errunza, V., & Sarkissian, S. (2004). Industry Risk and Market Integration. Management Science, 50(2), 207–221. https://doi.org/10.1287/mnsc.1030.0184
- Chen, M. P., Chen, P. F., & Lee, C. C. (2013). Asymmetric effects of investor sentiment on industry stock returns: Panel data evidence. Emerging Markets Review, 14, 35–54. https://doi.org/10.1016/j.ememar.2012.11.001
- Choudhry, T., & Osoble, B. N. (2015). Nonlinear interdependence between the us and emerging markets' industrial stock sectors. International Journal of Finance & Economics, 20(1), 61–79. https://doi.org/10.1002/ijfe.1494
- Clements, A., Scott, A., & Silvennoinen, A. (2015). On the benefits of equicorrelation for portfolio allocation. Journal of Forecasting, 34(6), 507–522. https://doi.org/10.1002/for.2357
- Dergiades, T., Milas, C., & Panagiotidis, T. (2020). Effectiveness of Government Policies in Response to the COVID-19 Outbreak. Available at SSRN 3602004.
- Dungey, M., & Gajurel, D. (2014). Equity market contagion during the global financial crisis: Evidence from the world's eight largest economies. Economic Systems, 38(2), 161–177.
- Engle, R. (2002). Dynamic conditional correlation: A simple class of multivariate generalized autoregressive conditional heteroskedasticity models. Journal of Business & Economic Statistics, 20(3), 339–350. https://doi.org/10.1198/073500102288618487
- Engle, R. F., & Sheppard, K. (2001). Theoretical and empirical properties of dynamic conditional correlation multivariate GARCH. (No. w8554). National Bureau of Economic Research.
- Engle, R., & Kelly, B. (2012). Dynamic equicorrelation. Journal of Business & Economic Statistics, 30(2), 212–228. https://doi.org/10.1080/07350015.2011.652048
- Garcia, D. (2013). Sentiment during recessions. The Journal of Finance, 68(3), 1267–1300.
- Greer, S. L., King, E. J., da Fonseca, E. M., & Peralta-Santos, A. (2020). The comparative politics of COVID-19: The need to understand government responses. Global Public Health, 15(9), 1413–1416. https://doi.org/10.1080/17441692.2020.1783340
- Gupta, R., Subramaniam, S., Bouri, E., & Ji, Q. (2021). Infectious Diseases-Related Uncertainty and the Safe-Haven Characteristic of the US Treasury Securities. International Review of Economics and Finance, 71, 289–298. https://doi.org/10.1016/j.iref.2020.09.019
- Hale, T., Petherick, A., Phillips, T., & Webster, S. (2020). Variation in government responses to COVID-19. Blavatnik school of government working paper, 31, 2020-11.
- Kang, S. H., McIver, R., & Yoon, S. M. (2017). Dynamic spillover effects among crude oil, precious metal, and agricultural commodity futures markets. Energy Economics, 62, 19–32. https://doi.org/10.1016/j.eneco.2016.12.011
- Mazey, S., & Richardson, J. (2020). Lesson‐Drawing from New Zealand and Covid‐19: The need for anticipatory policy making. The Political Quarterly, 91(3), 561–570. https://doi.org/10.1111/1467-923X.12893
- McDonnell, A., & Burgess, J. (2013). The impact of the global financial crisis on managing employees. International Journal of Manpower, 34(3), 184–197. https://doi.org/10.1108/IJM-04-2013-0076
- Mirza, N., Hasnaoui, J. A., Naqvi, B., & Rizvi, S. K. A. (2020a). The impact of human capital efficiency on Latin American mutual funds during Covid-19 outbreak. Swiss Journal of Economics and Statistics, 156(1), 1–7. https://doi.org/10.1186/s41937-020-00066-6
- Mirza, N., Naqvi, B., Rahat, B., & Rizvi, S. K. A. (2020b). Price reaction, volatility timing and funds' performance during Covid-19. Finance Research Letters, 36, 101657. https://doi.org/10.1016/j.frl.2020.101657
- Mirza, N., Rahat, B., Naqvi, B., & Rizvi, S. K. A. (2020c). Impact of Covid-19 on corporate solvency and possible policy responses in the EU. The Quarterly Review of Economics and Finance, https://doi.org/10.1016/j.qref.2020.09.002
- Naeem, M. A., Farid, S., Ferrer, R., & Shahzad, S. J. H. (2021b). Comparative efficiency of green and conventional bonds pre-and during COVID-19: An asymmetric multifractal detrended fluctuation analysis. Energy Policy, 153, 112285. https://doi.org/10.1016/j.enpol.2021.112285
- Naeem, M. A., Sehrish, S., & Costa, M. D. (2021a). COVID-19 pandemic and connectedness across financial markets. Pacific Accounting Review, ahead-of-print(ahead-of-print). https://doi.org/10.1108/PAR-08-2020-0114
- Narayan, P. K., & Sharma, S. S. (2011). New evidence on oil price and firm returns. Journal of Banking & Finance, 35(12), 3253–3262. https://doi.org/10.1016/j.jbankfin.2011.05.010
- Narayan, P. K., Phan, D. H. B., & Liu, G. (2021). COVID-19 lockdowns, stimulus packages, travel bans, and stock returns. Finance Research Letters, 38, 101732. https://doi.org/10.1016/j.frl.2020.101732
- Newey, W. & West, K. (1987). A simple, positive semi-definite, heteroskedasticity and autocorrelation consistent covariance matrix, Econometrica, 55(3), 703–708.
- Pan, Z., Wang, Y., & Liu, L. (2016). The relationships between petroleum and stock returns: An asymmetric dynamic equi-correlation approach. Energy Economics, 56, 453–463. https://doi.org/10.1016/j.eneco.2016.04.008
- Phan, D. H. B., & Narayan, P. K. (2020). Country responses and the reaction of the stock market to COVID-19—A preliminary exposition. Emerging Markets Finance and Trade, 56(10), 2138–2150. https://doi.org/10.1080/1540496X.2020.1784719
- Phylaktis, K., & Xia, L. (2009). Equity market comovement and contagion: A sectoral perspective. Financial Management, 38(2), 381–409. https://doi.org/10.1111/j.1755-053X.2009.01040.x
- Rababah, A., Al‐Haddad, L., Sial, M. S., Chunmei, Z., & Cherian, J. (2020). Analyzing the effects of COVID‐19 pandemic on the financial performance of Chinese listed companies. Journal of Public Affairs, 20(4), 1–6.
- Rizvi, S. K. A., Mirza, N., Naqvi, B., & Rahat, B. (2020). Covid-19 and asset management in EU: A preliminary assessment of performance and investment styles. Journal of Asset Management, 21(4), 281–291. https://doi.org/10.1057/s41260-020-00172-3
- Shahzad, S. J. H., Bouri, E., Kristoufek, L., & Saeed, T. (2021a). Impact of the COVID-19 outbreak on the US equity sectors: Evidence from quantile return spillovers. Financial Innovation, 7(1), 1–23. https://doi.org/10.1186/s40854-021-00228-2
- Shahzad, S. J. H., Naeem, M. A., Peng, Z., & Bouri, E. (2021b). Asymmetric volatility spillover among Chinese sectors during COVID-19. International Review of Financial Analysis, 75, 101754. https://doi.org/10.1016/j.irfa.2021.101754
- Silvennoinen, A., & Teräsvirta, T. (2009). Multivariate GARCH models. In Handbook of financial time series (pp. 201–229). Springer.
- Yarovaya, L., Mirza, N., Abaidi, J., & Hasnaoui, A. (2021). Human capital efficiency and equity funds’ performance during the COVID-19 pandemic. International Review of Economics & Finance, 71, 584–591. https://doi.org/10.1016/j.iref.2020.09.017