
Abstract
Although there has been an increasing number of studies investigate portfolio optimization from different perspectives, few attempts could be found that focus on the development trend and hotspots of this research area. Therefore, it motivates us to comprehensively investigate the development of portfolio optimization research and give some deep insights into this knowledge domain. In this paper, some bibliometric methods are utilized to analyse the status quo and emerging trends of portfolio optimization research on various aspects such as authors, countries and journals. Besides, ‘theories’, ‘models’ and ‘algorithms’, especially heuristic algorithms are identified as the hotspots in the given periods. Furthermore, the evolutionary analysis tends to presents the dynamic changes of the cutting-edge concepts of this research area in the time dimension. It is found that more portfolio optimization studies were at an exploration stage from mean-variance analysis to consideration of multiple constraints. However, heuristic algorithms have become the driving force of portfolio optimization research in recent years. Multi-disciplinary analyses and applications are also the main trends of portfolio optimization research. By analysing the dynamic changes and multi-dimensional evolution in recent decades, we contribute to presenting some deep insights of the portfolio optimization research directly, which assists researchers especially beginners to comprehensively learn this research field.
1. Introduction
The portfolio optimization theory is a collection of stocks, bonds, and financial derivatives held by investors or financial institutions for the purpose to diversify risks and gain profits, which is one of the hottest topics in the field of financial research. Markowitz (Citation1952) laid the foundation for the portfolio theory by proposing a mean-variance analysis method and portfolio finite boundary model. He used the mean-variance model analysis to obtain a portfolio that could effectively reduce risks. Based on Markowitz's portfolio theory, other scholars have made some improvements and extensions from different perspectives. Sharpe (Citation1963) proposed Sharpe's single-factor model which can simplify the estimation of the covariance matrix. It greatly promoted the practical application of portfolio theory. In particular, the capital asset pricing model was proposed which is significant for investment practice. After that, some combinatorial portfolio optimizations have been proposed (Dentcheva & Ruszczynski, Citation2003; Gaigi et al., Citation2016). It should be noted that the solution of the model is also of great importance. Therefore, the biggest innovation in recent years is the application of intelligent algorithms to the solution of portfolio optimization problems, realizing the intersection of different disciplines. Inuiguchi and Ramı́k (Citation2000) proposed some fuzzy linear programming methods and techniques; Fernández and Gómez (Citation2007) presented a neural network heuristic algorithm to solve the portfolio selection problem; Bertsimas et al. (Citation2011) introduced the theory and applications of robust optimization; Baykasoğlu et al. (Citation2015) combined a meta-heuristic algorithm with an exact solution approach to solve cardinality constrained portfolio optimization problem. It is found that there are various methods to study the portfolio optimization problem. Metawa et al. (Citation2017) proposed an intelligent model of organizational bank loan decisions based on a genetic algorithm. Paiva et al. (Citation2019) proposed a classifier fusion method based on machine learning to predict stocks and build a trading investment decision model.
Even though many scholars have studied portfolio optimization problems from different perspectives using various methods, few attempts could be found to learn the status quo and the emerging trends in this research by the analysis of the mapping knowledge domains. There are various tools such as CiteSpace and Vosviewer, which are used to analyse the data retrieved from Web of Science (WoS) would help build a visualized bibliometric analysis of the different research. The effective bibliometric tool was developed by Chen (Citation2006) and has been widely used in various aspects (Chen et al., Citation2019; Wang et al., Citation2020; Citation2021a; Citation2021b; Xu et al., Citation2019; Yu et al., Citation2016; Yu & Liao, Citation2016; Zhou et al., Citation2019; Citation2020). In this paper, CiteSpace is mainly utilized to analyse the status quo and the emerging trends of portfolio optimization based on 5767 references published between 1966 and 2021. The following goals are expected in this paper: (1) to analyse the collaboration relationship of authors, institutions, and countries. (2) To illustrate the references, authors, and journals with lots of contributions. (3) To reveal the emerging trends and hotspots in this field. (4) To visualize the frontier knowledge propagation path and deepen the vertical and horizontal understanding of the research object.
Moreover, to better describe the development of the research field, this paper also applies the main path analysis to explore the knowledge evolution process of scientific discovery. Specifically, the Pajek (Dohleman, Citation2006) will be used to identify development paths, summarize the evolution path of portfolio optimization from different perspectives, and conduct multi-path analysis to detect research topics. Hummon and Dereian (Citation1989) took the lead in analysing the citation network of DNA papers through the main path. Since main path analysis can find citation relations in social networks, an increasing number of scholars use it to explore the development path and knowledge evolution processes in various fields (Benítez-Andrades et al., Citation2020; Djomba & Zaletel-Kragelj, Citation2016; Lu & Liu, Citation2013).
To achieve the above aims, this paper is organized as followed: Section 2 introduces the source of the data, the number of publications, subject categories, research direction, and methodology in this research. Section 3 illustrates the citation analysis of authors, institutions, and countries. The co-citation analysis of references and burst detection is presented in Section 4. The four main paths of the Evolutionary analysis are included in Section 5. Finally, some conclusions are given based on the above results.
2. Basic preparation of portfolio optimization
2.1. Preliminary analysis
The research of this paper is to make visualization and analysis of portfolio optimization. To investigate the status quo and the emerging trends of portfolio optimization conditions. Different methods of analysis should be given by kinds of different and relative software (Van Eck & Waltman, Citation2010). There are some pieces of information in articles such as references, authors, institutions, countries, and keywords that present or co-cite with high frequency, which can be addressed through selecting different node types and clusters. In this process of addressing the literature data, the important index that measures the important nodes in the network is called betweenness centrality, CiteSpace usually uses this indicator to discover and measure the importance of literature, and highlight such literature (or authors, institutions.).
In this paper, WoS is chosen to be the database for our scientometric investigation because the data needed in this study is from Science Citation Index Expanded (SCI-E) and Social Sciences Citation Index (SSCI) in WoS core collection, which is relatively comprehensive and the exported data can be analysed by CiteSpace immediately. Moreover, in terms of the research substance in this paper, choosing appropriate keywords to select articles from WoS should focus on the validity and representation of keywords, and verify whether the data connected with the required. By searching the topic ‘portfolio optimization’, there are a total of 5767 articles about portfolio optimization that can be obtained which exclude some record types. The main reason to choose the research period is that the early record in the field of portfolio optimization on WoS starts from 1966. Therefore, it could be of great help to comprehensively analyse the development of portfolio optimization research.
According to the exported data, the numbers of publications for each year are shown in . The growth of articles number is rapidly increasing. In the first several decades, from 1966 to 1991, little progress has been made in the study of such research, and very few people pay attention to and conduct such questions, hence only about a dozen papers were published in the several decades. However, at this stage, some literature had a profound influence on later scholars, such as the paper entitled ‘Large-scale portfolio optimization’, which developed an algorithm to solve a wide range of portfolio models (Perold, Citation1984). How to use an intelligent algorithm to solve the model is one of the hot spots in recent years. Regardless of the number of publications, there is an upward trend at this stage. The research on the model of portfolio optimization also appears gradually (Cai et al., Citation2000; Jorion, Citation2003; Pikovsky & Karatzas, Citation1996). The paper outputs increase quickly from 2005 to 2021, although there was a significant decrease in 2015. At this stage, the most cited article is ‘Theory and applications of robust optimization’ (Bertsimas et al., Citation2011). The authors proposed the computational appeal of the robust optimization method, as well as its modeling capabilities and wide applicability. This method can be flexibly applied to portfolio optimization problems. The number of publications on portfolio optimization has increased in recent years in different types, as shown in , six different types make up the whole publications based on the analytic results given by WoS. These articles covering almost all literature data account for 97 percent of all publications. The structure of literature types is easier, comparing to the structure of research directions, which can be found in .
Figure 1. The number of published papers per year of portfolio optimization research.
Source: Web of Science.
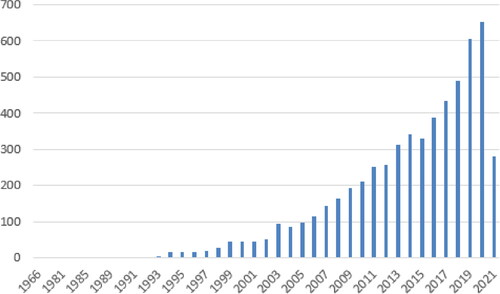
Figure 2. The document types of portfolio optimization research.
Source: Web of Science.

Table 2. The top 10 research areas of portfolio optimization research.
The purpose of this paper is to explore the development of portfolio optimization program, and it is seen from that presents the top 10 WoS categories in portfolio optimization that the research has become multidisciplinary in terms of the categories' distribution. tells us that ‘Operations research management science’ is the most popular WoS category with 1632 which accounts for 28.42% of the total publications. ‘Economics’ is the second most popular WoS category with 975 which accounts for 16.91% of the total publications. As is seen in , the proportion of each WoS category is relatively uniform except for the first one, which indicates that portfolio optimization research occupies certain importance in various disciplines and fields. Comparing to , some categories are corresponding to the research area in .
Table 1. The top 10 WoS categories of portfolio optimization research.
shows that ‘Business economics’ is the most concerned research area, which accounts for 34.91%, followed by ‘Mathematics’ (28.87%), ‘Operations research management science’ (28.42%), ‘Engineering’ (20.53%), ‘Computer science’ (18.05%), the above research area determine the general trend of portfolio optimization. Besides, the rest of the research areas with a percentage of total below 10% are ‘Mathematical methods in social sciences’, ‘Energy fuels’, ‘Environment sciences ecology’, ‘Science technology other topics’, ‘Automation control systems’, which have fewer publications.
2.2. Comparison of methodology
This paper mainly uses two bibliometric tools, namely CiteSpace and Pajek, to investigate the development of portfolio optimization research from two perspectives. CiteSpace provides a horizontal overview of portfolio optimization research through a visual information process. Therefore, it is also called ‘knowledge mapping space’. Compared with other bibliometric tools, CiteSpace has the following advantages: (1) Citesapce has strong compatibility with various data formats, leading to a wide scope of the bibliometric investigation; (2) Citesapce realizes data visualization and the analytic results can be presented directly; (3) CiteSpace contains important clustering tools such as burst detection, trend observation and keyword analysis, which clarify the development frontiers, research hotspots and evolutionary context of portfolio optimization.
Unlike CiteSpace's horizontal analysis, Pajek shows the vertical evolution process. Pajek is a powerful tool to deal with complex nonlinear networks and its application in bibliometrics shows the evolutionary process of portfolio optimization research. Compared with CiteSpace's broader research scope, Pajek tends to focus on the evolution process of the research development. Specifically, Pajek has two main advantages: (1) Pajek's operation is easier and the evolution of document visualization is more intuitive; (2) Pajek focuses on the evolution path of portfolio optimization research, including forward path analysis, backward path analysis, critical path analysis, and global path analysis.
3. Collaborative analysis of knowledge network
To know the development process and the theoretical basis of portfolio optimization, there are some ways by CiteSpace that can address the literature data to investigate contacts between authors, institutions, and countries in various research fields. As aforementioned, the number of publications can directly indicate the development of a certain research area, and it is critical to show the key point of contributions made by a country or an author. Therefore, the following steps of this paper are to find out the author collaboration network and institution collaboration networks which are mainly, and then country collaboration networks should be taken into consideration.
3.1. Author collaboration analysis
The author's collaboration network can be identified by addressing the data of WoS, which makes the relationship between different authors more accurate. As shown in . Between nodes and links crisscrossed, each node means an author who has contributions to the research, and the tree-rings of each node represent the citation time of an author. The color of which represents the corresponding citation time and the width of the line represents the number of collaborative papers. shows that the top 20 productive authors of portfolio optimization.
Figure 3. The author's collaboration of portfolio optimization research.
Source: Citespace.
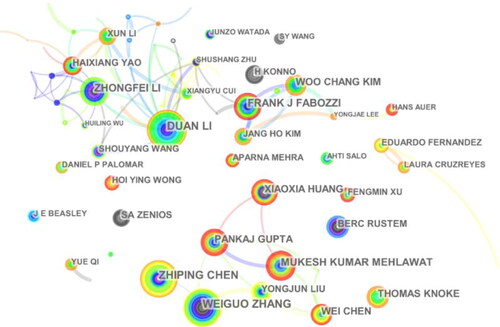
Table 3. Top 20 productive authors of portfolio optimization research.
Except for the first three authors, the number of other authors' publications did not vary obviously. The result here presents some differences compared to the one on WoS because the result given by CiteSpace is on the basis of the local citation score (LCS), while the one on WoS is obtained based on the global citation score (GCS). In CiteSpace, LCS is the number of times that any document in the currently downloaded data set is cited by other documents, while in WoS, GCS calculates the number of times that any document on the entire network is cited by other documents. Because of the difference between LCS and GCS, the results presented by Citespace and WoS are different. Therefore, lists the top 20 productive authors with the highest LCS values because we focus on the interrelations among the studies in the research field of portfolio optimization and more data that are from other research topics may lead to inaccurate results. Comparing with , the cooperation of scholars in the field of portfolio optimization research shows a trend of aggregation in the local area, and decentralization in the overall situation.
3.2. Institution collaboration analysis
The institution collaboration network measures how each institution works together. shows that the institution's collaboration in the world. The visualization vividly demonstrates the maturity and integrity of the institution's collaboration. Because each node is closely and tightly related to other nodes and spreads from the center to the sides, which presents the collaborative relationship among the corresponding institution is very mature. According to , there is more collaboration among institutions in the same countries. For example, at the Chinese University of Hong Kong and Xi’an Jiaotong University, there are quite a few collaboration relationships based on the links between the two nodes. Thus, it is important to improve the cross-national interactions, especially for those countries that have made significant contributions to the development of portfolio optimization research.
Figure 4. The institution collaboration of portfolio optimization research.
Source: Citespace.
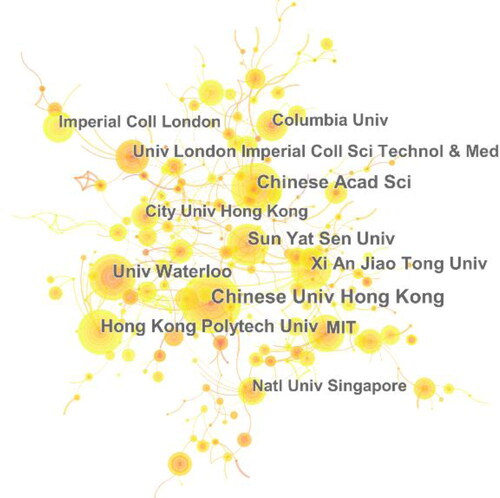
According to , the top 10 productive institutions were listed by which made great contributions to portfolio optimization research, The Chinese University of Hong Kong publishing 78 articles occupies first place in this research field, followed by the Chinese Academy of Sciences with 66 publications. It is not hard to see that the top 10 productive institutions are mainly affiliated with China, and China has a larger number of institutions. Therefore, the most productive institutions are from the most productive countries. Expect for the first two institutions, other institutions with over 50 publications include the University of Waterloo (59), The Hong Kong Polytechnic University (57), Sun Yat-sen University (55), Xi’an Jiaotong University (51). The contribution to the country itself can be made through the following research.
Table 4. Top 10 productive institutions of portfolio optimization research.
3.3. Country collaboration analysis
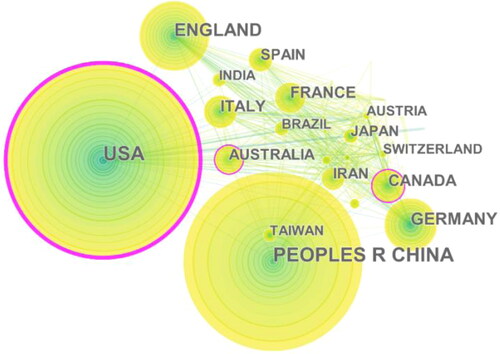
The top 10 productive countries/territories of portfolio optimization research are listed in . It is obvious that China is the most productive contributor with 1357 articles accounting for 23.53% of the total publications in the first place, and the total number of US publications is 1318 in the second place, accounting for 22.59% of the total publications, followed by England and Germany. The publications of the above countries have accounted for over 70% of the total publications related to portfolio optimization research in the world.
Table 5. Top 10 productive countries/territories of portfolio optimization research.
As aforementioned, many developed countries are the significant contributors of portfolio optimization research. Europe occupied a large proportion of portfolio optimization research in the early stage, laying the foundation for further explorations. Although China is only a developing country, the characteristics of numerous talents and rapid development of China generate a lot of research about portfolio optimization of finance and economics, which also explains why China can become the first productive contributor in publishing literature on portfolio optimization research.
shows the country collaboration of portfolio optimization research, comparing to , the size of each node indicates the publication number of each country, and the thinness of the links represents the level of collaboration between countries. It can be found that the more a country is productive, the more one has collaboration with others. The thinness of the links indicates a low level of cooperation.
Figure 5. The country collaboration of portfolio optimization research.
Source: Citespace.
4. Cluster analysis and burst detection
The collaborative analysis of knowledge networks presents the basic knowledge evolution and synergy process. The main knowledge system and development trend can be further highlighted. In this section, cluster analysis and burst detection will be constructed to reflect the focus of the knowledge system and emerging trends in this field.
4.1. Cluster analysis
To know the dynamic change of portfolio optimization research directly, cluster analysis provided by CiteSpace is introduced to describe the main literature and focus of knowledge evolution. shows that a cluster network of literature in portfolio optimization research. The whole is divided into 72 clusters, which are labeled by index terms from their citers and are summarized with ‘#’. The largest 10 clusters are listed in . In , the size represents the number of publications in the cluster. The largest cluster (#0) has 97 members and the second-largest cluster (#1) has 94 members, followed by cluster (#2) has 94 members. Silhouette is an index to measure the homogeneity of a cluster, the silhouette and homogeneity show a positive correlation, the greater the score of Silhouette, the better the homogeneity. It is generally that silhouette > 0.5 means that clustering is reasonable, and the silhouette is bigger than 0.7 means that clustering is convincing.
Figure 6. The cluster network of portfolio optimization research.
Source: Citespace.
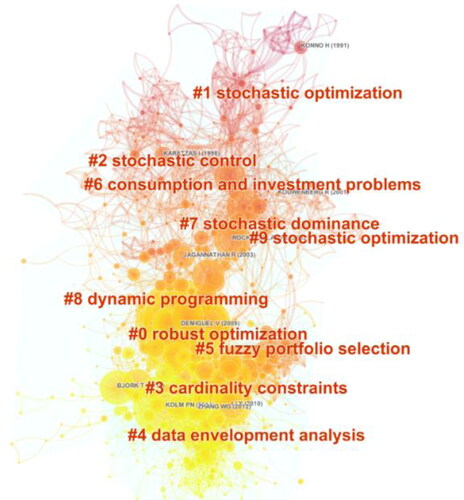
Table 6. The largest 10 clusters of portfolio optimization research.
listed that the top 15 most cited references izt cited documents from the 5767 documents retrieved. The cited references represent the knowledge of others that an article refers to and involves, which is the frontier of the article. It is clear that the author of the most cited references in is DeMiguel et al. (Citation2009b), and the author of this article ‘Optimal versus naïve diversification: How inefficient is the 1/N portfolio strategy?’ is cited 142 times and ranked first. Two articles are corresponding to the team of the author Demiguel who has made outstanding contributions to portfolio optimization has been used a total of 235 times in the record.
Table 7. Top 15 cited references for portfolio optimization research.
4.2. Burst detection
The references can be analysed to reflect the emerging trends of the research field, and the reference citation burst shows the attention to relevant literature. As shown in , there are 20 cited references with the strongest citation burst. It is obvious to see that all the citation bursts began in the late 1990s. The earliest reference with the strongest citation burst demonstrates that a portfolio optimization model using the L1 risk function (Konno & Yamazaki, Citation1991), followed by Cariño et al. (Citation1994) proposed an asset/liability management model suing multistage stochastic programming, Cvitanic and Karatzas (Citation1992) also set up stochastic control conditions for general portfolio problems, thereby constructing optimal portfolio strategies. The red lines represent the citation burst duration of each cited reference. These models are the research direction in 1994–2007, which present the divergent research direction of portfolio theory proposed by Markowitz, and provided a theoretical basis for further research.
Table 8. Top 20 cited references with the strongest citation burst.
In order to know the research field in recent years directly, which can use the setting of the parameter ‘Usage2013’ in CiteSpace, the emerging trends of keywords can be found in this paper. lists the top 12 keywords with the strongest citation bursts. Our finding indicates that the research topic is changing as time goes on. Different keywords with bursts reflect the research characteristic of different periods. The keyword ‘optimization’ was brought up again in 1990. From , we can know that most citation bursts occurred around the early 2000s when the types of keywords were relatively abundant, which represents a golden age when various investment portfolios research was put into practice. We can roughly divide the most explosive keywords in portfolio optimization into three periods according to . The first period is 1990–1996, at this time, long after the portfolio problem was raised, research on ‘optimization’ and ‘portfolio optimization’ began to appear. The second period is: 1995–2013, scholars' research perspectives began to gradually expand, including ‘consumption’, ‘arbitrage’, ‘contingent claim’, ‘asset allocation’ and ‘approximation’, which led to portfolio optimization research has been largely divergently supplemented. The third period is 2011–2021, this is a stage in which portfolio optimization research has achieved important innovations in recent years. It can be seen that the citation bursts of ‘algorithm’ have reached the largest 20.634, which shows that ‘algorithm’ is the core direction of the current stage. Implemented in the ‘allocation’ of the portfolio, ‘algorithm’, ‘algorithm optimization’ and ‘adaptation’ algorithms are the main theme of current portfolio optimization research. Portfolio optimization research can enter the field of intelligent algorithms in the field of artificial intelligence, which is a manifestation of multidisciplinary interaction, and intelligent algorithms have also proven their powerful functions in various practical processes.
Table 9. Top 12 keywords with the strongest citation bursts.
5. Evolutionary analysis
As aforementioned above, although CiteSpace has explored the development status and hotspots of portfolio optimization research from multiple angles, this also shows that the analysis results brought by CiteSpace analysis are not enough to specialize in a certain aspect of the research. Therefore, this paper analyses the topic through the main path analysis method subsequently. Since a single path may not reflect all the important content, but multiple main paths can capture more details, so that there has a more comprehensive understanding and summarizes the development process from different paths to discusses the evolution of knowledge. Considering a comprehensive analysis from the four main paths, such as the local forward path, local backward path, global standard path, and global critical path, all traversal accounts are calculated based on search path count (SPC) rulers. The direction of the arrow indicates the direction of knowledge flow and transfer.
Note that the four main path analysis ends in 2019 instead of 2021. According to the calculation process of the main path recognition algorithm, we give two explanations: (1) The time delay of the literature citation span. The citations of the literature in the recent two years are negligible compared to the past so that it is not included in the results by Pajek; (2) Defects of the software. Although there are 5767 articles, the total number of cited articles has reached hundreds of thousands. The relatively large amount of data makes the software calculation difficult so that the software will produce errors for the calculation of the data records in the recent two years. Another reminder to note that the number in front of each node document represents the order of this document in the database, and has no other practical significance.
5.1. Local forward main path
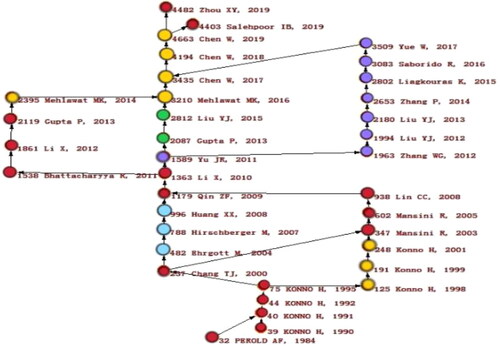
There are 31 papers on the local forward main path, which in presents the classical main path that spreads knowledge from a specific domain, helping researchers capture the backbone of knowledge. An interesting phenomenon can be seen in , where the author, Konno, almost covers the first half of the entire path. Although his name is not high in , his influence can be found in this field.
Figure 7. The local forward main path of portfolio optimization research.
Source: Pajek.
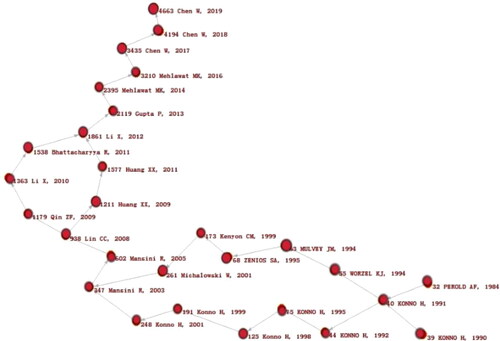
In one of the forks at the beginning of the path, Perold (Citation1984) improved the model and proposed a practical algorithm for large-scale mean-variance portfolio optimization, which can be effectively applied to practical applications; The other branch (Konno, Citation1990), a portfolio optimization model based on piecewise linear risk function is proposed, compared with the classical Markowitz's quadratic risk model, which is easy to understand and operate. A key node (Konno & Yamazaki, Citation1991) proved that the portfolio optimization model using the L1 risk function can eliminate most of the difficulties related to the classic Markowitz model while maintaining its advantages over the equilibrium model. The bifurcation began at this point, partly continued by the author Konno's continuous research in the field, these five articles published by Konno within ten years have further promoted the development of this field. For the model proposed above, Konno’s team started a series of works such as algorithm formulation to make crucial research extensions. Then partly related researchers began to join the field, they used portfolio optimization model to solve practical problems: A simulation optimization model was introduced to select a portfolio that tracks the index, the model used the metropolitan life insurance company as an example (Worzel et al., Citation1994); Empirical research on the problems faced by investment portfolios that include mortgage-backed securities in financial markets (Zenios, Citation1995); Kenyon et al. (Citation1999) proved a piecewise linear objective function portfolio optimization model and clarified that when the linear deviation is relative to the mean, any two parts of the linear objective function are equal to the mean absolute deviation theory.
The basic framework of portfolio optimization models has mainly been proposed at the end of the 20th century. Since the early 21st century, some applications of portfolio models have been broadly discussed to deal with practical issues. Mansini et al. (Citation2003) introduced a systematic overview of the linear programming solvable model. This model was very important for practical financial decision-making. In the decision-making, the investment portfolio must meet many constraints and consider transaction costs, and He had successively proposed a single-period mean safe portfolio selection problem with integer constraints of transaction costs and the number of security choices (Mansini & Speranza, Citation2005). Based on the Markowitz model, three possible models of the minimum transaction batch portfolio selection problem are given, and the corresponding genetic algorithm was designed to solve (Lin & Liu, Citation2008). In portfolio selection, expected return, risk, and liquidity cannot be accurately predicted. Investors usually decide their portfolios based on their own experience and economic wisdom. Therefore, deterministic portfolio selection is not a good choice for investors. In recent research, the fuzzy set theory (Bhattacharyya et al., Citation2011; Mansini & Speranza, Citation2005) was widely used in problem modeling in an uncertain environment. It was worth noting that there is a corresponding path here that reviewing the reliability measure for fuzzy portfolio selection, then proposed two minimax mean-variance models based on reliability (Huang, Citation2011). Under the framework of credibility theory, fuzzy portfolio selection had been widely studied. Considering the contradiction between the concept of risk diversification and concentrated investment in the classical portfolio selection theory, Li et al. (Citation2012) proposed a model of expected regret minimization.
In recent years, the model had become more perfect, many scholars tended to study the model in many aspects, especially the application of the intelligent algorithms in this field was more frequent. As can be seen from the second half of the path in , there are representatives of the improved algorithm (Chen et al., Citation2017; Citation2018; Mehlawat, Citation2016; Mehlawat & Gupta, Citation2014). From the local forward main path analysis, there will summarize some key points: the improvement and solution of the portfolio model have been widely explored in the early development. From the initial mean-variance model, adding multiple constraints to improve the application of the portfolio model and intelligent algorithms in this field, through empirical analysis, their effectiveness has been proved. It should be noted that there are some papers omitted in the path of , not that these papers are unimportant, but that is less representative than others, the view will be followed that more than one path can be identified from different perspectives. Some influential articles will be given in the following path analysis.
5.2. Local backward main path
The local backward main path in is the opposite of the local forward main path, which is a backward path from now to the past. To some extent, it will coincide with the local forward path, but the difference will be more obvious because it pays more attention to the works in the past decade. In this part of the analysis, the way of flashback will be used to fully show the local backward path. Compared with the positive narrative, a flashback may be a good idea.
Figure 8. The local backward main path of portfolio optimization research.
Source: Pajek.
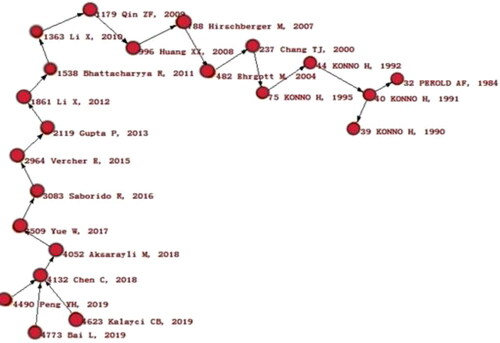
Three forks at the beginning of the local backward path. Kalayci et al. (Citation2019) provided a comprehensive literature review of portfolio optimization models and an overview of future research areas. This is a summative article with high citations in the local data. Peng et al. (Citation2019) discussed the effect of introducing nonlinear interaction and noise filtering into the covariance matrix of the Markowitz portfolio allocation model and conduct an empirical analysis. Bai et al. (Citation2019) further compared the performance of the innovative robust portfolio method with the traditional Markowitz method by analyzing the portfolio of China's renewable resources stocks. Chen et al. (Citation2018) was the fourth author on this path who relaxed the normal hypothesis of Markowitz's portfolio problem and introduced higher-order moments, namely skewness and kurtosis. Also, the concept of set ordered relation and robust concept were introduced to analyse and establish a robust multi-objective portfolio model with higher-order moments (Chen & Zhou, Citation2018). there can find that this scholar with his team had a certain influence on the latter part of the local forward path.
However, a very interesting image is that the authors' name does not appear in the previous analysis, but they play a key role in the main path analysis, which further shows that the main path analysis mainly depends on knowledge path and frontier research. Similarly, Aksaraylı and Pala (Citation2018) also introduced a new stock diversification model in Markowitz's modern portfolio theory, proposes a polynomial goal planning method based on the mean-variance-skewness kurtosis-entropy model. In the following article (Yue & Wang, Citation2017), considering the important influence of high-order moments on portfolio returns, the author uses the third and fourth-order moments to establish a fuzzy multi-objective portfolio selection model. According to the previous analysis, the research of high-order moments on the portfolio model belongs to a more popular direction. Intelligent algorithms are still the main tool of empirical research in this period.
It is not the earliest time that intelligent algorithms have been used. For example, the mean-downside risk-skewness model was used to design new mutation, crossover, and repair operators for evolutionary multi-objective optimization to find the feasible solution of the model (Saborido et al., Citation2016). In the remainder of the local backward main path analysis, compared with the local forward main path analysis, there are several identical nodes here. Huang (Citation2008) discussed portfolio selection in a fuzzy environment and proposed a genetic algorithm based on fuzzy simulation. Hirschberger et al. (Citation2007) tried a random generation of portfolio selection covariance matrix with specific distribution characteristics and improved the portfolio optimization model. Ehrgott et al. (Citation2004) added multiple parameters to extend the Markowitz mean-variance model and construct specific utility functions to seek the optimal solution through a numerical comparison of various algorithms. The effective boundary of the cardinality constraint was found by adding the cardinality constraint and combining the heuristic algorithm (Chang et al., Citation2000).
Since the last part of is the same as the local forward main path analysis above, which will not be repeated. Throughout the local forward and local backward main path analysis, analysing the above contrast can roughly determine the development in the field of portfolio optimization can be divided into three parts, one is in the late 20th century to the beginning of the model after contact research focused on the study of restrictions of the model and heuristic algorithm to develop and verify the validity of the model and algorithm; Secondly, in the early decade of the 21st century, many scholars focused their research on the application of optimization algorithm to find the optimal solution. Third, in recent years, due to the improvement of the model itself tends to be perfect, scholars focus on the multi-constraint, multi-algorithm, and practical application of the model.
5.3. Global standard main path
The obvious difference between the global standard main path and the partial backward main path analysis is that the latter uses the flashback method to analyse the knowledge dissemination in portfolio optimization research. In the global standard main path of new articles are very different from the local backward main path of . Therefore, the new article will be marked in green in .
Figure 9. The global standard main path of portfolio optimization research.
Source: Pajek.
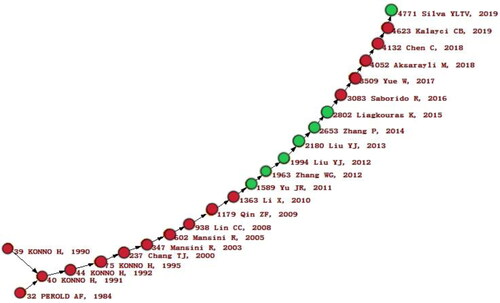
Figure 10. The global key-route main path of portfolio optimization research.
Source: Pajek.
Yu and Lee (Citation2011) determined the important design criteria of the portfolio model by considering five Portfolio rebalancing models including transaction cost, some or all criteria including risk, return, short selling, skewness, and kurtosis, to realize the flexibility in portfolio selection. Zhang et al. (Citation2012) further studied a multi-period portfolio selection problem with fuzzy returns under multiple criteria and established a possibilistic mean-semivariance-entropy model of multi-period portfolio selection, Liu et al. (Citation2012) also studied the multi-period portfolio selection problem under the multi-criteria fuzzy environment and designed the genetic algorithm to solve the optimal solution, the author also introduces interval variables in his next paper to study the ultimate wealth maximization of the portfolio (Liu et al., Citation2013). In the same model, Zhang and Zhang (Citation2014) added the risk control and cardinality constraints, designed the discrete approximate iteration method to deal with the dynamic optimization problem to obtain the optimal portfolio strategy, and proved the convergence of the method. Liagkouras and Metaxiotis (Citation2015) systematically studied the related technologies and multi-objective evolutionary algorithms to solve combinatorial optimization problems. It provided the best practice to deal with complex constrained combinatorial optimization. It should be noted that this is a pure technical flow article worth learning from. Silva et al. (Citation2019) showed a united multi-objective particle swarm optimization method and an adaptive ranking method based on three mechanisms, which proved the effectiveness of the proposed method for most of the multi-objective indicators considered by previous researchers.
In the above local backward path analysis, we summarize the broad scope of knowledge development. The global standard main path also confirms this. The four ways of this paper are different, but they complement each other from different angles and deepen the overall understanding and general direction of scholars the scholars who initially dabbled in the research. in this research.
5.4. Global key-route main path
There has been analysed in the previous article that although there are differences among the three paths, the general development context is the same, and the points with the largest weight in the path are not necessarily included. Also, the points with relatively large weight do not mean that the influence is also large. Similarly, the ones with smaller weights can also have a great influence in this field. To improve these shortcomings, Lu and Liu (Citation2013) proposed a critical routing master path to present more details in specific areas. The global key-route main path is displayed at size 20, and 37 papers appear in . By changing the search algorithm, the divergence-convergence structure of knowledge dissemination is retrieved from the complex citation network. As a result, three main paths mentioned above are all included in the global critical main path. The relative references are described in different colors. Such as, red for common paths or paths that have been analysed above, green for new articles, yellow for local forward main paths, blue for local backward main paths, and purple for global standard main paths. It's worth noting that there has a branch composed of two new articles appear, which exploit a small path. That is, Gupta et al. (Citation2013) established a multi-criteria credible framework for portfolio rebalancing this year and proposed a hybrid intelligent algorithm to solve portfolio rebalancing problems based on fuzzy goal programming. Subsequently, Liu and Zhang (Citation2015) considered a portfolio selection model with two objectives of ultimate wealth maximization and cumulative risk minimization.
What should be considered that in the entire critical main path diagram we slightly expand the path size resulting in almost covering the three main paths of the above and reflecting the previous three path analysis is more critical and a knowledge dissemination structure that roughly covers the entire field. Through the analysis of these four paths, we find that the influence of top scholars in this field is very important. For example, the team of two authors, Chen and Konno, who play an important role not only in in the number of publications but also in the path nodes.
6. Conclusions
In this paper, we present a bibliometric analysis that focuses on dynamic changes and multi-dimensional evolution of portfolio optimization research. Some key findings can be obtained based on citation analysis, co-citation analysis and citation burst detection. First, the publication number of portfolio optimization research has been growing quickly from 2005 to 2020, reaching 651 articles in 2020. It indicates an increasing number of scholars are paying attention to this research field. Second, China and the US are the most active and contributing countries in this research field. Also, through cluster analysis and burst detection, the references and keywords with the strongest citation bursts can be analysed to reflect the emerging trends and research directions of portfolio optimization research. It is found that more portfolio optimization studies were at an exploration stage from mean-variance analysis to consideration of multiple constraints. However, heuristic algorithms have become the driving force of portfolio optimization research in recent years. Multi-disciplinary analyses and applications are also the main trends of portfolio optimization research. By analysing the dynamic changes and multi-dimensional evolution in recent decades, we contribute to presenting some deep insights of the portfolio optimization research directly, which assists researchers especially beginners to comprehensively learn this research field.
However, there are still some limitations in this paper. For instance, portfolio optimization is a generalized concept, it is better to collect data with different related terms, limit the research topic, and determine the research field more clearly in further study. In sum, this paper provides an overall analysis of the status quo, emerging trends, and knowledge development path, which can help scholars better understand the development of this research field and more deep insights could be given for new explorations.
Disclosure statement
There is no economic or non-economic competing interest between the authors of this article.
Additional information
Funding
References
- Aksaraylı, M., & Pala, O. (2018). A polynomial goal programming model for portfolio optimization based on entropy and higher moments. Expert Systems with Applications, 94, 185–192. https://doi.org/10.1016/j.eswa.2017.10.056
- Anagnostopoulos, K. P., & Mamanis, G. (2011). The mean–variance cardinality constrained portfolio optimization problem: An experimental evaluation of five multiobjective evolutionary algorithms. Expert Systems with Applications, 38(11), 14208–14217.
- Artzner, P., Delbaen, F., Ebe, J. M., & Heath, D. (1999). Coherent measures of risk. Mathematical Finance, 9(3), 203–228. https://doi.org/10.1111/1467-9965.00068
- Bai, L., Liu, Y., Wang, Q., & Chen, C. (2019). Improving portfolio performance of renewable energy stocks using robust portfolio approach: Evidence from China. Physica A: Statistical Mechanics and Its Applications, 533, 122059. https://doi.org/10.1016/j.physa.2019.122059
- Basak, S., & Chabakauri, G. (2012). Dynamic hedging in incomplete markets: A simple solution. Review of Financial Studies, 25(6), 1845–1896. https://doi.org/10.1093/rfs/hhs050
- Baykasoğlu, A., Yunusoglu, M. G., & Özsoydan, F. B. (2015). A GRASP based solution approach to solve cardinality constrained portfolio optimization problems. Computers & Industrial Engineering, 90, 339–351. https://doi.org/10.1016/j.cie.2015.10.009
- Benítez-Andrades, J. A., García-Rodríguez, I., Benavides, C., Alaiz-Moretón, H., & Rodríguez-González, A. (2020). Social network analysis for personalized characterization and risk assessment of alcohol use disorders in adolescents using semantic technologies. Future Generation Computer Systems, 106, 154–170. https://doi.org/10.1016/j.future.2020.01.002
- Bertsimas, D., Brown, D. B., & Caramanis, C. (2011). Theory and applications of robust optimization. SIAM Review, 53(3), 464–501. https://doi.org/10.1137/080734510
- Bhattacharyya, R., Kar, S., & Majumder, D. D. (2011). Fuzzy mean–variance–skewness portfolio selection models by interval analysis. Computers & Mathematics with Applications, 61(1), 126–137. https://doi.org/10.1016/j.camwa.2010.10.039
- Bielecki, T. R., & Pliska, S. R. (1999). Risk-sensitive dynamic asset management. Applied Mathematics and Optimization, 39(3), 337–360. https://doi.org/10.1007/s002459900110
- Björk, T., Murgoci, A., & Zhou, X. Y. (2014). Mean–variance portfolio optimization with state‐dependent risk aversion. Mathematical finance: An International Journal of Mathematics. Statistics and Financial Economics, 24(1), 1–24.
- Cai, X., Teo, K. L., Yang, X., & Zhou, X. Y. (2000). Portfolio optimization under a minimax rule. Management Science, 46(7), 957–972. https://doi.org/10.1287/mnsc.46.7.957.12039
- Cariño, D. R., Kent, T., Myers, D. H., Stacy, C., Sylvanus, M., Turner, A. L., Watanabe, K., & Ziemba, W. T. (1994). The Russell-Yasuda Kasai model: An asset/liability model for a Japanese insurance company using multistage stochastic programming. Interfaces, 24(1), 29–49. https://doi.org/10.1287/inte.24.1.29
- Cariño, D. R., & Ziemba, W. T. (1998). Formulation of the Russell-Yasuda Kasai financial planning model. Operations Research, 46(4), 433–449. https://doi.org/10.1287/opre.46.4.433
- Chang, T. J., Meade, N., Beasley, J. E., & Sharaiha, Y. M. (2000). Heuristics for cardinality constrained portfolio optimization. Computers & Operations Research, 27(13), 1271–1302. https://doi.org/10.1016/S0305-0548(99)00074-X
- Chen, C. (2006). CiteSpace II: Detecting and visualizing emerging trends and transient patterns in scientific literature. Journal of the American Society for Information Science and Technology, 57(3), 359–377. https://doi.org/10.1002/asi.20317
- Chen, J., Meng, S., & Zhou, W. (2019). The exploration of fuzzy linguistic research: A scientometric review based on CiteSpace. Journal of Intelligent & Fuzzy Systems, 37(3), 3655–3669. https://doi.org/10.3233/JIFS-182737
- Chen, W., Wang, Y., Gupta, P., & Mehlawat, M. K. (2018). A novel hybrid heuristic algorithm for a new uncertain mean-variance-skewness portfolio selection model with real constraints. Applied Intelligence, 48(9), 2996–3018. https://doi.org/10.1007/s10489-017-1124-8
- Chen, W., Wang, Y., Zhang, J., & Lu, S. (2017). Uncertain portfolio selection with high-order moments. Journal of Intelligent & Fuzzy Systems, 33(3), 1397–1411. https://doi.org/10.3233/JIFS-17369
- Chen, C., & Zhou, Y. S. (2018). Robust multi-objective portfolio with higher moments. Expert Systems with Applications, 100, 165–181. https://doi.org/10.1016/j.eswa.2018.02.004
- Cuoco, D. (1997). Optimal consumption and equilibrium prices with portfolio constraints and stochastic income. Journal of Economic Theory, 72(1), 33–73. https://doi.org/10.1006/jeth.1996.2207
- Cvitanic, J., & Karatzas, I. (1992). Convex duality in constrained portfolio optimization. The Annals of Applied Probability, 2(4), 767–818. https://doi.org/10.1214/aoap/1177005576
- Dantzig, G. B., & Infanger, G. (1993). Multi-stage stochastic linear programs for portfolio optimization. Annals of Operations Research, 45(1), 59–76. https://doi.org/10.1007/BF02282041
- DeMiguel, V., Garlappi, L., Nogales, F. J., & Uppal, R. (2009a). A generalized approach to portfolio optimization: Improving performance by constraining portfolio norms. Management Science, 55(5), 798–812. https://doi.org/10.1287/mnsc.1080.0986
- DeMiguel, V., Garlappi, L., & Uppal, R. (2009b). Optimal versus naive diversification: How inefficient is the 1/N portfolio strategy. Review of Financial Studies, 22(5), 1915–1953. https://doi.org/10.1093/rfs/hhm075
- Dentcheva, D., & Ruszczynski, A. (2003). Optimization with stochastic dominance constraints. SIAM Journal on Optimization, 14(2), 548–566. https://doi.org/10.1137/S1052623402420528
- Djomba, J. K., & Zaletel-Kragelj, L. (2016). A methodological approach to the analysis of egocentric social networks in public health research: A practical example. Zdravstveno Varstvo, 55(4), 256–263. https://doi.org/10.1515/sjph-2016-0035
- Dohleman, B. S. (2006). Exploratory social network analysis with Pajek. Psychometrika, 71(3), 605–606. https://doi.org/10.1007/s11336-005-1410-y
- Ehrgott, M., Klamroth, K., & Schwehm, C. (2004). An MCDM approach to portfolio optimization. European Journal of Operational Research, 155(3), 752–770. https://doi.org/10.1016/S0377-2217(02)00881-0
- El Karoui, N., & Jeanblanc-Picqué, M. (1998). Optimization of consumption with labor income. Finance and Stochastics, 2(4), 409–440. https://doi.org/10.1007/s007800050048
- El Karoui, N., & Quenez, M. C. (1995). Dynamic programming and pricing of contingent claims. SIAM Journal on Control and Optimization, 33(1), 29–66. https://doi.org/10.1137/S0363012992232579
- Elton, E. J., Gruber, M. J., & Blake, C. R. (1996). The persistence of risk-adjusted mutual fund performance. The Journal of Business, 69(2), 133–157. https://doi.org/10.1086/209685
- Fernández, A., & Gómez, S. (2007). Portfolio selection using neural networks. Computers & Operations Research, 34(4), 1177–1191. https://doi.org/10.1016/j.cor.2005.06.017
- Gaigi, M. H., Vath, V. L., Mnif, M., & Toumi, S. (2016). Numerical approximation for a portfolio optimization problem under liquidity risk and costs. Applied Mathematics & Optimization, 74(1), 163–195. https://doi.org/10.1007/s00245-015-9311-7
- Garlappi, L., Uppal, R., & Wang, T. (2007). Portfolio selection with parameter and model uncertainty: A multi-prior approach. Review of Financial Studies, 20(1), 41–81. https://doi.org/10.1093/rfs/hhl003
- Goldfarb, D., & Iyengar, G. (2003). Robust portfolio selection problems. Mathematics of Operations Research, 28(1), 1–38. https://doi.org/10.1287/moor.28.1.1.14260
- Golub, B., Holmer, M., McKendall, R., Pohlman, L., & Zenios, S. A. (1995). A stochastic programming model for money management. European Journal of Operational Research, 85(2), 282–296. https://doi.org/10.1016/0377-2217(94)00038-E
- Gupta, P., Inuiguchi, M., Mehlawat, M. K., & Mittal, G. (2013). Multiobjective credibilistic portfolio selection model with fuzzy chance-constraints. Information Sciences, 229, 1–17. https://doi.org/10.1016/j.ins.2012.12.011
- Hirschberger, M., Qi, Y., & Steuer, R. E. (2007). Randomly generating portfolio-selection covariance matrices with specified distributional characteristics. European Journal of Operational Research, 177(3), 1610–1625. https://doi.org/10.1016/j.ejor.2005.10.014
- Huang, X. (2008). Mean-semivariance models for fuzzy portfolio selection. Journal of Computational and Applied Mathematics, 217(1), 1–8. https://doi.org/10.1016/j.cam.2007.06.009
- Huang, X. (2011). Minimax mean-variance models for fuzzy portfolio selection. Soft Computing, 15(2), 251–260. https://doi.org/10.1007/s00500-010-0654-3
- Hummon, N. P., & Dereian, P. (1989). Connectivity in a citation network: The development of DNA theory. Social Networks, 11(1), 39–63. https://doi.org/10.1016/0378-8733(89)90017-8
- Inuiguchi, M., & Ramı́k, J. (2000). Possibilistic linear programming: A brief review of fuzzy mathematical programming and a comparison with stochastic programming in portfolio selection problem. Fuzzy Sets and Systems, 111(1), 3–28. https://doi.org/10.1016/S0165-0114(98)00449-7
- Jorion, P. (2003). Portfolio optimization with tracking-error constraints. Financial Analysts Journal, 59(5), 70–82. https://doi.org/10.2469/faj.v59.n5.2565
- Kalayci, C. B., Ertenlice, O., & Akbay, M. A. (2019). A comprehensive review of deterministic models and applications for mean-variance portfolio optimization. Expert Systems with Applications, 125, 345–368. https://doi.org/10.1016/j.eswa.2019.02.011
- Karatzas, I., & Shreve, S. E. (2000). Methods of mathematical finance. Journal of the American Statistical Association, 95(450), 685.
- Kenyon, C., Savage, S., & Ball, B. (1999). Equivalence of linear deviation about the mean and mean absolute deviation about the mean objective functions. Operations Research Letters, 24(4), 181–185. https://doi.org/10.1016/S0167-6377(99)00011-5
- Kolm, P. N., Tütüncü, R., & Fabozzi, F. J. (2014). 60 Years of portfolio optimization: Practical challenges and current trends. European Journal of Operational Research, 234(2), 356–371. https://doi.org/10.1016/j.ejor.2013.10.060
- Konno, H. (1990). Piecewise linear risk function and portfolio optimization. Journal of the Operations Research Society of Japan, 33(2), 139–156. https://doi.org/10.15807/jorsj.33.139
- Konno, H., & Watanabe, H. (1996). Bond portfolio optimization problems and their applications to index tracking: A partial optimization approach. Journal of the Operations Research Society of Japan, 39(3), 295–306. https://doi.org/10.15807/jorsj.39.295
- Konno, H., & Yamazaki, H. (1991). Mean-absolute deviation portfolio optimization model and its applications to Tokyo stock market. Management Science, 37(5), 519–623. https://doi.org/10.1287/mnsc.37.5.519
- Kramkov, D., & Schachermayer, W. (1999). The asymptotic elasticity of utility functions and optimal investment in incomplete markets. Annals of Applied Probability, 9(3), 904–950.
- Liagkouras, K., & Metaxiotis, K. (2015). Efficient portfolio construction with the use of multiobjective evolutionary algorithms: Best practices and performance metrics. International Journal of Information Technology & Decision Making, 14(03), 535–564. https://doi.org/10.1142/S0219622015300013
- Lin, C. C., & Liu, Y. T. (2008). Genetic algorithms for portfolio selection problems with minimum transaction lots. European Journal of Operational Research, 185(1), 393–404. https://doi.org/10.1016/j.ejor.2006.12.024
- Li, X., Qin, Z., & Kar, S. (2010). Mean-variance-skewness model for portfolio selection with fuzzy returns. European Journal of Operational Research, 202(1), 239–247. https://doi.org/10.1016/j.ejor.2009.05.003
- Li, X., Shou, B., & Qin, Z. (2012). An expected regret minimization portfolio selection model. European Journal of Operational Research, 218(2), 484–492. https://doi.org/10.1016/j.ejor.2011.11.015
- Liu, Y. J., & Zhang, W. G. (2015). A multi-period fuzzy portfolio optimization model with minimum transaction lots. European Journal of Operational Research, 242(3), 933–941. https://doi.org/10.1016/j.ejor.2014.10.061
- Liu, Y. J., Zhang, W. G., & Xu, W. J. (2012). Fuzzy multi-period portfolio selection optimization models using multiple criteria. Automatica, 48(12), 3042–3053. https://doi.org/10.1016/j.automatica.2012.08.036
- Liu, Y. J., Zhang, W. G., & Zhang, P. (2013). A multi-period portfolio selection optimization model by using interval analysis. Economic Modelling, 33, 113–119. https://doi.org/10.1016/j.econmod.2013.03.006
- Lu, L. Y., & Liu, J. S. (2013). An innovative approach to identify the knowledge diffusion path: The case of resource-based theory. Scientometrics, 94(1), 225–246. https://doi.org/10.1007/s11192-012-0744-3
- Mansini, R., Ogryczak, W., & Speranza, M. G. (2003). On LP solvable models for portfolio selection. Informatica, 14(1), 37–62. https://doi.org/10.15388/Informatica.2003.003
- Mansini, R., & Speranza, M. G. (2005). An exact approach for portfolio selection with transaction costs and rounds. IIE Transactions, 37(10), 919–929. https://doi.org/10.1080/07408170591007821
- Markowitz, H. (1952). Portfolio selection. The Journal of Finance, 7(1), 77–91.
- Mehlawat, M. K. (2016). Credibilistic mean-entropy models for multi-period portfolio selection with multi-choice aspiration levels. Information Sciences, 345, 9–26. https://doi.org/10.1016/j.ins.2016.01.042
- Mehlawat, M. K., & Gupta, P. (2014). Credibility-based fuzzy mathematical programming model for portfolio selection under uncertainty. International Journal of Information Technology & Decision Making, 13(01), 101–135. https://doi.org/10.1142/S0219622014500059
- Metawa, N., Hassan, M. K., & Elhoseny, M. (2017). Genetic algorithm based model for optimizing bank lending decisions. Expert Systems with Applications, 80, 75–82. https://doi.org/10.1016/j.eswa.2017.03.021
- Mulvey, J. M., & Vladimirou, H. (1992). Stochastic network programming for financial planning problems. Management Science, 38(11), 1642–1685. https://doi.org/10.1287/mnsc.38.11.1642
- Ogryczak, W., & Ruszczyński, A. (1999). From stochastic dominance to mean-risk models: Semideviations as risk measures. European Journal of Operational Research, 116(1), 33–50. https://doi.org/10.1016/S0377-2217(98)00167-2
- Paiva, F. D., Cardoso, R. T. N., Hanaoka, G. P., & Duarte, W. M. (2019). Decision-making for financial trading: A fusion approach of machine learning and portfolio selection. Expert Systems with Applications, 115, 635–655. https://doi.org/10.1016/j.eswa.2018.08.003
- Peng, Y., Albuquerque, P. H. M., do Nascimento, I. F., & Machado, J. V. F. (2019). Between nonlinearities, complexity, and noises: An application on portfolio selection using kernel principal component analysis. Entropy, 21(4), 376. https://doi.org/10.3390/e21040376
- Perold, A. F. (1984). Large-scale portfolio optimization. Management Science, 30(10), 1143–1160. https://doi.org/10.1287/mnsc.30.10.1143
- Pikovsky, I., & Karatzas, I. (1996). Anticipative portfolio optimization. Advances in Applied Probability, 28(4), 1095–1122. https://doi.org/10.2307/1428166
- Rockafellar, R. T., & Uryasev, S. (2002). Conditional value-at-risk for general loss distributions. Journal of Banking & Finance, 26(7), 1443–1471. https://doi.org/10.1016/S0378-4266(02)00271-6
- Rockafellar, R. T., Uryasev, S., & Zabarankin, M. (2007). Equilibrium with investors using a diversity of deviation measures. Journal of Banking & Finance, 31(11), 3251–3268. https://doi.org/10.1016/j.jbankfin.2007.04.002
- Saborido, R., Ruiz, A. B., Bermúdez, J. D., Vercher, E., & Luque, M. (2016). Evolutionary multi-objective optimization algorithms for fuzzy portfolio selection. Applied Soft Computing, 39, 48–63. https://doi.org/10.1016/j.asoc.2015.11.005
- Sharpe, W. F. (1963). A simplified model for portfolio analysis. Management Science, 9(2), 277–349. https://doi.org/10.1287/mnsc.9.2.277
- Silva, Y. L. T., Herthel, A. B., & Subramanian, A. (2019). A multi-objective evolutionary algorithm for a class of mean-variance portfolio selection problems. Expert Systems with Applications, 133, 225–241. https://doi.org/10.1016/j.eswa.2019.05.018
- Speranza, M. G. (1993). Linear programming models for portfolio optimization. Finance, 14, 107–123.
- Tu, J., & Zhou, G. (2011). Markowitz meets Talmud: A combination of sophisticated and naive diversification strategies. Journal of Financial Economics, 99(1), 204–215. https://doi.org/10.1016/j.jfineco.2010.08.013
- Van Eck, N. J., & Waltman, L. (2010). Software survey: VOSviewer, a computer program for bibliometric mapping. Scientometrics, 84(2), 523–538. https://doi.org/10.1007/s11192-009-0146-3
- Wang, X. X., Chang, Y. R., Xu, Z. S., Wang, Z. D., & Kadirkamanathan, V. (2021a). 50 Years of international journal of systems science: A review of the past and trends for the future. International Journal of Systems Science, 52(8), 1515–1538. https://doi.org/10.1080/00207721.2020.1862937
- Wang, X. X., Xu, Z. S., & Skare, M. (2020). A bibliometric analysis of Economic Research-Ekonomska istraživanja (2007-2019). Economic Research-Ekonomska Istraživanja, 33(1), 865–886. https://doi.org/10.1080/1331677X.2020.1737558
- Wang, X. X., Xu, Z. S., Su, S.-F., & Zhou, W. (2021b). A comprehensive bibliometric analysis of uncertain group decision making from 1980 to 2019. Information Sciences, 547, 328–353. https://doi.org/10.1016/j.ins.2020.08.036
- Woodside-Oriakhi, M., Lucas, C., & Beasley, J. E. (2011). Heuristic algorithms for the cardinality constrained efficient frontier. European Journal of Operational Research, 213(3), 538–550. https://doi.org/10.1016/j.ejor.2011.03.030
- Worzel, K. J., Vassiadou-Zeniou, C., & Zenios, S. A. (1994). Integrated simulation and optimization models for tracking indices of fixed-income securities. Operations Research, 42(2), 223–233. https://doi.org/10.1287/opre.42.2.223
- Xu, Z., Zhou, W., & Baltrėnaitė, E. (2019). Comprehensive bibliometric study of journal of environmental engineering and landscape management from 2007 to 2019. Journal of Environmental Engineering and Landscape Management, 27(4), 215–227. https://doi.org/10.3846/jeelm.2019.11366
- Young, M. R. (1998). A minimax portfolio selection rule with linear programming solution. Management Science, 44(5), 673–741. https://doi.org/10.1287/mnsc.44.5.673
- Yue, W., & Wang, Y. (2017). A new fuzzy multi-objective higher order moment portfolio selection model for diversified portfolios. Physica A: Statistical Mechanics and Its Applications, 465, 124–140. https://doi.org/10.1016/j.physa.2016.08.009
- Yu, J. R., & Lee, W. Y. (2011). Portfolio rebalancing model using multiple criteria. European Journal of Operational Research, 209(2), 166–175. https://doi.org/10.1016/j.ejor.2010.09.018
- Yu, D. J., & Liao, H. C. (2016). Visualization and quantitative research on intuitionistic fuzzy studies. Journal of Intelligent & Fuzzy Systems, 30(6), 3653–3663. https://doi.org/10.3233/IFS-162111
- Yu, D. J., Li, D. F., Merigó, J. M., & Fang, L. C. (2016). Mapping development of linguistic decision making studies. Journal of Intelligent & Fuzzy Systems, 30(5), 2727–2736. https://doi.org/10.3233/IFS-152026
- Zenios, S. A. (1995). Asset/liability management under uncertainty for fixed-income securities. Annals of Operations Research, 59(1), 77–97. https://doi.org/10.1007/BF02031744
- Zenios, S. A., & Kang, P. (1993). Mean-absolute deviation portfolio optimization for mortgage-backed securities. Annals of Operations Research, 45(1), 433–450. https://doi.org/10.1007/BF02282062
- Zhang, W. G., Liu, Y. J., & Xu, W. J. (2012). A possibilistic mean-semivariance-entropy model for multi-period portfolio selection with transaction costs. European Journal of Operational Research, 222(2), 341–349. https://doi.org/10.1016/j.ejor.2012.04.023
- Zhang, P., & Zhang, W. G. (2014). Multiperiod mean absolute deviation fuzzy portfolio selection model with risk control and cardinality constraints. Fuzzy Sets and Systems, 255, 74–91. https://doi.org/10.1016/j.fss.2014.07.018
- Zhou, W., Luo, D., Fang, H., Gou, X., & Chen, J. (2020). Bibliometric overview and retrospective analysis of fund performance research between 1966 and 2019. Economic research-Ekonomska Istraživanja, 33(1), 1510–1537. https://doi.org/10.1080/1331677X.2020.1755879
- Zhou, W., Xu, Z., & Zavadskas, E. K. (2019). A bibliometric overview of the International Journal of Strategic Property Management between 2008 and 2019. International Journal of Strategic Property Management, 23(6), 366–377. https://doi.org/10.3846/ijspm.2019.10535
- Zhu, S., & Fukushima, M. (2009). Worst-case conditional value-at-risk with application to robust portfolio management. Operations Research, 57(5), 1155–1168. https://doi.org/10.1287/opre.1080.0684