
 ?Mathematical formulae have been encoded as MathML and are displayed in this HTML version using MathJax in order to improve their display. Uncheck the box to turn MathJax off. This feature requires Javascript. Click on a formula to zoom.
Abstract
This paper investigates systemic risk in Chinese financial industries by constructing a vine copula grouped CoVaR model, which accounts for the fact that various sub-industries are comprised of multiple financial institutions. The backtesting results indicate that the vine copula grouped model performs better in measuring the systemic risk in comparison to the vine copula model, which in turn validates the accuracy and effectiveness of the former. Moreover, the results indicate that banking is a major systemic risk contributor, even though it has a strong ability to resist risk. Additionally, the potential loss faced by the securities industry is big, but its systemic risk contribution is small. These results are of significance to investment decision and risk management.
1. Introduction
The development of economic globalisation and financial integration has deepened the degree to which all countries have opened up (Živkov et al., Citation2021). Due to their important role in the world economy, China’s financial industries also adopted integrated operations, which strengthened the interdependence among them. However, this mode of operation also promotes the spread of financial risks, thereby rendering the characterisation of relationships among financial markets more critical. Accordingly, this paper focuses on describing the interdependence among Chinese inter-industry financial institutions. Then an empirical analysis of the systemic risk in Chinese financial industries is conducted through the construction of the vine copula grouped model. The results may provide new insights for dealing with systemic financial risk and facilitate the effective provision of financial services to the real economy (Kim & Upneja, Citation2021; Law et al., Citation2018).
We propose the use of the vine copula grouped model to investigate the interdependence among financial institutions in multiple industries and construct the vine copula grouped CoVaR model to derive a systemic risk measurement method. The major contributions of this paper are as follows. First, taking into account the fact that China’s financial industries contain several institutions, we calculate the CoVaR based on the vine copula grouped model. It extends the research on measuring systemic risk from the perspective of multivariate dependence relationships. Second, the method of this paper is applied to study the systemic risk among banking, securities, and insurance industries in China’s financial market, and the CoVaR results of the corresponding industries are provided. Thus, the main sender and receiver of the systemic risk would be regulated differently.
The remainder of the paper is organised as follows. Section 2 presents the literature review. Section 3 discusses systemic risk in terms of bivariate copulas and vine copulas, and explains the vine copula grouped approach to CoVaR. Section 4 describes the data. Section 5 analyses the empirical results. Finally, Section 6 presents conclusions and policy implications.
2. Literature review
Presently, there are several studies related to systemic financial risk, such as the extension of Gini’s methodology (Hou & Wang, Citation2020) and the examination of switching regime copula (Mensi et al., Citation2020). However, there is no consensus on the definition of systemic financial risk. It is thus necessary to further explore systemic risk (Tang et al., Citation2021). Adrian and Brunnermeier (2016) defined systemic financial risk as the risk of the intermediation capacity of the entire financial system malfunctioning, which would result in potentially adverse consequences for the supply of credit to the real economy. The assessment of systemic risk is mainly based on balance sheet data and market data. Market data is often used to analyse market risk because of its sensitivity to changes in market conditions. VaR is the most common measure to quantify financial risk based on market data. However, given the definition of systemic risk, it is obvious that its measurement should not only focus on its impact on the whole system, but also describe how the impact is transmitted within the financial system.
Adrian and Brunnermeier (2016) developed a new measure for systemic risk: Conditional Value at Risk (CoVaR)—the VaR of the financial system conditional on institutions being under distress. Girardi and Ergün (Citation2013) generalised this definition by assuming that the conditioning financial distress event refers to another industry’s (j) returns being at most at its VaR rather than merely equal
Mainik and Schaanning (Citation2014) demonstrated that the generalised CoVaR has useful properties, enabling backtesting to accurately measure financial systemic risk through a modified version of the standard Kupiec test (Kupiec, Citation1995). Various measures of calculating CoVaR are found in the literature. Whereas Adrian and Brunnermeier (2016) used a quantile regression method, Girardi and Ergün (Citation2013) constructed a multivariate GARCH model to estimate the CoVaR of financial institutions under the assumption that innovation follows a Gaussian distribution and skewed Student-t distribution, which relies on the correct marginal specification. Unfortunately, simple linear analysis cannot fully incorporate the distribution characteristics of financial data and the nonlinear dependence of China’s financial industries, which leads to a large deviation in the estimation of CoVaR. Therefore, it is important to explore how to comprehensively describe the nonlinear dependence structure among the financial industries and improve the accuracy of systemic risk measurement.
The binary copula function can connect the marginal distribution functions with the joint distribution function of two random variables, which contains all the dependent information of random variables (Nelsen, Citation2006). Considering that the co-movement of economic growth and stock return may have dynamic characteristics, Jiang (Citation2019) applied a time-varying copula model to derive the dynamic correlation of stock index return and GDP growth rate in the U.S. and China. According to three models based on different types of copulas, Szetela et al. (Citation2019) calculated default probabilities for 42 European countries. The multivariate copula function has too few parameters when modelling the dependent structure of more than two variables, which limits its accuracy. Bedford and Cooke (2001) proposed a vine structure model for random dependent variable, which allows high-dimensional joint distributions to be decomposed into a set of bivariate copulas by copula specifications with different dependence features. Copula functions have been widely applied in the study of systemic risk measures. Mainik and Schaanning (Citation2014) derived the initial representations of the generalised CoVaR in terms of copulas. Then, Reboredo and Ugolini (Citation2015a) applied the CoVaR-copula model to investigate the systemic risk of the European sovereign debt market before and after the Greek debt crisis. This model has since been used to investigate renewable energy stock prices, exchange rates, and the oil market (Liu et al., Citation2017; Reboredo, Citation2015; Reboredo et al., Citation2016). With respect to multivariate dependence, Reboredo and Ugolini (Citation2016) investigated the systemic risk of Spanish listed banks using the vine copula and CoVaR models. The models were also adopted to analyse the structure of dependence and risk among four precious metals (Reboredo & Ugolini, Citation2015b). Uddin et al. (Citation2018) comprehensively analysed multivariate dependence and risk spillovers across energy markets using the C-vine copula and CoVaR models, and found greater exposure to losses arising from investments specifically in the heating oil and gas markets. Shahzad et al. (Citation2018) analysed the systemic risk of Islamic equity markets using vine copulas and delta CoVaR models. They found large downside spillover effects and systemic risk in the DJ Islamic Financial World and the USA Islamic indices. Karimalis and Nomikos (Citation2018) studied the systemic risk contribution of large European banks by copula functions to compare the CoVaR and the generalised CoVaR. Taking the structural changes of dependence into account, Ji et al. (Citation2019) measured the upside and downside CoVaRs between WTI crude oil and the exchange rates of the United States and China by using six time-varying copula models.
Arbenz et al. (Citation2012) specified a multivariate dependence structure by sample reordering for high-dimensional risk aggregation, which deployed different bivariate copulas. Accordingly, Zhou et al. (Citation2016) proposed a copula-based grouped model to characterise the intragroup and intergroup dependence of the financial system constituted by two industries. Nevertheless, the bivariate copulas inadequately model the complicated interdependent relationship among financial industries, which are divided into several groups that each contain multiple financial institutions. Chen and Hao (Citation2018) developed the vine copula grouped model to measure financial risk while incorporating the financial institutions with industries.
Although these studies attained improved results with respect to the measurement of financial risk, they only used a certain copula or vine copula to describe the dependent relationship of cross-industry risks. Even considering that various sub-industries are comprised of multiple financial institutions, little attention has been paid to the effect of this fact on measuring systemic risk. This paper proposes using the vine copula grouped model to investigate the interdependence among financial institutions in multiple industries and constructs the vine copula grouped CoVaR model to derive a method to measure systemic risk. This enables the measurement of the risk spillover effects of multiple financial industries or the financial system. The empirical results present a positive reference for the investigation of risk spillovers and the formulation of risk regulatory policies in China’s cross-industry financial institutions.
3. Methodology
3.1. Copulas and CoVaR
Sklar (Citation1959) used the word “copula” in the mathematical or statistical sense. Sklar’s theorem pointed out that copula function is a function that “connects” univariate distribution functions to form multivariate distribution functions.
Let be a 2-dimensional random vector and let
be its joint distribution, i.e.,
Sklar’s theorem states that there must exist a copula function
on
such that
(1)
(1)
where
and
are the marginal distribution of
Then
is a bivariate copula with uniform marginal distributions.
Different systemic risk measures have been proposed in the literature. Adrian and Brunnermeier (2016) proposed CoVaR to quantify the effect of a potentially distressed financial institution on other financial institutions or the whole financial system. Let be the returns of an institution (or financial system) and
be the returns of another financial institution.
is defined by the conditional distribution for a confidence level
and at time
(2)
(2)
where
denotes the VaR of the financial institution
measuring the maximum loss that financial institution
may experience for a confidence level
and a specific time horizon.
3.2. CoVaR with copulas
To quantify the systemic risk of Chinese financial industries, the generalised CoVaR was evaluated to measure systemic risk as the impact of one distressed industry on another financial industry or the financial system. In our study, the generalised CoVaR is the VaR of the financial system or a certain financial industry conditional on another financial industry in financial distress. Specifically, let be the returns of one of the financial industries (or the financial system) and
be the returns of another financial industry. The CoVaR of industry
(or system), for a
confidence level and time
can be formally defined as follows:
(3)
(3)
where
denotes the VaR of the financial industry j, which measures the maximum loss that financial industry j may experience for a confidence level
and a specific time horizon. In statistical terms, the CoVaR of the financial industry i (or financial system) is the
-quantile of a conditional distribution. Thus, the calculation of CoVaR is equivalent to solve an unconditional bivariate distribution expressed as EquationEquation (4)
(4)
(4)
(4)
(4)
or alternatively
(5)
(5)
Incorporating the dependent relationships in terms of copulas, EquationEquation (5)(5)
(5) can be rewritten as
(6)
(6)
where
and
are the marginal distributions of industry i and j respectively. Thus, CoVaR in EquationEquation (6)
(6)
(6) can be estimated through copulas in a two-step procedure (Reboredo & Ugolini, 2015b).
Furthermore, delta CoVaR () represents the systemic risk contribution of a particular industry j to another industry or system. It is defined as the difference between the VaR of industry i (or system) conditional on the distressed state of industry j (
) and the VaR of industry i (or system) conditional on the normal state of industry j, i.e.,
(Adrian & Brunnermeier, 2016; Girardi & Ergün, Citation2013). The systemic risk contribution of industry j is thus formulated as
(7)
(7)
3.3. Estimation and backtesting
In this section, we demonstrate how the vine copula grouped model can be used to estimate the CoVaR of an industry. Firstly, the marginal model for financial returns is specified as an AR-GARCH model with different residual distributions, which is able to capture the features of returns such as fat tails, asymmetry, and volatility clustering. Secondly, we provide the procedure for constructing a vine copula grouped model and computing CoVaRs. Finally, we backtest the accuracy of the CoVaRs based on the vine copula grouped model.
3.3.1. Marginal distribution
To capture the usual features of financial return distributions such as fat tails, asymmetry, and volatility clustering effects, we used the AR-GARCH model to construct their marginal distributions, in which the Student-t distribution, skewed Student-t distribution, generalised error distribution, and the skewed generalised error distribution are alternative distributions of the standard innovation. The AR(1)-GARCH(1, 1) model is
(8)
(8)
(9)
(9)
(10)
(10)
where
and
are the returns on day-t and the previous day;
is the unconditional mean value of
is the conditional covariance of
is the residual which follows the aforementioned four different distributions. The advantage of the alternative residual distributions assumption is that the distributional features of the returns of financial institutions can be characterised flexibly.
3.3.2. CoVaR with vine copula grouped model
To accurately estimate the CoVaR, it is necessary to characterise the dependence among the Chinese financial industries. Due to different industries individually consisting of corresponding financial institutions, Chen and Hao (Citation2018) modelled dependence via the vine copula grouped model instead of the vine copula model. Specially, they firstly grouped the financial institutions according to their industries. Then, the vine copula was used to describe the dependence among the institutions in each group, and the returns of the institutions in each group were summed to obtain each group’s industry’s returns. Finally, using the vine copula model, the dependence structure among the industries was derived. Then, the financial system returns were obtained by summing the industries’ returns. illustrates the structure of the vine copula grouped model. For detailed information about this model, see Chen and Hao (Citation2018) study.
Figure 1. The structure of the vine grouped model.
Source: Authors.
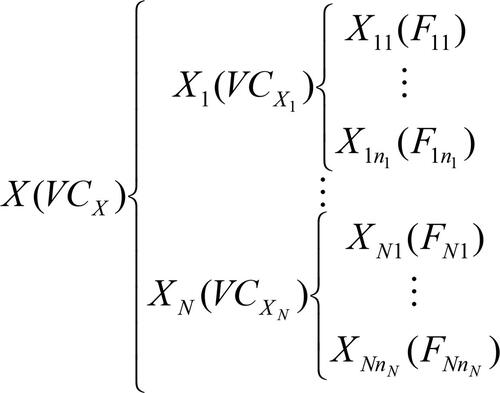
In , represents the vine copula structure among the vectors
..,
in each group, and
..,
are the corresponding distribution functions.
is the sum of the variables from the
group, and
are the vine copulas of the variables from the
group. Similarly,
and
denote the sum and the vine copula of variables
respectively. In fact, the dependent relationship among the different financial industries expressed by
belongs to the intergroup relationship, whereas the relationship among financial institutions in a particular industry represented by
belongs to the intragroup relationship. The two kinds of dependent relationships are usually significantly different. Since there are more than two industries in the Chinese financial market and each industry contains different financial institutions, the vine copula grouped model is applied to characterise their complicated dependencies.
In comparison to the traditional methods, the vine copula grouped model can describe the dependency of multivariate random variables in a more detailed and flexible manner. First, the marginal distribution of random variables in this model can be set arbitrarily, and the only restriction is that the random variables in each group should belong to the same financial industry, which makes the sum of the variables in the group easy to explain. Second, vine copula is used to describe the dependence of variables within each group and among groups, which only involves binary copulas rather than multivariate ones. Thus, the flexibility of describing the dependence of variables within and among groups is greatly improved. Third, based on the simulation algorithm of Arbenz et al. (Citation2012), the vine copula grouped model introduces dependence into originally independent marginal samples through reordering. Therefore, this model successfully combines intra-dependence and inter-dependence. This model can be used as a dimensionality reduction tool to study the dependence among the different categories of risk (Chen & Hao, Citation2018).
It is obvious that the estimation of the copula function in EquationEquation (6)(6)
(6) is the critical factor for measuring systemic financial risk. Since the literature ignores that financial industries comprise multiple financial institutions, neither the bivariate copula nor the vine copula can accurately describe their complicated dependence relationship. Recognising that there are financial institutions within different industries, Chen and Hao (Citation2018) constructed the vine copula grouped model to accurately describe the dependence among financial institutions in different industries. The accuracy of the VaR was significantly improved by the vine copula grouped model. Based on its superiority with respect to characterising the dependent structure, we applied the vine copula grouped model to ascertain systemic financial risk. Specifically, in order to measure the risk contribution of one financial industry to another, the copula in EquationEquation (6)
(6)
(6) can be acquired from the vine copula grouped model
(see ), which is distinguished from the vine copula model. Also, we can ascertain the dependence relationships between one of the industries
and the financial system
(see ) by modelling copula functions. Thus, we obtain the CoVaR based vine copula grouped model. To analyse the risk spillover effect of a specific industry on the Chinese financial system, we recomputed the system while excluding this industry, thereby removing its direct impact on the Chinese financial system (see Reboredo & Ugolini, Citation2016). Accordingly, the CoVaR of a specific industry (or financial system) conditional on another distressed industry was calculated utilising the vine copula grouped model. The CoVaR will obtain better results only when the copula function in EquationEquation (6)
(6)
(6) is accurately estimated.
3.3.3. Backtesting the generalized CoVaR
Generalising the CoVaR definition from EquationEquation (2)(2)
(2) to EquationEquation (3)
(3)
(3) facilitates the backtesting of the CoVaR estimates, as it is quite straightforward to apply the unconditional coverage test proposed by Kupiec (Citation1995).
The assumption is that the sample includes observations with
Comparing ex-ante VaR forecasts with ex-post losses, the “hit sequence” of violations is defined as:
(11)
(11)
Analogously, for the sub-sample with
observations, when industry j is in financial distress, the second “hit sequence”, which compares the past ex-ante CoVaR forecasts with the past ex-post losses of the another industry (or the financial system), is constructed as:
(12)
(12)
To evaluate the performance of the CoVaR, Kupiec’s (Citation1995) unconditional coverage test was applied to the second “hit sequence”. The hypothesis to test for unconditional coverage is
(13)
(13)
specially testing whether the average violation
is equal to the coverage ratio
The likelihood ratio test of Kupiec (Citation1995) on the difference between the excepted and observed number of VaR follows a
distribution. The likelihood ratio test statistic is specified as
(14)
(14)
where
is the number of violations for CoVaR that satisfies
(or both
and
). Therefore
is the empirical hit ratio for the CoVaR in the sub-sample
4. Data
To empirically examine the systemic risk of Chinese financial industries, we utilised daily stock closing prices of banking, securities, and insurance industries (15, 15, and 3 listed companies, respectively; see ). The sample period spanned from 15 August 2011 to 15 June 2018. This covered a total of 7 years and 1662 daily observations. All data was collected from the iFinD Database. For our analysis, we used log-returns that are calculated as where
is the daily closing price of stock i at time t.
Table 1. Names and industry classifications of Chinese financial institutions.
To assess the distributional characteristics of the log-return data, we first examined some descriptive statistics and statistic tests, which are reported in Panel A of .
Table 2. Descriptive statistics and correlations matrix for returns of Chinese financial industries.
The daily log-returns have average values close to zero with varying standard deviations, indicating dispersion in volatility behavior across industries. The banking industry has the smallest variability compared to the other two industries, which is consistent with what we know about the stable development of Chinese banking. Also, the banking industry displays less extreme maxima and minima than the others. Furthermore, skewness is positive for insurance and negative for banking and securities, indicating that large positive returns are more likely in the former. The excess kurtosis estimate is above zero for each industry, meaning that the returns follow a leptokurtical distribution, with heavier tails than the normal distribution. This is verified by the Jarque-Bera statistic test. In addition, the Ljung-Box Q statistics and the ARCH effect for the return series reveal strong evidence of autocorrelation and heteroskedasticity, justifying the application of the AR-GARCH model. The correlation matrix reported in (Panel B) indicates strong dependence among the three industries, which is consistent with the vine copula structure in .
Table 4. Estimates for the copula models for the Chinese financial industries and the financial system.
5. Analysis
In the literature, dependence structure models have been investigated by measuring the VaR and the ES (see Zhang et al., Citation2014). In this section, we investigate the effect of the vine copula grouped model and the vine copula model on the calculation of the CoVaR. We then compare the performance of these two models by the p values of backtesting the CoVaR.
5.1. Marginal model results
A preliminary analysis of indicates that the financial industries have the typical characteristics of non-normal distribution and ARCH effect. Then, we utilised the AR-GARCH model with different alternative distributions of residual series, i.e., the Student-t distribution (std), skewed Student-t distribution (sstd), generalised error distribution (ged) and the skewed generalised error distribution (sged). indicates the most adequate distribution of residual series of the three industries, and also shows the estimation results of the AR-GARCH model according to the Akaike information criterion (AIC).
Table 3. The distributions of the residuals and parameter estimates for the marginal distribution models.
Based on the industries they belong to, the sample institutions were grouped into either banking, securities, or insurance. The daily log-returns of the three industries exhibit fat-tail features. The distributions that the residuals follow are reported in .
indicates that the daily log-returns of each industry represent the non-normal and leptokurtic features with subtle differences in skewness. The assumption distributions of the residuals should not be limited to one type as in some of the literature. Therefore, we used the different distributions as alternative distributions, and selected the optimal distribution to describe the characteristics for each institution and each grouped industry. The marginal model estimates of each industry are also displayed in . The estimated parameters are significant at a significance level of 5% in most cases. Volatility is persistent among the industries. Consistent with the descriptive statistics in , the estimated degrees of freedom and symmetry parameter values for the skewed Student-t distribution indicate that all residual series are fat-tail and asymmetric, except for securities. This empirically substantiates the usefulness of the skewed Student-t distribution as an alternative distribution in modelling asymmetries in the marginals. The last column in the table displays the results of the goodness-of-fit tests for marginal model. The p values of the Ljung-Box test applied to the squared residuals indicate that there is no existence of a nonlinear autocorrelation (heteroscedasticity) in the residuals of the marginal models. This provides reasonable evidence for the selection of the AR-GARCH models to marginal distribution modelling. We tested whether the distributions of the standardised residuals follow the uniform distribution between 0 and 1. In general, the goodness-of-fit tests demonstrate that the marginal distribution models are not mis-specified, suggesting that the vine copula grouped model can correctly analyse the dependence among the examined Chinese financial industries.
5.2. Vine copula grouped model results
Based on the estimated marginal distributions, this section estimates the joint distribution, i.e., the intragroup and intergroup dependency structures. presents the results for the vine copula among the three industriesFootnote1, while presents the bivariate copula results between each industry and the system. It presents the optimal copulas and the parameter estimates according to the AIC and the maximum likelihood methods, respectively.
The dependence among the three industries is presented in (Panel A). The dependence structure among the three industries is dominated by insurance, which comports with the correlation matrix shown in (Panel B). The t copula functions with different parameters describe the relations among the three industries, indicating the existence of symmetric and fat-tail dependence. The bivariate copula results for each industry and the financial system (recomputed each time to exclude the corresponding industry) are reported in Panel B of . The t copulas are found to be most suitable for the banking-system, securities-system and insurance-system, indicating that the system has strong tail dependence with the three industries. This comports with China’s situation. Considering the impact of tail dependence on systemic risk, we measured the CoVaR values of the system conditional on the three industries.
5.3. CoVaR results
We first analysed the systemic risk for each of the examined financial industries, followed by the systemic risk of each of the examined financial industries.
5.3.1. The CoVaR between financial industries
We computed the VaR, CoVaR, and CoVaR values at a 95% confidence level (
) based on the vine copula grouped model. displays graphical evidence of the dynamics and size of the VaR and CoVaR values for the three industries over the sample period, whereas reports the VaR, CoVaR, and
CoVaR values.
Figure 2. Time series plots of VaR and CoVaR for the three financial industries.
Source: Authors.
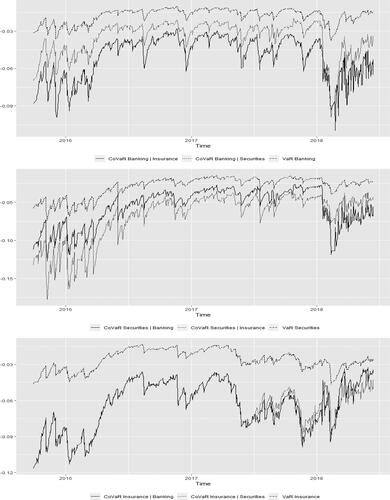
Table 5. VaR, CoVaR and CoVaR for the three financial industries with the vine copula grouped model.
reflects the VaR and CoVaR dynamics for the three financial industries. The VaR and CoVaR values follow the same trend in all industries, although the differences in magnitude increase around the onset of the Chinese stock market crash. The lines of the CoVaRs is under the lines of VaRs for each industry. This can be attributed to high co-movement among the banking, securities, and insurance industries.
The CoVaR value for each industry significantly differs from the VaR value, indicating that each industry’s exposure to risk is greater than the industry’s own risk. Specifically, given their mutual dependence, banking is more affected by insurance than securities. The systemic risk of securities is substantially influenced by insurance, which also comports with the unconditional dependence shown in . In addition, banking and securities have a similar and limited systemic risk impact on each other. This finding also comports with the conditional dependence between banking and securities displayed in . Finally, insurance receives an almost equally strong systemic impact from banking and securities.
In summary, our results on systemic risk indicate that the influence of each industry on the others varies. One exception is that there is little difference in the extreme impact of any industry on insurance, which plays a preponderant role in receiving and transmitting systemic risk. Our results also suggest that banking is characterised by lower systemic risks, which comports with the stable development of Chinese banking.
5.3.2. The CoVaR between the financial industries and the financial system
Significant differences exist in describing the relationship among the Chinese financial industries based on the different dependence structure models. In this section, we examine the impact of the dependence structure on the systemic risk measured by CoVaR. presents the CoVaR and CoVaR values at a 95% confidence level (
) for the vine copula grouped model. For comparison, the last column of presents the CoVaR and the
CoVaR values based on the vine copula model at a 95% confidence level.
Table 6. The CoVaR and the CoVaR for the three financial industries and the financial system based on the vine copula grouped model and the vine copula model.
indicates that the main systemic impact of the three financial industries on the Chinese financial system is transferred from banking, followed by insurance, and lastly securities. This demonstrates that banking contributes most to the systemic risk of the examined Chinese financial industries, which comports with Bai and Shi (Citation2014) findings.
This result can be explained through two reasons. First, China’s financial system has long been dominated by banking, with commercial banks accounting for the largest proportion of financing. The integration of the banking industry with other financial industries increases the systemic risk contribution of banking to some extent. Second, consistent with the direct relationship with banking, insurance also transmits systemic risk to the financial system.
Although the ranking of the systemic risk contributions of each industry based on the vine copula model equals that of vine copula grouped model, their risk sizes are influenced by the different models. Therefore, systemic risk estimates should incorporate the impact of the structure of dependence among the examined Chinese financial industries. The vine copula grouped model is able to accurately describe this structure; consequently, the contribution of each industry to systemic risk can evaluated more effectively.
5.4. CoVaR backtesting results
To compare the performance of the models in measuring systemic risk, we backtested the CoVaRs based on the vine copula grouped model and the vine copula model respectively. reports the results of backtesting using Kupiec’s (Citation1995) unconditional coverage test. Note that a model is considered to be the most suitable for calculating the CoVaR with p value greater than 0.05.
Table 7. Test statistics and p values for CoVaR unconditional coverage test with the vine copula grouped model and the vine copula model.
Although the CoVaR estimates based on the two models are not rejected at the 5% significance level, the p values in corresponding to the vine copula grouped model are bigger than those of the vine copula model, even higher than 0.05, indicating that the vine copula grouped model tends to accept the null hypothesis more often. As shown in , if we ignore the intragroup and intergroup dependence structures, we would fail to accurately estimate the systemic risk. In contrast, by accounting for the impact of the dependence structure among the Chinese financial industries, the CoVaR values based on the vine copula grouped model improves the backtest results. It is therefore evident that the accuracy of CoVaRs in measuring systemic risk is increased by using the vine copula grouped model.
6. Conclusion
The recent financial and debt crises have aggravated the turbulence of global finance, which is closely linked to Chinese financial markets because China’s development profoundly affects the growth of the world economy. Therefore, it is crucial to accurately describe the structure of dependence of Chinese financial industries and measure their systemic risk in order to manage their risk effectively and maintaining financial stability. Our novel approach computes the CoVaR measure of systemic risk among the Chinese financial industries (banking, securities, and insurance) based on the vine copula grouped model—acknowledging that the industries contain diverse financial institutions. We compared the backtesting results of the CoVaR calculated by the vine copula grouped model and the vine copula model, validating the former in analysing systemic risk. The main results are as follows.
First, the backtesting results show that the CoVaR based on vine copula grouped model is more accurate than the traditional model. The risk sizes are different based on the two models, although the ranking of systemic risk contributions for each industry are equal. This indicates that the vine copula grouped model can fully capture the dependence among banking, securities, and insurance industries in China’s financial market.
Second, the banking industry has a lower VaR and a higher CoVaR. The VaR of securities is big and its CoVaR is small. This suggests that banking is the main sender and securities is the main receiver of the systemic risk.
Based on these results, this paper puts forward two suggestions. First, when analysing the complex relationship of multiple variables, the effect of data characteristics on their dependence should be examined, instead of viewing them as a whole to directly study their dependence. The vine copula grouped model used in this paper can accurately describe the dependence of this type of data. Second, the regulatory authorities should pay more attention to the risks of the banking industry in order to avoid an extreme crisis that affects the entire financial system. Meanwhile, securities should enhance its own ability to resist external risks. Thus, regulators need to differentiate the main sender and main receiver of systemic risk.
Systemic risk metrics such as MES can measure the marginal contribution of an institution when the market is in crisis. Future research should combine the vine copula grouped model and MES to measure systemic risk.
Disclosure statement
No potential conflict of interest was reported by the authors.
Additional information
Funding
Notes
1 The results of the vine copula for the institutions of each industry can be provided by the corresponding author.
References
- Adrian, T., & Brunnermeier, M. (2016). CoVaR. American Economic Review, 106(7), 1705–1741. https://doi.org/10.1257/aer.20120555
- Arbenz, P., Hummel, C., & Mainik, G. (2012). Copula based hierarchical risk aggregation through sample reordering. Insurance: Mathematics & Economics, 51(1), 122–133.
- Bai, X., & Shi, D. (2014). Measurement of the systemic risk of China's financial system. Studies of International Finance (in Chinese), 326(6), 75–85.
- Bedford, T., & Cooke, R. (2001). Probability density decomposition for conditionally dependent random variables modeled by vines. Annals of Mathematics and Artificial Intelligence, 32(1), 245–268. https://doi.org/10.1023/A:1016725902970
- Chen, Z., & Hao, X. (2018). A study on risk measurement of financial market based on vine copula grouped model. Statistical Research (in Chinese), 35(6), 77–84.
- Girardi, G., & Ergün, A. (2013). Systemic risk measurement: Multivariate GARCH estimation of CoVaR. Journal of Banking & Finance, 37(8), 3169–3180. https://doi.org/10.1016/j.jbankfin.2013.02.027
- Hou, Y., & Wang, X. (2020). Extreme and inference for tail Gini functionals with applications in tail risk measurement. Journal of the American Statal Association, 1–35.
- Ji, Q., Liu, B., & Fan, Y. (2019). Risk dependence of CoVaR and structural change between oil prices and exchange rates: A time-varying copula model. Energy Economics, 77(1), 80–92. https://doi.org/10.1016/j.eneco.2018.07.012
- Jiang, Y. (2019). Dynamics in the co-movement of economic growth and stock return: Comparison between the united states and china. Economic Research-Ekonomska Istraživanja, 32(1), 1965–1976. https://doi.org/10.1080/1331677X.2019.1642786
- Karimalis, E., & Nomikos, N. (2018). Measuring systemic risk in the European banking sector: A copula CoVaR approach. The European Journal of Finance, 24(11), 944–975. https://doi.org/10.1080/1351847X.2017.1366350
- Kim, S., & Upneja, A. (2021). Majority voting ensemble with a decision trees for business failure prediction during economic downturns. Journal of Innovation & Knowledge, 6(2), 112–123. https://doi.org/10.1016/j.jik.2021.01.001
- Kupiec, P. (1995). Techniques for verifying the accuracy of risk measurement models. The Journal of Derivatives, 3(2), 73–84. https://doi.org/10.3905/jod.1995.407942
- Law, S., Lee, W., & Singh, S. (2018). Revisiting the finance-innovation nexus: Evidence from a non-linear approach. Journal of Innovation & Knowledge, 3(3), 143–153. https://doi.org/10.1016/j.jik.2017.02.001
- Liu, B., Ji, Q., & Fan, Y. (2017). Dynamic return-volatility dependence and risk measure of CoVaR in the oil market: A time-varying mixed copula model. Energy Economics, 68, 53–65. https://doi.org/10.1016/j.eneco.2017.09.011
- Mainik, G., & Schaanning, E. (2014). On dependence consistency of CoVaR and some other systemic risk measures. Statistics & Risk Modeling, 31(1), 49–77. https://doi.org/10.1515/strm-2013-1164
- Mensi, W., Selmi, R., & Al-Yahyaee, K. (2020). Switching dependence and systemic risk between crude oil and U.S. Islamic and conventional equity markets: A new evidence. Resources Policy, 69, 101861. https://doi.org/10.1016/j.resourpol.2020.101861
- Nelsen, R. B. (2006). An introduction to copulas (2nd ed.). Springer.
- Reboredo, J. (2015). Is there dependence and systemic risk between oil and renewable energy stock prices? Energy Economics, 48, 32–45. https://doi.org/10.1016/j.eneco.2014.12.009
- Reboredo, J., Rivera-Castro, M., & Ugolini, A. (2016). Downside and upside risk spillovers between exchange rates and stock prices. Journal of Banking & Finance, 62, 76–96. https://doi.org/10.1016/j.jbankfin.2015.10.011
- Reboredo, J., & Ugolini, A. (2015a). Systemic risk in European sovereign debt markets: A CoVaR-copula approach. Journal of International Money and Finance, 51, 214–244. https://doi.org/10.1016/j.jimonfin.2014.12.002
- Reboredo, J., & Ugolini, A. (2015b). Downside/upside price spillovers between precious metals: A vine copula approach. The North American Journal of Economics and Finance, 34, 84–102. https://doi.org/10.1016/j.najef.2015.08.001
- Reboredo, J., & Ugolini, A. (2016). Systemic risk of Spanish listed banks: A vine copula CoVaR approach. Spanish Journal of Finance & Accounting, 45(1), 1–31.
- Shahzad, S., Hernandez, J., Bekiros, S., Shahbaz, M., & Kayani, G. (2018). A systemic risk analysis of Islamic equity markets using vine copula and delta CoVaR modeling. Journal of International Financial Markets, Institutions and Money, 56, 104–127. https://doi.org/10.1016/j.intfin.2018.02.013
- Sklar, C. (1959). Fonctions de répartition à n dimensions et leurs marges. Publications Del’Institut de Statistique de L’Universit’e de Paris, 8, 229–231.
- Szetela, B., Mentel, G., & Brożyna, J. (2019). Modelling European sovereign default probabilities with copulas. Economic Research-Ekonomska Istraživanja, 32(1), 1716–1726. https://doi.org/10.1080/1331677X.2019.1629325
- Tang, Z., Zhang, T., Liu, C., & Wu, J. (2021). A scientometric review on literature of macroprudential policy. Economic Research-Ekonomska Istraživanja, 34(1), 1498–1519. https://doi.org/10.1080/1331677X.2020.1844579
- Uddin, G., Hernandez, J., Shahzad, S., & Hedström, A. (2018). Multivariate dependence and spillover effects across energy commodities and diversification potentials of carbon assets. Energy Economics, 71, 35–46. https://doi.org/10.1016/j.eneco.2018.01.035
- Zhang, B., Wei, Y., Yu, J., Lai, X., & Peng, Z. (2014). Forecasting VaR and ES of stock index portfolio: A vine copula method. Physica A: Statistical Mechanics and Its Applications, 416, 112–124. https://doi.org/10.1016/j.physa.2014.08.043
- Zhou, Q., Chen, Z., & Ming, R. (2016). Copula-based grouped risk aggregation under mixed operation. Applications of Mathematics, 61(1), 103–120. https://doi.org/10.1007/s10492-016-0124-z
- Živkov, D., Kuzman, B., & Andrejević-Panić, A. (2021). Nonlinear bidirectional multiscale volatility transmission effect between stocks and exchange rate markets in the selected African countries. Economic Research-Ekonomska Istraživanja, 34(1), 1623–1650. https://doi.org/10.1080/1331677X.2020.1844585