
 ?Mathematical formulae have been encoded as MathML and are displayed in this HTML version using MathJax in order to improve their display. Uncheck the box to turn MathJax off. This feature requires Javascript. Click on a formula to zoom.
Abstract
This study examines causality relation between the quality of national institutional frameworks designed to ensure higher energy efficiency and the distance to the achievement of the EU Commission targets in terms of energy consumption, using a panel of 21 EU member states. Through panel unit root tests and an estimated VAR model, our results reveal that the quality of a nation’s institutional and economic energy efficiency framework does not significantly influence the gap between annual energy consumption and related EU targets, as prescribed by the energy efficiency EU Directives. However, the results show a bi-directional causality relationship suggests that the nation’s institutional framework on energy efficiency should be improved. According to the impulse response function, this relationship is more related to a short-run perspective. Hence, a strong correlation exists between the level of achieving the reduction targets on energy consumption and the level of gas emissions. Our findings further reveal that the level of reported GHCs significantly influences national regulations and strategies for gas emission reductions. This research highlights the importance of each EU member state creating an appropriate legislative and institutional framework that promotes energy efficiency.
1. Introduction
Climate change and the intensification of extreme weather events present a global challenge, with a considerable impact on both people and the environment, and on the economy itself. On the one hand, effective policies and procedures are needed to reduce greenhouse gas emissions and to improve energy security through measures intended to limit energy import dependence outside the European Union. On the other hand, strategies are needed to adapt to the effects of already visible and inevitable climate change (EEA, 2016).
Over time, at the European Union level, measures have been adopted to ensure sustainable development, but the reality shows that more is needed to reduce the vulnerability of societies to climate change (Renna & Materi, Citation2021; RENA, 2019). Ensuring energy efficiency is thus one of the main objectives to be achieved by EU member states and is placed at the heart of the strategy elaborated to limit the effects of climate change. Directive 2012/27/EU established that by 2020, primary energy consumption should be reduced among member states by 20%. Over time, primary energy consumption has fluctuated, being influenced by economic conditions, the climate, or the level of implementation of energy efficiency measures by each state. In 2019, the primary energy consumption decreased, exceeding the imposed target by 3%. In 2020, the crisis generated by the novel coronavirus has triggered another global decline in energy consumption, which can be attributed to the measures taken to limit the spread of COVID-19. In this situation where the economy has not become more energy-efficient, the declines will not be sustained, as energy consumption may increase later due to the economic recovery.
However, decision-makers have proposed more ambitious targets to be achieved by 2030, namely, reducing energy consumption by 32.5% (European Commission, Citation2018), a decrease of 55% of greenhouse gases, and transforming Europe into the first climate-neutral continent by 2050 (European Commission, Citation2021). Nevertheless, the transition to a greener, more circular, and digital European economy is not easy. The challenge is how benefits can be distributed to all as equitably as possible while strengthening competitiveness, creating new jobs, and effectively addressing the costs and impact of the transition through an effective legislative framework and coherent strategies.
The main objective of our paper is to evaluate the causal relationship between the quality of national institutional frameworks designed to ensure higher energy efficiency and the distance to the achievement of the EU Commission targets. In this context, the focus of our paper is related to: (i) national institutional approaches, specifically on energy efficiency; (ii) linking the achievement of SDG 7 with energy efficiency through European directives that set targets in the field; (iii) causal analysis to identify the implications of public policies or mechanisms for stimulating and monitoring energy efficiency; and (iv) an alternative approach to the common method for analyzing the nexus between economic growth and energy consumption.
The proposed research is structured in five sections. Thus, this first section highlights the preliminary aspects of the undertaken scientific approach, while the second section finds corresponding examples in the literature analysis. The next two sections present the research methodology, including the results obtained and their discussion, respectively. Finally, the fifth section draws the final conclusions of our research.
2. Study background
The environmental problems facing the entire planet are largely the result of over exploitation of natural resources. Europe's economy is based on a continuous flow of natural resources and materials. This dependence, complemented by imports, can be a vulnerability, given that the global competition for natural resources is intensifying.
Thus, to mitigate the impact of climate change and contribute to sustainable development, creating at the same time a green economy framework, the EU imposes targets for their member states to reduce energy consumption and increase energy efficiency (Adua et al., Citation2021). Hence, energy efficiency is a global priority with particular interest for both decision-makers and researchers that are trying to identify efficient ways to use energy wisely. The aim is to reduce the costs related to energy production, transport, and consumption, improve government policies, and achieve the proposed EU objectives (Sineviciene et al., Citation2017). However, improving energy efficiency is not an easy process because to formulate effective environmental policies, it is first necessary to identify the determinants of environmental degradation (Chou & Zhang, Citation2020; Sarfraz et al., Citation2018).
Breuer et al. (Citation2019) noted that achieving SDG targets, including SDG 7, which refers to affordable and clean energy objectives, requires a systemic approach that can be translated into a set of policies to ensure all stakeholders and decision-makers have coherent action plans. A similar approach has been underlined by Knopf et al. (Citation2013) to discuss the need and opportunity to reform the European energy system. It emphasizes the positive impact of strategies to improve energy efficiency and, at the same time, promotes the identification and use of renewable energy sources. In this regard, member state governments have an essential role as the responsible entity for issuing and implementing national policies to lead all efforts in one direction: a significant increase in energy efficiency at the national level. This objective is even more important to achieve as the EU members are subject to clearly defined national-level targets in terms of energy efficiency for the 2030 perspective. Those targets are formally approved by the EU energy Directive 2012/27/EU, modified by EU energy Directive (UE) 2018/2002, which is already planned to be replaced by a new directive, currently under discussion, which will define the targets for 2050. So far, EU member states appear to be complying with the imposed targets, acting as global benchmarks in terms of energy efficiency (Shehzad et al., Citation2020; Wang et al., Citation2019). Other non-European countries, such as China and India, have high energy production but do not consider the negative effects of CO2 emissions; the US, by comparison, has a higher level of energy productivity and better control over carbon emissions (Sarfraz et al., Citation2021; Wang et al., Citation2017).
However, there is the little discussion related to national institutional factors when discussing the main drivers of energy efficiency, as researchers tend to focus on economic factors such as economic development, economic growth, dynamics of population, investments, financing, human capital, or energy prices (Acaravci & Ozturk, Citation2010; Edziah et al., Citation2021; Wang et al., Citation2019), and are mainly oriented toward analyzing manufacturing firms (Renna & Materi, Citation2021; Schulze et al., Citation2016; Solnørdal & Foss, Citation2018). All those studies have a common finding that discussions around the topic of energy efficiency are always related to the environmental impact of energy consumption (Uribe-Toril et al., Citation2019).
Therefore, the analysis of the impact of national institutional factors on energy efficiency seems to be neglected. To our knowledge, some recent papers have addressed this topic by conducting empirical analysis (Apergis & Garćıa, Citation2019; Lyulyov et al., Citation2021; Sineviciene et al., Citation2017; Zangheri et al., Citation2019). However, those studies have not referred to national institutional factors describing the specific institutional frameworks that provide direct information on energy efficiency but instead provide national-level descriptive indicators in general. Our analysis is designed so that relevant information about national energy frameworks is analyzed, with a focus on those that impact the achievement of EU 2030 energy consumption targets, considering as reference information the RISE country indicators that assess a set of essential aspects of each national energy efficiency framework. Therefore, our study will test the following research hypothesis states that the quality of a nation’s energy efficiency institutional framework significantly influences the distance between annual energy consumption and related EU targets.
3. Research methodology
3.1. Data and variables definition
For this study purpose—namely, to assess the relation of causality between the quality of national institutional frameworks designed to ensure higher energy efficiency and the distance to the achievement of the EU Commission targets in terms of energy consumption—we have considered for analysis the period 2010–2019, limited to the period for which there are available data about the RISE composite index. Therefore, the data used in our analysis is directly focused on the matter of energy efficiency and is not biased by different calculation methods. There are analyzed 21 EU members, respectively: Austria, Belgium, Bulgaria, Croatia, Czech Republic, Denmark, Finland, France, Germany, Greece, Hungary, Ireland, Italy, Netherlands, Poland, Portugal, Romania, Slovak Republic, Spain, Sweden, and United Kingdom. The sample comprises 201 observations per each variable considered in the analysis.
Worldwide, numerous initiatives of public policies have been issued to promote energy efficiency, in relation to an increase of use of renewable energy and implementation of emerging energy technologies, either managed by international institutions, regional institutions, or local agency energy institutions. Our study aims to underline the role of national governments’ policies in energy efficiency. To isolate the effect of international and regional effects of institutional frameworks, we have limited our sample only to EU members, which are subject to the same public energy directives that are, however, transposed differently into local regulations and which are monitored for compliance according to different enforcement systems.
The period is limited to 2010-2019 because of the limited project lifetime of the RISE (Regulatory Indicators for Sustainable Energy) project, which only commenced in 2010. The project collects data from different countries through annual surveys to measure an aggregate image of countries’ readiness for implementing a sustainable energy consumption model. In , we provide a short description of the variables considered in our analysis.
Table 1. Description of variables considered in the model.
3.2. Time series analysis
Our analysis uses time series data covering the period 2010-2019, structured in panels represented by 21 countries. The relationship between energy efficiency indicator and country institutional factor is assessed through panel data analysis methods. The analysis of time series analysis consists of several steps, respectively: (i) stationarity of panel time-series data; (ii) panel time-series causality tests; (iii) co-integration of panel time-series data.
3.2.1. Panel stationarity testing
Testing for stationarity of time series is performed by running a set of panel unit root tests: Levin-Lin-Chu t-test, Im-Pesaran-Shin test, ADF - Fisher Chi-square test, and PP - Fisher Chi-square test. All the methods have a similar principle. For instance, in the case of the Levin-Lin-Chu test is tested the assumption that all countries in the panel share the same autoregressive coefficient estimating model below:
(1)
(1)
where
is the first difference operator,
is the number of lags,
is the unit-specific fixed effect, while
denotes the time fixed effect and
The error terms follow a stationary invertible autoregressive moving-average process for each unit in the panel but are independently distributed across the panels. If
the test confirms that the time series is stationary. Otherwise, the null hypothesis
is accepted, showing that each panel has a unit root.
Once determined the integration level of the time series, based on the panel unit root tests, it can be decided if the regression model is estimated using values at level, valid for time series of order of integration, or first difference values, in case of time series of
order of integration. Moreover, based on the time-series order of integration, we decide if further analysis is needed for the co-integration of time series, which would confirm the long-run relationship between the variables. Otherwise, the VAR model is preferred instead of the ADRL model and no longer needs short-run relations analysis.
3.2.2. Panel causality testing
Our analysis started from an extended set of time series, including energy productivity, energy consumption, World Governance regulatory quality score, World Governance rule of law score, firm ESG score, and firm target energy efficiency score, a variable which was excluded based on the results of causality tests performed. Based on Granger panel causality tests, we decided which variables are planned to be endogenous considered for the VAR model estimation.
Granger causality test consist of estimating the bivariate regressions of the form below, for each possible pair of variables considered on the analysis, testing for the hypothesis that for each equation.
(2)
(2)
(3)
(3)
The null hypothesis is that x does not Granger-causey in the first regression and that y does not Granger-cause x in the second regression. We can reject the null hypothesis if the F-statistic is statistically significant for a level of 5%, concluding that there is a causality relationship between the two variables, but with a clear direction of causality.
An additional VAR Granger causality test is performed to have better information limited strictly to the time series of the selected endogenous variables. The first causality granger test is performed only to select variables to be included in the VAR estimated model.
3.3. Model specification
Correlation or causality tests confirm the existence of a relationship between two variables; they do not reveal information about its strength. For this purpose, we estimate a VAR model to understand the amplitude of the relationship between our variables. By estimating the VAR model, we solve the problem of endogeneity of the variables considered in the model (Gujarati & Porter, Citation2009). Additionally, we can see the sign of the relation between our endogenous variables. Nonetheless, as noted by Canova and Ciccarelli (Citation2013), panel VAR models represent useful tools for government policy analysis because: (i) they capture both static and dynamic interdependencies, (ii) treat the links across units in an unrestricted fashion, (iii) easily incorporate time variation in the coefficients and the variance of the shocks, and (iv) account for cross-sectional dynamic heterogeneities.
More frequently, the Panel VAR model and the VECM model are widely used in the literature related to energy consumption modeling and study of causality concerning country economic growth (Omri, Citation2014; Ozturk, Citation2010). The choice for the VAR model is because all endogenous variables included in the model have the same order of integration (Gujarati, Gujarati and Porter, Gujarati and Porter, Citation2009; Brooks, 2019). Additionally, the VAR model is preferred against the ADRL model, as there is no cointegration valid for time series with I (0) order of integration (Wu & Zhou, Citation2010). The process used in our analysis, with a lag of
can be expressed by the system of relations below:
(4)
(4)
(5)
(5)
(6)
(6)
where
and
denote the stochastic error terms, called innovations. Those innovations are used later for an impulse function analysis to show the effect on energy efficiency on each of the standard error shocks generated by the other endogenous variables included in the estimated VAR model.
The error terms have to follow a white noise process, known in terms of VAR models as innovations process. No autocorrelation between different panel unit residuals, ensuring: (i) no dynamic interdependencies (no lagged impact from variable l of country i to variable k of country j for lag p); (ii) no static interdependencies (no correlation between the error term of equation l of country i, with the error term of equation k of country j; (iii) no cross-sectional heterogeneities (homogeneous coefficient across the countries for lag p). Therefore, in addition to the review of the classical adjusted and the F-statistic, we check for model validation performing several additional tests, respectively the autocorrelation LM test and the White Heteroscedasticity test to check for panel errors autocorrelation and model heteroscedasticity.
As the lag length of the model influence significantly the estimate of the VAR model, it is essential to choose the optimal one, to avoid too many lags and too many coefficients to be estimated on the not sufficiently high number of observations (Gujarati & Porter, Citation2009). To ensure a proper lag length of the estimated model, we will choose the one that leads to the minimization of a majority of the following information criterion: Akaike’s information criterion (AIC), Hannan-Quinn criterion (HQ), Schwarz criterion (SC) (Ivanov & Kilian, Citation2005).
The VAR model analysis provides relevant information about the sign and the amplitude of the relation between our endogenous variables. Additionally, through VAR model estimation, we can determine the response of the energy efficiency variable to shocks on the other endogenous variables, over a longer period, by analyzing the resulted impulse response function. Additionally, the variance decomposition analysis is performed as it offers useful insights on how much each endogenous variable contributes to the changes encountered on our energy efficiency focus variable.
Further robustness analysis is performed, including on our VAR model several exogenous variables, which are confirmed with only a uni-directional causality relationship, to control our results for (i) firm operations impact on countries’ change to achieve energy consumption 2030 targets; (ii) implications of country energetic security, from the perspective of the degree net imports cover a country’s demand of energy; (iii) countries’ competitiveness, which have implications on energy pricing and countries’ power of negotiation.
4. Results and discussion
4.1. Exploratory data analysis
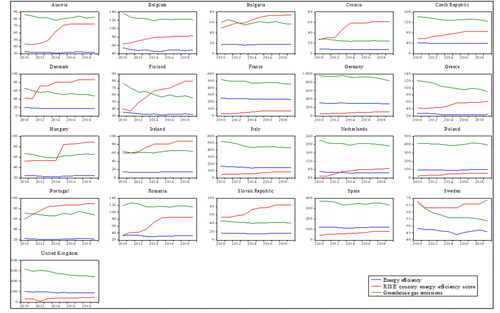
According to EU Commission, reported figures as of 2019, the 2020 targets on energy consumption reduction with 20% have been achieved, with more than 3%. Instead, Directive (EU) 2018/2002 has established new targets for 2030, compared to the targets decided through the Directive 2012/27/EU defining the 2020 targets on energy efficiency. In , we represent the evolution of the energy efficiency indicator measuring the distance to the 2020 and 2030 targets, on an annual basis for the EU members, considered in our sample.
Figure 1. Evolution in time on the endogenous variables.
Source: Authors’ projection
provides descriptive statistics, and it shows smooth evolution toward the energy efficiency targets related to energy consumption, which might be the effect of the coherent macroeconomic policies directed by the EU Commission. Looking at , we can observe significant gaps between countries regarding energy efficiency indicators, which can be justified by different country institutional frameworks, economic development, capital markets maturity, technological innovation, and human capital development (Wang et al., Citation2019).
Figure 2. Country profile based on average of endogenous variables.
Source: Authors’ projection
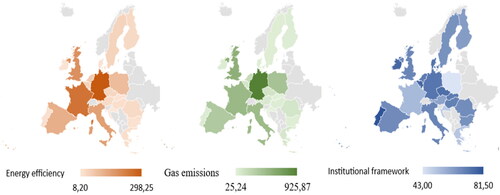
Table 2. Descriptive statistics.
Additionally, in the light of increasing awareness of governments concerning the weak results of circular economy concepts implementation, some studies show the negative effect of energy use on the environment (Halkos & Petrou, Citation2019). The statistics also show discrepancies countries in terms of greenhouse gas emissions (CO2, SOx, NOx, etc.). The median value of greenhouse gas emissions is less than half of the mean value, while the range of values is between 23, 85 and 966,3 (Wang et al., Citation2017).
National decision-makers have come to the agreement that coherent strategies have to be drawn up and implemented to redesign the current energy European system, including reduction of greenhouse gas emissions through technological innovation, financing, and support of installing new renewable energy capacities that amplify as well the circular economic systems, or through the improvement of energy efficiency in other to reach an annual media 1.8% reduction of energy consumption (Knopf et al., Citation2013; EU Commission,Citation2020).
Nonetheless, researchers have raised the impact of firms' impact on how energy efficiency can be achieved through firms’ processes redesign or processes continuous improvements (Renna & Materi, Citation2021; Solnørdal & Foss, Citation2018). Instead, the authors underlined the gap between firms’ management objectives and governments' objectives, which generally lead to poor or ineffective programs incentivizing the use of cleaner energy, such as renewable energy. This gap seems to become a systemic issue, as Solnørdal and Foss (Citation2018) have highlighted that the national policy instruments on energy efficiency have the lowest impact on firms’ energy efficiency performance. Instead, firm policies addressing the problem of energy efficiency within the organizations can create the premises for better operational performance on the use of energy if designed to the specific of firms’ business model and cultural organization. This approach can explain how close the median value (86,74) is to the maximum value (93,61), showing that our sample contains mainly (more than 50%) firms with a score greater than the mean value (62,58). Firms consider relevant the need to address the problem of energy efficiency, not only from the cost and constraints perspective but also from the environmental perspective (Sineviciene et al., Citation2017).
4.2. Correlation analysis
In , we emphasize the correlations between our variables. One relevant correlation we can observe is between the score that reflects the quality of the country’s framework supporting the initiatives on energy efficiency and the gas emissions level (0,416), showing how important is the role of the state in leading the efforts to gas emissions reduction through reduction on energy consumption and reduction of the waste of energy because of poor energy logistic systems.
Table 3. Correlation matrix.
However, a strong correlation exists between the level of achieving the reduction targets on energy consumption and the level of gas emissions (0.963). The positive correlation is unexpected, but it can be explained by the fact that the measure of energy efficiency is a cumulative value over time which reduce the same time with the reduction in gas emissions because of the efforts to increase the productivity of energy consumption by producing higher value add with a lower amount of energy (Acaravci & Ozturk, Citation2010).
4.3. Time series stationarity analysis
The time series analysis involves the first step if there are unit roots, otherwise leading to spurious regressions (Gujarati & Porter, Citation2009). The commonly accepted unit root tests are the ADF (Augmented Dickey-Fuller) and PP (Phillips-Perron) (Gujarati & Porter, Citation2009). We perform additional more recent two panel unit root tests to these tests, respectively Levin–Lin–Chu test and Im–Pesaran–Shin test.
In , we provide the results of all unit root tests employed. The results show that all endogenous variables considered for our model are stationary at the value level, respectively I(0), at a significance level of 5%, except for the Im-Pesaran-Shin test and AD Fischer test significant for a level of 10%. These results show that one fundamental assumption required to estimate a VAR model, respectively, the endogenous variables must have the same integration order, is fulfilled (Gujarati & Porter, Citation2009). The I(0) order of integration allows us to use the level values of our time series, ensuring the stationarity condition required for the VAR model. After all, this order of integration shows slow progress on achieving targets on energy efficiency, reducing greenhouse emissions, and even more on structural changes of the energy efficiency country institutional framework.
Table 4. Panel unit root test results.
4.4. Panel causality test results
As described in the section of methodology, the data we have started comprised more input variables, including energy production, energy consumption, World Governance regulatory quality score, World Governance rule of law score, firm ESG score, and firm target energy efficiency score, a variable which was excluded based on the results of causality tests performed.
presents the Granger causality test results only for the variables for which significant F-statistics were obtained for different lag length scenarios, showing Granger causality with our dependent variable (energy efficiency). The optimal lag length for the VAR model estimated is 2, based on the AIC value, which is the smallest criterion value. We have performed a Granger causality test for 1 lag and 3 lags for the robustness of our results.
Table 5. Granger causality analysis.
The results show a significant bi-directional causality between RISE country energy efficiency score (EES) and energy efficiency (EE), as both F statistics are statistically significant for a level of 1%. These results show that achievement of energy consumption reduction targets is significantly influenced by the country’s institutional framework, reflected by RISE composite index dimensions, respectively: incentivization programs and tools, financing mechanisms for energy efficiency, standardization and monitoring of energy efficiency performance management, enforcement mechanisms, or strategic national efficiency planning. The results are in line with Zhang et al. (Citation2013), who have underlined as well the importance of financing on the area of energy consumption reduction and decline on related gas emissions through government subsidies, favorable credit policies, incentivizing tax policies, or even media supervision.
Similar bi-directional results are also obtained in the case of energy efficiency (EE) and gas emissions (GHC). Energy efficiency is not reached only through better energy production, but through cleaner alternative energy solutions, such as bioenergy or wind energy which seem to be in EU Commission’s attention for future financing (EU Commission, EU Commission, EU Commission, Citation2020).
Additionally, we observe only a uni-directional causality relation between the country's institutional framework and greenhouse gas emissions, showing that the level of reported GHCs significantly influences national regulation and strategies for gas emission reductions. Instead, the reverse causality relation is not statistically significant, which leads us to the same conclusion as Knopf et al. (Citation2013) and Solnørdal and Foss (Citation2018), that country regulation and enforcement mechanisms cannot address the problem of GHC reduction properly.
4.5. VAR model estimation and analysis
If Granger causality testing has provided relevant information about how variables influence each other, the estimated VAR model reveals essential information on the amplitude of the causality between those variables. Through VAR model estimation, we solve the issue of endogeneity, but with the condition that the dynamic information on the model is limited. Instead, as noted by Gujarati and Porter (Citation2009), VAR model estimation is sensitive to the lags considered on the model. The lag is selected based on the smallest value of the AIC value, as this criterion value (17,58) is slightly smaller than the SIC value (17,97).
In , we present the main three criteria generally sued for VAR model lag length. The lowest value of AIC is valid for the lag while the value of SC indicates a lag of only
However, as the HQ criterion indicate the lag as well of
we have decided on a VAR model with two lags.
Table 6. Lag length selection results.
There is no lag considered on Granger causality testing, as indicated by the results of statistical testing for the optimal lag length of the model, presented in , which shows neither of the statistics determined is statistically significant. In those circumstances, we’ve decided on a VAR model estimation, first because of the order of integrating our variables and secondly based on the results from . Compared with the ADRL model, the VAR model does not count for the impact of short-run effects of our variables on energy efficiency. Additionally, as noted by Knopf et al. (Citation2013), changes in energy systems optimization take time, for why public policies and firms’ investment projects are expected to generate visible effects in a longer term. The medium and long-term orientation of energy projects is already acknowledged, so planning on energy efficiency became essential in the last decade. Nonetheless, institutional mechanisms are not sufficiently flexible and accountable in case of all countries, varying geographically and in time (Cattaneo, Citation2019), the reason why a more coherent approach has been decided by implementing globally three key policies, respectively: (i) the implementation of Energy Efficiency Standard, to encourage energy efficiency, (ii) the implementation of Feed-in-Tariff (FiT) to ensure an attractive scheme of incentives for consumers to decide in favor of renewable energy, (iii) Building Energy Performance Certification (BEPC) schemes, aimed to promote widening the diffusion of new technologies in conjunction with advanced energy technologies (Lu et al., Citation2020).
In , we summarize the estimation of the VAR model. The model is statistically significant as the is significantly higher than the critical value. Moreover, we observe a high level of
which explains in the case of all models at least 81,4% of the output variable. Additionally, we observe that there is no autocorrelation on the error term between different panel units, as the LM-statistic is not statistically significant (
). The problem of heteroskedasticity (
) is solved by estimating the model using the White standard errors method, to get consistent standard errors, as the estimated regression coefficients are not affected (Lee et al., Citation2019). Nonetheless, we observe our model is stable, as there is no root of the characteristic polynomial placed outside the circle with the radius of 1.
Table 7. VAR Model estimation.
Overall, we observe energy efficiency is significantly affected by a recurrent component indicating a maximum lag of two years (), indicating that achievement of targets on energy consumption reduction represents a progressive process which seems to be irreversible.
Results show no impact on energy efficiency level, generated by the level of gas emissions, as the coefficient is even statistically significant for both lags, are o opposite sign. However, this causality relation provides more conclusive information, especially on a short-run approach, that is analyzed in our study.
Instead, it seems that the country's institutional framework has played an insignificant role in achieving energy efficiency. These results show that the efforts of energy consumption reduction are rather driven by firm-level decision, strongly influenced by cost-related constraints, such as the price of gas or electricity, the costs of penalty for gas emissions, or process-related improvements leading to environment protection, positively perceived on capital markets as well. Instead, those firm-based drivers are partly incorporated on the value of our constant (), which confirms once again our previous statement. Therefore, market growth opportunities or economic constraints force managers to look for more cost-effective solutions to cover energy demand. Zangheri et al. (Citation2019) study highlights that among the recurrent replies given by countries for achievement of the annual target, in terms of energy consumption reduction, there are also references to a price reduction of gas or electricity.
Overall, the model estimated is stable, indicated that no characteristic polynomial root identified fall outside the unit circle, showing once again variables stationary and the fact that long-run accumulated shocks are 0 and that the energy systems automatically recalibrate in time.
4.6. Impulse response function analysis
In , we have represented the response of our endogenous variables to different shocks, such as changes in regulation or new innovative technologies that can lead to significant gas emission reduction. Thus, the graph shows how energy efficiency will be affected to one standard deviation innovations to either country RISE energy efficiency score or country reported gas emissions.
Figure 3. Representation of shock effects on model endogenous variables.
Source: Authors’ projection
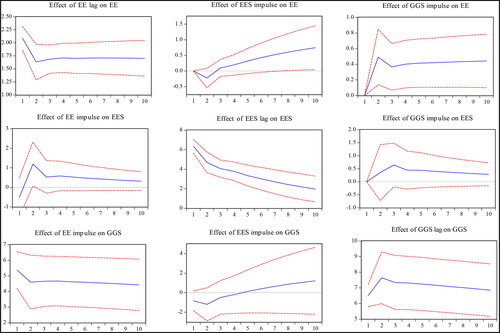
The graph shows that one standard error shock in historical annual energy savings determines a negative response of the current year energy savings but is limited to the first two years. In the long term, for two to four years, the historical energy savings have a slightly positive effect. Nonetheless, we observe a positive response of energy efficiency on a one standard error shock on greenhouse gas emissions in the short run for the first two years analyzed. However, for the next year, the positive effect of energy efficiency to a shock on change on GHC is reversed partially.
4.7. Variance decomposition analysis
As a final step of our analysis, we review each of the endogenous variables' role in explaining the weight of a one standard error shock determined to the response of energy efficiency. In , we represent the distribution of contribution of each of the endogenous variables to the one standard error innovations. We have considered only ten years because of the small optimal lag length determined in the previous sections, which is two years for a long-run approach, while only one year lag is considered for a short-run perspective.
Figure 4. Representation of endogenous variables to a variation on energy efficiency.
Source: Authors’ projection
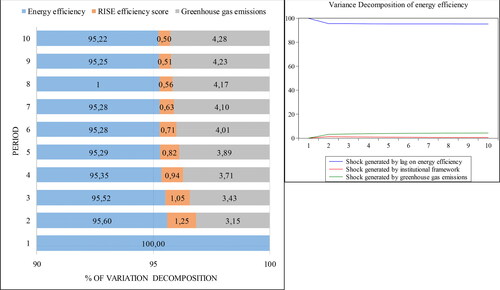
The graph and the distribution of probability show that the main driver of the response of energy efficiency to shocks is the historical short-run energy savings. In the first year, current energy efficiency is affected 100% by prior year energy efficiency shocks. In the next years, this shock affects less the current year period energy efficiency, reaching the minimum value of 86,47% in the case of the short-run analysis.
Overall, those two drivers are not significantly relevant, meaning that governments must change their perspective, from factors of regulation and enforcement, they should change to factors of facilitation and supporting factors for firms’ initiatives that lead to a reduction in energy consumption. For this purpose, they must first ensure a more robust national regulation and sufficiently flexible, granting more standard-setting authority to organizations of profile on the energy area and specialized firms associations. Secondly, they must ensure a transparent and advantageous system of financing technological innovations in alternative energy sources. Nonetheless, as prescribed by the Directive 2012/27/EU, they must ensure effective enforcement mechanisms, such as the energy audits and regular standard reporting of energy consumption. This policy implication should prepare the countries for the currently proposed new EU Directive on energy efficiency, which will amend the initial one, with the new 2050 targets on energy consumption, energy dependency, and technological innovation related to energy production.
4.8. Robustness analysis
As the last step of our analysis, we provide the VAR model estimation results, controlling this time for the influence of firms’ policy in energy efficiency, the competitiveness of the national economic environment, and countries’ rate of energetic dependence. This way, we understand the impact of some of the main constraints that governments face on their efforts to keep as high as possible the distance between energy consumption and related targets of maximum energy consumption.
5. Discussion
A higher energy dependence determines higher energy productivity, meaning lower energy consumption per value add created, directly impacting our energy efficiency variable. Solnørdal and Foss (Citation2018) and Renna and Materi (Citation2021) stated energy consumption reduction is expected to be determined by the firms’ behavior in adjusting their energy demand, through the strategic direction given by managers. The pressure is even higher for such micro-management of the energy demand. As long as energy markets prove extremely volatile, firms search for each opportunity to get an advantage on the negotiated energy price. Nonetheless, there is evidence that a nation’s governance quality represents, perhaps not a central driver for energy efficiency, but rather a mediating factor (Apergis & Garćıa, Citation2019).
The results show no significant changes between the model provided in and the model provided in . The control variables seem to have no significant impact on the distance between the annual energy consumption and the remaining target level. Instead, we can observe that the level of competitiveness of a national economy significantly influences the national framework for the energy efficiency of a country (). These results suggest a complementary relation between the maturity of the economic environment and the quality of the framework created by the government to promote energy efficiency. The economic environment can lead to energy efficiency through different channels and mechanisms, such as the efficiency of energy markets, availability of financing resources for initiatives aimed to reduce energy consumption, non-compliance costs for consumer behavior that breach legal requirements or industry standards requirements, etc. On the other side, if the economic environment is not capable of ensuring voluntary reduction of energy consumption, either within firms, or households, the national government should intervene and create a consolidated framework that implements adjustments in the economy by offering incentives for consumer behavior that lead to lower energy consumption and higher energy efficiency.
Table 8. Var model estimation considering exogenous variables.
Apergis and Garćıa (Citation2019) and Chou and Zhang (Citation2020) studies have confirmed a positive impact of national governance quality on the increase of energy efficiency. However, their results referred only to indirect measures of the quality of the national framework for energy efficiency. In contrast, our study relates to a more focused energy efficiency indicator regarding the RISE energy efficiency component. Nonetheless, Chou and Zhang (Citation2020) noted, a higher impact of national governance quality is confirmed in the case of nations with lower energy efficiency. Our study is limited to EU countries, subject to uniform energy efficiency directives, which partly leads to a higher convergence of national regulations in this area and higher energy efficiency. Evidence in the literature indicates significant progress on implementing the EU energy directives, though emphasizing the need for further concerted efforts to improve the regulation and monitoring instruments (Zangheri et al., Citation2019). However, we underline that the European regional initiative to coordinate the efforts toward achieving the 2030 targets in terms of energy reduction is limited, as national standard-setters must further regulate country-specific items.
The results also suggest similar complementary mechanisms, when identifying the relationship between the level of greenhouse gas emissions and the quality of a nation’s institutional energy efficiency factors (). The higher the competitiveness of a nation, the lower the level of greenhouse gas emissions, as an effect of energy consumption reduction, which represents an opportunity for firms to optimize their cost models throughout their operational processes. However, higher competitiveness within a nation is not determined only by energy price effects on firms’ cost models. Still, it can also denote that a nation has higher capabilities to foster innovation and implement advanced technologies designed to reduce energy consumption and indirectly increase energy productivity. Nonetheless, it is important to underline that the national competitiveness index also contains a component that describes the complexity of business models in an economy or the sophistication of production processes, which can have contradictory effects. First, more complex business models can be reflected by the highly horizontal and vertical integration of the operations, with potential significant scale effects determined by avoiding externalization of processes and creating value-added along the entire supply chain. On the other side, business models can also be less complex. Still, the products such firms sell can be produced through processes using technologies that require high consumption of resources, as is the case in the chemical industry.
The impact of firms’ policies on macroeconomic energy consumption reduction seems to be statistically insignificant. The results are similar to Sineviciene et al. (Citation2017), who underlined that changes to the firms’ corporate governance do not lead to substantial reductions in energy consumption.
6. Conclusion
Our study aimed to assess the causality between the quality of national institutional frameworks designed to ensure higher energy efficiency and the distance to the achievement of the EU Commission targets in terms of energy consumption. Our analysis uses a time series covering the period 2010–2019, structured in panels represented by the 21 EU member states included in our sample.
Our results show a relevant correlation between the score that reflects the quality of a nation’s framework supporting energy efficiency initiatives and the gas emissions level. However, the quality of a nation’s institutional and economic energy efficiency framework does not significantly influence the distance between annual energy consumption and related EU targets, as prescribed by the energy efficiency EU Directives. Instead, the bi-directional Granger causality relationship is visible only for the first three years according to the impulse response function. Another strong correlation exists between the level of achieving the reduction targets on energy consumption and the level of gas emissions. Similar bi-directional results are obtained as well in the case of energy efficiency (EE) and gas emissions (GHC). Also, our findings reveal that the level of reported GHCs significantly influences national regulation and strategies for gas emission reductions. These results indicate that a nation’s institutional framework can influence the achievement of energy consumption reduction targets, but only as long as the mechanisms activated work effectively and are supported by regulations consistent with the local specificities of the economic environment. The outcomes of our research highlight the fact that institutional regulatory frameworks are important factors in achieving energy efficiency. Thus, regulations and monitoring mechanisms must correctly and concretely address this issue through coherent legislation and an effective control mechanism to reduce consumption and gas emissions to increase energy efficiency. Once this macroeconomic objective is achieved, firms can better understand how their internal processes and supporting policies and procedures should be designed to align with the direction provided by the government.
Disclosure statement
No potential conflict of interest was reported by the author(s).
References
- Acaravci, A., & Ozturk, I. (2010). On the relationship between energy consumption, CO2 emissions and economic growth in Europe. Energy, 35(12), 5412–5420. https://doi.org/10.1016/j.energy.2010.07.009
- Adua, L., Clark, B., & York, R. (2021). The ineffectiveness of efficiency: The paradoxical effects of state policy on energy consumption in the United States. Energy Research & Social Science, 71, 101806. https://doi.org/10.1016/j.erss.2020.101806
- Apergis, N., & Garćıa, C. (2019). Environmentalism in the EU-28 context: The impact of governance quality on environmental energy efficiency. Environmental Science and Pollution Research International, 26(36), 37012–37025.
- Breuer, A., Janetschek, H., & Malerba, D. (2019). Translating sustainable development goal (SDG) interdependencies into policy advice. Sustainability, 11(7), 2092. https://doi.org/10.3390/su11072092
- Canova, F., & Ciccarelli, M. (2013). Panel Vector Autoregressive Models: A Survey (January 16, 2013). ECB Working Paper No. 1507. https://ssrn.com/abstract=2201610
- Cattaneo, C. (2019). Internal and external barriers to energy efficiency: Which role for policy interventions? Energy Efficiency, 12(5), 1293–1311. https://doi.org/10.1007/s12053-019-09775-1
- Chou, L.-C., & Zhang, W.-H. (2020). The effect of democracy on energy efficiency in European countries. Economic Research-Ekonomska Istraživanja, 33(1), 3476–3491. https://doi.org/10.1080/1331677X.2020.1774792
- Edziah, B. K., Sun, H., Anyigbah, E., & Li, L. (2021). Human capital and energy efficiency: Evidence from developing countries. American Journal of Industrial and Business Management, 11(06), 599–610. https://doi.org/10.4236/ajibm.2021.116038
- European Environment Agency. (2016). About climate change. Retrieved from: https://www.eea.europa.eu/ro/themes/climate/about-climate-change
- EU Commission. (2020). Financing a sustainable European economy. Taxonomy Report: Technical annex. https://ec.europa.eu/info/sites/default/files/business_economy_euro/banking_and_finance/documents/200309-sustainable-finance-teg-final-report-taxonomy-annexes_en.pdf
- European Commission. (2021). “Fit for 55”: delivering the EU's 2030 Climate Target on the way to climate neutrality. https://eur-lex.europa.eu/legal-content/EN/TXT/PDF/?uri=CELEX:52021DC0550&from=EN
- European Commission. (2018). Directive 2018/2002/EU of the European Parliament and of the Council of 11 December 2018 amending Directive 2012/27/EU on energy efficiency. Retrieved from: https://eur-lex.europa.eu/legal-content/EN/TXT/PDF/?uri=CELEX:32018L2002&from=EN
- Gujarati, D., & Porter, D. (2009). Basic Econometrics (5th ed.). McGraw Hill Inc.
- Halkos, G., & Petrou, K. N. (2019). Analysing the energy efficiency of EU Member States: The potential of energy recovery from waste in the circular economy. Energies, 12(19), 3718. https://doi.org/10.3390/en12193718
- Ivanov, V., & Kilian, L. (2005). A practitioner’s guide to lag order selection for VAR impulse response analysis. Studies in Nonlinear Dynamics & Econometrics, 9(1), 1–38. https://doi.org/10.2202/1558-3708.1219
- Knopf, B., Chen, Y.-H H., De Cian, E., Förster, H., Kanudia, A., Karkatsouli, I., Keppo, I., Koljonen, T., Schumacher, K., & Van Vuuren, D. P. (2013). Beyond 2020—Strategies and costs for transforming the European energy system. Climate Change Economics, 04(supp01), 1340001. https://doi.org/10.1142/S2010007813400010
- Lee, C.-F., Chen, H.-Y., & Lee, J. (2019). Financial econometrics, mathematics and statistics. Springer.
- Lu, Y., Khan, Z. A., Alvarez-Alvarado, M. S., Zhang, Y., Huang, Z., & Imran, M. (2020). A critical review of sustainable energy policies for the promotion of renewable energy sources. Sustainability, 12(12), 5078. https://doi.org/10.3390/su12125078
- Lyulyov, O., Pimonenko, T., Kwilinski, A., Dzwigol, H., Dzwigol-Barosz, M., Pavlyk, V., & Barosz, P. (2021). The impact of the government policy on the energy efficient gap: The evidence from Ukraine. Energies, 14(2), 373. https://doi.org/10.3390/en14020373
- Omri, A. (2014). An international literature survey on energy-economic growth nexus: Evidence from country-specific studies. Renewable and Sustainable Energy Reviews, 38, 951–959. https://doi.org/10.1016/j.rser.2014.07.084
- Ozturk, I. (2010). A literature survey on energy–growth nexus. Energy Policy, 38(1), 340–349. https://doi.org/10.1016/j.enpol.2009.09.024
- Renna, P., & Materi, S. (2021). A literature review of energy efficiency and sustainability in manufacturing systems. Applied Sciences, 11(16), 7366. https://doi.org/10.3390/app11167366
- Sarfraz, M., Mohsin, M., Naseem, S., & Kumar, A. (2021). Modeling the relationship between carbon emissions and environmental sustainability during COVID-19: a new evidence from asymmetric ARDL cointegration approach. Environment, Development and Sustainability, 23, 16208–16226. https://doi.org/10.1007/s10668-021-01324-0
- Sarfraz, M., Qun, W., Hui, L., & Abdullah, M. (2018). Environmental risk management strategies and the moderating role of corporate social responsibility in project financing decisions. Sustainability, 10(8), 2771. https://doi.org/10.3390/su10082771
- Schulze, M., Nehler, H., Ottosson, M., & Thollander, P. (2016). Energy management in industry–a systematic review of previous findings and an integrative conceptual framework. Journal of Cleaner Production, 112, 3692–3708. https://doi.org/10.1016/j.jclepro.2015.06.060
- Shehzad, K., Xiaoxing, L., Sarfraz, M., & Zulfiqar, M. (2020). Signifying the imperative nexus between climate change and information and communication technology development: a case from Pakistan. Environmental Science and Pollution Research International, 27(24), 30502–30517.
- Sineviciene, L., Sotnyk, I., & Kubatko, O. (2017). Determinants of energy efficiency and energy consumption of Eastern Europe post-communist economies. Energy & Environment, 28(8), 870–884. https://doi.org/10.1177/0958305X17734386
- Solnørdal, M. T., & Foss, L. (2018). Closing the energy efficiency gap—a systematic review of empirical articles on drivers to energy efficiency in manufacturing firms. Energies, 11(3), 518. https://doi.org/10.3390/en11030518
- Uribe-Toril, J., Ruiz-Real, J. L., Milán-García, J., & de Pablo Valenciano, J. (2019). Energy, economy, and environment: A worldwide research update. Energies, 12(6), 1120. https://doi.org/10.3390/en12061120
- Wang, C.-N., Ho, H.-X T., & Hsueh, M.-H. (2017). An integrated approach for estimating the energy efficiency of seventeen countries. Energies, 10(10), 1597. https://doi.org/10.3390/en10101597
- Wang, C.-N., Nguyen, T.-D., & Yu, M.-C. (2019). Energy use efficiency past-to-future evaluation. An International Comparison. Energies, 12(19), 3804.
- Wu, Y., & Zhou, X. (2010). VAR Models: Estimation, inferences, and applications. In Handbook of Quantitative Finance and Risk Management (pp. 1391–1398). Springer.
- Zhang, Z., Jin, X., Yang, Q., & Zhang, Y. (2013). An empirical study on the institutional factors of energy conservation and emissions reduction: Evidence from listed companies in China. Energy Policy, 57(C), 36–42.
- Zangheri, P., Economidou, M., & Labanca, N. (2019). Progress in the implementation of the EU energy efficiency directive through the lens of the national annual reports. Energies, 12(6), 1107. https://doi.org/10.3390/en12061107