
 ?Mathematical formulae have been encoded as MathML and are displayed in this HTML version using MathJax in order to improve their display. Uncheck the box to turn MathJax off. This feature requires Javascript. Click on a formula to zoom.
Abstract
Progression towards environmental sustainability is mainly studied from the consumption or users’ perspective and urges the government to create social and cultural responsiveness towards ecological suitability. Also, it is pertinent that the level of compliance towards environmental regulations is highly dependent on the quality of socioeconomic status of the public and government interventions in terms of annual budgetary allocations in the respective industry or sector. Therefore, the study explores the government's participation through public expenditure in the entertainment and cultural sector and socioeconomic factors in realizing environmental sustainability in OECD countries. The data set consists of observations from 1990 to 2019 on which the advanced panel technique, namely; Cross Section ARDL was applied. The results reported that both the government budgetary allocations in entertainment and cultural industry and socioeconomic status are crucial for ensuring environmental sustainability as they assist in decreasing the level of carbon emissions. Manifestly, the magnitude of the interaction term empirically proves that when both government allocations and socioeconomic factors are integrated, the emissions mitigating effects turn more pronounced. These results imply that the appropriate budgetary allocations in entertainment and cultural industry promotes environmental performance channelized through people’s welfare, awareness, and satisfaction. Along with fiscal allocations, socioeconomic factors are imperative to maximize positive spillovers for ecological sustainability.
1. Introduction
Climate change has emerged as the largest challenge that is being faced by human beings in recent times, which is not just threatening for human health and well-being but also severely destroys their prosperity, security and natural life (Ahmed et al., Citation2019c; Akbar et al., Citation2021; Irfan et al., Citation2021d). In addition to this, such climate change also creates hurdles for humans with their accessibility to basic needs, including food, water and land, etc. (Ahmad et al., Citation2021; Elavarasan et al., Citation2021; Irfan et al., Citation2021b; Tanveer et al., Citation2021; Zhuang et al., Citation2021). The significance of this issue can be gauged with the fact that if this problem is not addressed properly, then it can further lead to enormous environment-oriented risks and volatilities, which can be further devastating and destructing in terms of scales and magnitude (Guo et al., Citation2021; Irfan et al., Citation2021a). Therefore, the concerns of the stakeholders and policymakers should revolve around the strategies by which pollution alleviation are not just ensured but should also be strategized by identifying the factors through which the continuous and gradual elimination of greenhouse gases are guaranteed (Lingyan et al. Citation2021; Sun et al., Citation2021).
Since the current era is said to be the time of industrialization, where economies are not just striving to meet the demand of their local people but they struggle to address the global demand by creating the most advanced products, offering timely value at affordable and competitive prices (Li et al., Citation2021; Razzaq et al., Citation2021b). However, the maximum number of solutions that are being proposed are for the manufacturing and service providers’ concerns. For instance, by improving their level of operational excellence through developing competitiveness capabilities (Ahmed et al., Citation2019b); optimizing the productivity and resources consumption (Wang et al., Citation2021); incorporating green innovations and environment-friendly technologies (He et al., Citation2021; Irfan & Ahmad, Citation2021; Razzaq et al., Citation2021d); adopting the philosophies of green supply chain management (Ahmed et al., Citation2019a); and transforming the consumption of energy towards renewable sources (Ozturk & Acaravci, Citation2013), etc. However, since all of these solutions are comparatively expense-driven and have the least financial benefits in a shorter period, organisations try to scapegoat the sustainable philosophies for financial gains and profits (He et al., Citation2021; Sharif et al., Citation2019; Sinha et al., 2020b).
It should also be noted that economies collaboratively or the international bodies have taken specific initiatives and understandings where they are agreed to comply with the sustainable philosophies and environmental well-being. For instance, in 1997, a protocol was agreed upon, called ‘Kyoto Protocol’ which discusses the idea of eradicating environmental pollution (Irfan et al., Citation2021a; Javaid et al., Citation2018; Xuefeng et al., Citation2021). In contrast, the vastly approved and endorsed in terms of the number of countries which has given their consent is known as ‘Paris Agreement’, in which the participating countries have degreed to control the level of global warming at their end by keeping their contribution below 2 °C on yearly basis (An et al., Citation2021; Gao et al., Citation2017). Hence, there is a need to have a collaborative approach not at the level of organizations but also at the individuals’ and government levels. The extent of damage to the environment and ecology is minimized and mitigated (Sharif et al., Citation2021; Zhang et al., Citation2021).
Here it should also be noted that individuals being the consumers and at the consumption, a level can only contribute in a limited manner, whereby they can enhance their responsible consumption by reducing the consumption of plastics (Khan et al., Citation2019a); and by increasing their participation in waste management (Irfan et al., Citation2021e; Razzaq et al., Citation2021a). Hence the major responsibility lies on the government institutions to make the masses, and general public complies with the environment and sustainable philosophies (Agarwal et al., Citation2018). Moreover, Najmi et al. (Citation2019) have summarized the available antecedents and determinants from the literature by which consumer environmental and sustainable behavior can be improved. The researchers reported three critical factors, among others, which can attain the environmental objectives. Firstly by creating the legitimate environment-oriented awareness which can derive the responsible consumption and behavior, secondly by the ascription of responsibility among consumers and thirdly by creating the knowledge through developing the norms of the society. In all of these objectives, the role of the government becomes crucial as the responsibility and duty of creating awareness, knowledge and making consumers understand about their commitment is primarily the duty of the government institutions (Ahmed et al., Citation2020; Irfan et al., Citation2020; Sarkis et al., Citation2011).
Since the role of the government institutions is significant in the alleviation of pollution and the purging of greenhouse gases in general and carbon emissions in particular (Goel et al., Citation2013; Irfan et al., Citation2021c; Razzaq et al., 2021c), it is wrongly understood that the government institutions need only to make the rule and regulations regarding environment protection and preservation; and forced individuals and organizations to comply to it so that they can achieve their environmental sustainability targets (Arminen & Menegaki, Citation2019). The other important element by which government could play their part most efficiently and productively is by the budget allocation towards campaigns that encourage individuals to behave environmentally and responsibly (Cristóbal et al., Citation2021). In addition to this, since the majority of the burden of achieving the sustainable goals lies on the government institutions, which is possible through the public expenditure they make in the respective areas (Irfan et al., Citation2021c; Kharas & McArthur, Citation2019); that should necessarily be in the range of 15 to 30 percent of the GDP (The Economist Intelligence Unit, Citation2020).
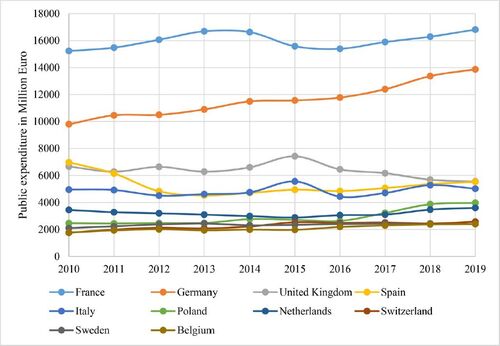
Moreover, since private investments are major profits driven; therefore they invest in the areas where they can reap higher profits and benefits, whereas the role of the state is of caretaker where they need to act for the welfare, which itself is beyond the financial gains (Cristóbal et al., Citation2021). Furthermore, the proper budget allocation and the subsequent expenditure towards recreation, entertainment and culture-oriented government spending can assist in enhancing the level of sustainability. Through this kind of spending, the government can raise awareness among the masses regarding sustainability, responsible consumption, and social responsibility towards health, society, ecology, and environment. The rationality of using these phenomena can also be gauged with the fact that in the OECD countries majority of the countries are not efficiently managing it as shown in . Suppose the economies are aware of the potential benefits of utilizing this spending environmentally and sustainably. In that case, they could have increased the level of budget allocation over time, which is not the case in actuality. In addition to this, Jeong et al. (Citation2020) concluded that recreation, entertainment and culture-oriented government spending could enhance the level of sustainable growth in the more extended period, which justifies the potential of this economic indicator as to the potential solution for creating awareness among the public and for environmental sustainability.
Figure 1. Public expenditure in recreation, and culture industry. Data source: Authors drawing using OECD public expenditure database.
On the other hand, the receptive quality of the masses and the general public, their education, aptitude, norms and learned behavior, in short, the socioeconomic factors also play a crucial role for responsible consumption and development of an economy (Khan & Hou, Citation2021; Najmi et al., Citation2019). In other words, sustainability cannot be expected from the people below poverty line and have no access or minimal access to the essentials for life. Hence to respond environmentally and socially responsible, the quality of socioeconomic factors is of crucial importance. More recently, a study was conducted on the dataset of 30 countries who are members of ‘International Energy Agency’. The role of socioeconomic factors was investigated as the tool to eradicate the carbon emissions based on the dataset from 1995 to 2018. However, these factors were reported to increase the level of carbon emissions as the economies having higher socioeconomic factors will also have higher urbanization, larger generation of economic activities, and a large proportion of populations.
Since recreation, entertainment and culture-oriented government spending and the quality of socioeconomic status have the ability to predict the pollution level; therefore the current study is an attempt to use them as the potential solution in eradicating the consumption-based carbon emissions. Furthermore, based on the nature of relatedness, it is also expected that their combined effect could also lead to further improvement; therefore, the current study also attempts to evaluate the interaction effect of both of them for environmental sustainability.
Based on the discussion above, the present study intends to contribute to the literature in multiple ways. Firstly, the current research has the novelty of its kind in which the role of public spending as the potential solution for creating awareness and the socioeconomic status is being utilized to eradicate pollution on the economic level. These phenomena are majorly studied on individual or organizational levels for guiding sustainable consumption behavior and sustainable performance, respectively. Secondly, the current study also explores the combined effect of both of these phenomena as this could lead to more insights into the inter-relationships and could predict more strongly. Thirdly, the current study is based on the dataset of the 10 economics belonging to the OECD countries who have sound economic infrastructure but are not using culture and recreational spending better (refer ). Lastly, the current study employs a recent and advanced estimation technique specifically designed for panel datasets namely ‘Cross-section augmented autoregressive distributed lags test’ (discussed later in further detail), for explaining the associations among the focused phenomena statistically.
2. Data
Since the current study intends to explore the role of public expenditure made in the entertainment and cultural industry integrated by the quality of socioeconomic status in excelling the environment sustainability in the geographical context of Top 10 OECD countries. Therefore, selecting appropriate proxies to measure the phenomena above is extremely crucial as only the relevant proxies will explain the research objectives. Nevertheless, the current study is based on the 30 observations each for every country mentioned in from 1990 to 2019, leading to 300 observations for every studied phenomenon. Moreover, for measuring the environment sustainability (ES), the data for consumption-based carbon emissions measure in the metric tons were extracted from the database of Global Carbon Atlas. Furthermore, the Public Expenditure on recreation and culture industry (ERCI) were measured in USD extracted from the database of OECD Statistics; Socio-Economic Status was measured through the index removed from the database of ICRG; whereas economic growth (GDP) was measured through the real GDP per capita in USD is also extracted from the database of OECD Statistics. The description of the variables studied along with their respective source is mentioned in .
Table 1. Variable’s description and data source.
3. Methodology
3.1. Slope coefficients homogeneity and Cross-Section independence test
The present study does not follow the majority of the studies is following the conventional methodological style of estimations by employing regular econometric techniques. Therefore, first and foremost, the assessment of ‘Slope Coefficients Homogeneity’ (SCH) was made along with the ‘Cross-Section Independence’ (CSI). The reason for addressing these issues includes that if they are not addressed in the earlier stage of the analysis, then it eventually increases the probabilities of discrepancies and biases in the outcome (Li et al., Citation2020; Ulucak & Khan, Citation2020; Zhuang et al., Citation2021). Hence, to assess the SCH, Baltagi and Hashem Pesaran (Citation2007) proposed the technique that serves the purpose, with an assumption of homogeneity in the coefficients as a crucial and important precondition with anticipation of probability of its lacking or existence. In addition to this, to evaluate the CSI, H. M. Pesaran (Citation2004) proposed a technique that can absorb the possibility of shocks, either internal or external, which is also crucial to ascertain as the world has witnessed the financial crises in 2007–2008 (Ji et al., Citation2021). The SCH has been described mathematically through EquationEqs. (1)(1)
(1) and Equation(2)
(2)
(2) .
(1)
(1)
(2)
(2)
Considering EquationEqs. (1)(1)
(1) and Equation(2)
(2)
(2) , the change in SCH is being referred by
whereas the change in Adjusted SCH is being referred by
3.2. Tests for unit root
The current study does not assess the presence of stationarity through the utilization of techniques that belongs to the first generation, including Im, Pesaran and Shin (IMPS) (Im et al., Citation2003) and Levin et al. (Citation2002) as they fails to address the issues pertaining to CSI. Therefore, the application of test proposed by H. M. Pesaran (Citation2007) is made which is denoted as ‘cross-section augment IMPS’ (CSIMPS) test. This technique is superior based on consistency, reliability and rigorousness while ascertaining the heterogeneity in the slope’s coefficients referred to as CSI. More precisely, in this estimation technique, the CSI has been established through the lags addition and considering the difference at the level first by the augmented and averaged cross-sections. The CSIMPS has been described mathematically through EquationEq. (3)(3)
(3) .
(3)
(3)
Considering EquationEq. (3)(3)
(3) ,
represents the averages which are taken at the first difference whereas
represents the lagged. The CSIMPS’s test statistic is described as:
(4)
(4)
Considering EquationEq. (4)(4)
(4) , CADF, which represents ‘cross-sectional augmented Dickey–Fuller’ is being employed along with EquationEq. (3)
(3)
(3) . The hypotheses statements of this test represent non-stationarity when null hypothesis is accepted, whereas stationarity when the null hypothesis is rejected.
3.3. Test for panel cointegration
The relationships representing cointegration in the focused variables, in the long run, are evaluated by applying a technique based on the framework of correction of errors proposed by Westerlund (Citation2007). This technique is reported to be of superior quality when it comes to estimation while comparing the conventional test of Pedroni and Kao (Khan et al., Citation2020a), whereas this also assists in ascertaining the error despite the existence CSI and SCH. This test has been described mathematically through EquationEqs. (5)–(8).
(5)
(5)
(6)
(6)
(7)
(7)
(8)
(8)
Considering Eqs. (5) and Equation(6)(6)
(6) , these equations are have been utilized for calculating the group’s mean statistics like
and
In addition to this, EquationEqs. (7)
(7)
(7) and Equation(8)
(8)
(8) have been utilized for calculating the panel’s mean statistics like
and
This test's hypothesis statements assume no cointegration when the null hypothesis is accepted and cointegration when the null hypothesis is rejected.
3.4. Cross-section augmented autoregressive distributed lags test
For the assessment of the association in both long run and short run among the focused variables of the current study, the utilization of an advanced, recent and latest technique, namely ‘Cross-section augmented autoregressive distributed lags test’ (CS-ARDL), is made following the proposition of Chudik and Pesaran (Citation2015). The reasons for selecting this technique includes rigorousness, robustness and efficiency, which makes this technique superior to those conventional techniques that are grounded on the methodological frameworks of ‘common correlated effect mean group’, ‘augmented mean group’, ‘pooled mean group’, and ‘mean group’ (Li et al., Citation2020). Moreover, this technique is not only immune to addressing the issue like CSI and SCH, but also capable to address the other statistical and methodological issues like endogeneity, absence of stationarity (also including order of integration that are mixed) and other variances which if are un-observed and un-ascertained then it could lead to dubious, vague and inferior outcomes (Zhuang et al., Citation2021). The CS-ARDL has been described mathematically through EquationEq. (9)(9)
(9) .
(9)
(9)
Considering EquationEq. (9)(9)
(9) ,
and
whereas the independent variables are denoted as W, which includes Public Expenditure on recreation, and culture industry; Socio-Economic Status; Economic growth. In addition to this, the validity of the outcome that whether they are reliable and robust, the application of ‘Augmented Mean Group test’ is made based on the propositions of Eberhardt (Citation2012). This test has the edge over other similar tests based on ‘pooled mean group’ and ‘mean group’ frameworks and can address those above methodological and statistical variances and biases.
The outcome generated from the application of all of the previous tests is discussed in the next section.
4. Estimations and results
Before applying any statistical test or evaluating any statistical assumptions, it is incredibly crucial to assess the descriptive of the data. Therefore, for the said purpose, the arithmetic means, minimum and maximum values were estimated along with the deviation from the mean, which refers to the standard deviation and reflects the overall spread of the data. For ES, the arithmetic means, minimum and maximum values were estimated as 0.657, 0.695, and 1.428, respectively, whereas the standard deviation is 0.356. Similarly, for ERCI, the arithmetic mean, minimum and maximum value were estimated 3.648, 3.210, and 4.965, respectively, whereas the standard deviation is 0.680. Moreover, for SEI, the arithmetic mean, minimum and maximum values were estimated 8.550, 6.041, and 10.17, respectively, whereas the standard deviation is 0.425. Lastly, for GDP, the arithmetic mean, minimum and maximum value were estimated 5.652, 3.710, and 8.724, respectively, whereas the standard deviation is 0.819. The estimated outcome from descriptive statistics are listed in .
Table 2. Descriptive statistics.
In the following step, the SCH assessment was made by applying the test proposed by Pesaran and Yamagata (Citation2008), which is originally based on the principles of Swamy's test (1970). This test is regarded as a reliable and robust test and is accordingly preferred for generating rigorous results (Alam et al., Citation2018). The hypothesis of this test states that SCH is present when the values are insignificant, leading to the acceptance of null hypothesis, whereas when SCH is absent in the situation of having values statistically significant, leading to the rejection of null hypothesis. Based on the estimated outcome from the SCH test listed in , there is heterogeneity of the slope as the outcome is not statistically insignificant, leading to the rejection of the null hypothesis.
Table 3. Results of slope homogeneity tests.
In the later stage, the assessment of CSI is made through the application of test of which the hypothesis statements has been elaborated as acceptance of null hypothesis is the indication of CSI. In contrast, the rejection of null hypothesis is an indication of dependence (Pesaran, Citation2015). The generated outcome listed in confirms the dependency of cross sections across of the studied phenomena.
Table 4. Results of cross-sectional dependence.
After the assessment of SCH and CSI, in the following step, the assessment of issues related to unit root is done, the absence of which confirms the stationarity of the data. By applying a cross-sectional-based test proposed by Pesaran (Citation2007), the results confirm the stationarity of the data at the first difference. The generated outcome of the CIPS test listed in demonstrates that the data is stationary at 1% level of significance.
Table 5. Results of stationary analysis.
In the next step, the assessment of the presence of integration in a longer time is made by the help of Westerlund (Citation2007). As already discussed, the statistically insignificant outcome means the absence of cointegration, whereas the statistically significant outcome means the presence of cointegration. The test result listed in confirms that the data possesses cointegration in a longer period.
Table 6. Westerlund (Citation2007) Panel cointegration Test.
After the assessment of the possibilities of inferiority in terms of biases and assuring the legitimacy of the data, the application of CS-ARDL, following the proposition of Chudik and Pesaran (Citation2015), is made in order to explain the nature and significance of the relationship between predictors and the criterion. Firstly, while exploring the nature and significance of the association between ERCI and ES, a negative and significant association at 1% level of significance is found. Since the proxy used to measure the ES is the level of carbon emissions incurred due to consumption; therefore it means that 1% escalation is ERCI can lead to the de-escalation of carbon emissions by 10.5%, which eventually improved the level of ES. Theoretically, the current findings support the idea of efficient allocation and relocation of ERCI for the betterment of ES and statistically justify its role in eradicating carbon emissions and improving environmental quality. Empirically, these outcomes support the ideology of the results reported by multiple researchers who urge to have coercive pressures from government institutions to better environmental quality (Agarwal et al., Citation2018; Ahmed et al., Citation2020; Sarkis et al., Citation2011).
Secondly, while exploring the nature and significance of the association between SEI and ES, a negative and significant association at 5% level of significance is found. Since the proxy used to measure the ES is the level of carbon emissions incurred due to consumption; therefore it means that 1% escalation is SEI can lead to the de-escalation of carbon emissions by 11.5% which eventually improved the level of ES. These results support the idea that for the penetration of the idea of environmental preservation and conservation, the masses and the general public need to have a sufficient kind of understanding (Khan et al., Citation2019a) that they comprehend the philosophy of sustainability of the environment and practices comply with it. In order to have the least destruction to the ecology, the perceived awareness and knowledge among the general public also need to be sufficient, which will eventually be derived when they possess the sound SEI (Khan et al., Citation2019b). Empirically, these outcomes support the ideology of the results reported by multiple researchers who urge to have suffice SEI to better environment quality (Salo et al., Citation2021; Zhang et al., Citation2015).
Thirdly and most importantly, while exploring the nature and significance of the association between the moderating variable (interaction term of ERCI and SEI) and ES, a negative and significant association at 5% level of significance is found. Since the proxy used to measure the ES is the level of carbon emissions incurred due to consumption; therefore it means that 1% escalation in both ERCI and SEI can lead to the de-escalation of carbon emissions by 12.4%, which eventually improved the level of ES. Precisely, despite the level of significance that the interaction term possesses, the joint effect of both ERCI and SEI also explains the higher level of ES. In other words, while comparing the coefficients, it is evident that both ERCI and SEI individually have an effect comparatively lower than the combined effect. It supports the idea of the magnitude of having the appropriate allocation of budget for mitigating carbon emissions.
Lastly, while exploring the nature and significance of the association between the control variable, which is GDP and ES, a positive and significant association at 1% level of significance is found. Since the proxy used to measure the ES is the level of carbon emissions incurred due to consumption; therefore it means that 1% escalation in GDP can lead to the escalation of carbon emissions by 85.7%, which eventually deteriorate the level of ES. The current findings support the idea that majority of the economic activities and the national production are being made and generated at the cost of ecology and the environment. It is either because of not getting the advanced technology for production and generation of economic activities that are environment friendly or are they following the philosophy of sustainability, which eventually increases the level of carbon emissions and worsens the ecology, health, and well-being. Empirically these outcome supports the ideology of the results reported by multiple researchers who identify GDP a destructive force to the environment quality (see Awan et al., Citation2020; Balsalobre-Lorente et al., Citation2020; Khan et al., Citation2020b; Razzaq et al., Citation2021b).
The interpretation of the outcome generated for the shorter time revealed similar findings in terms of nature and significance while comparing it with the outcome for the longer period. For instance, while exploring the nature and importance of the association between ERCI and ES, a negative and significant association at 5% level of significance is found. Moreover, while exploring the nature and significance of the association between SEI and ES, a negative and significant association at 5% level of significance
is found. Most importantly, while exploring the nature and significance of the association between the moderating variable (interaction term of ERCI and SEI) and ES, a negative and significant association at 5% level of significance
is found. Lastly, while exploring the nature and significance of the association between the control variable which is GDP and ES, a positive and significant association at 1% level of significance
is found. These findings are similar to the outcome generated for the longer period, but the level of strength are different, which could be due to the difference of period. The theoretical interpretation of these outcomes is already mentioned earlier. The generated outcome of the CS-ARDL listed in confirms the associations in terms of different statistical magnitude and the level of significance; however, in terms of the nature of the association, the generated outcome is same. The outcome generated are listed in .
Table 7. Results of CS-ARDL
In the last step, the robustness of the outcome generated through the application of CS-ARDL was assessed with the help of ‘Augmented Mean Group Test’ based on the propositions of Eberhardt (Citation2012). The similarity of the strength, nature and significance of the outcome generated through AMG validate the findings generated through the application of CS-ARDL. Precisely, the outcome of EPSI, REC and their interaction (EPSI*REC) emerge as the favorable phenomena for eliminating the level of carbon emissions and in sustaining ES by 12.3%, 10.7% and 12.9%, respectively. On the other hand, the role of GDP was found to contribute to carbon emissions as it further enhances it by 75.4%. The generated outcome of the ‘Augmented Mean Group Test’ are listed in .
Table 8. Robustness from AMG estimator.
5. Conclusion and recommendations
Despite of the fact that economies collaboratively or the international bodies have taken certain initiatives and understandings where they are agreed to comply with sustainable philosophies and environmental well-being, Climate change remained as the largest challenge that is being faced by human beings in recent times, which is not just threatening for the human health and well-being but also severely destructs their prosperity, security and natural life. Hence there is a need to have a collaborative approach not at the level of organizations but also at the individuals’ and government level by which the extent of damage to the environment and ecology is minimized and mitigated.
There are many potential solutions that are explored in the literature for countering the level of carbon emissions, however, they are majorly focused on the organizational and individuals’ level. However, the role of government which acts as the initiating force for such pollution eradication, is least explored precisely in creating awareness and spreading knowledge among the masses regarding sustainable and responsible consumption and development (Iqbal et al., Citation2021). Therefore, this study attempts to explore the participation from the government through public expenditure in entertainment and cultural industry and socioeconomic factors in realizing environmental sustainability in OECD countries. The data set consists of observations from 1990 to 2019 on which the advanced panel technique, namely; Cross Section ARDL was applied.
Based on the estimations, the results revealed similar findings among the focused variables for both the long and short run. A negative and significant association was reported between ERCI and ES; and between SEI and ES. Most importantly, while exploring the nature and significance of the association between the moderating variable (interaction term of ERCI and SEI) and ES, the combined effect of both ERCI and SEI also explains the higher level of ES. In other words, while comparing the coefficients, it is evident that both ERCI and SEI individually have an effect comparatively lower than the combined effect.
Based on the findings, the present study offers several managerial and policy implications. First and foremost, since the current research has revealed a supporting role of government spending for eradicating environmental pollution and improving sustainability, the countries need to enhance the amount of budget allocated in the said account. The data summarized in clearly shows that the countries have not improved the budget and the amount allocated under the said head, whereas if there is further advancement, there could be more expenditure towards sustainability. Secondly, the efficient channelizing of the allocated budget is crucial to serving the purpose. Here, it should be noted that allocating sufficient budget and making funds available to be consumed could not serve the purpose. The government institutions should devise proper strategies and accordingly strategise the expenditure to get maximum benefits from the expenditure. Thirdly, the government could devise marketing campaigns to communicate sustainable philosophies to the general masses and public. Fourthly, since the socioeconomic factors also emerge as the potential solution, there are many ways by which an improvement can be made in the said area. These include adding sustainable philosophies into the education and academic curriculum of the students so that the public are being educated about responsible and sustainable consumption. In addition to this, there is a need to have human development that can be done other than academic education. For that purpose, vocational and recreational training can serve the purpose. Fifthly, there is a need to have precise sustainable oriented laws and rules through which the regular monitoring can be done of the routine activities of the public like visiting parks, driving pollution emitting vehicles, making excessive purchases of food and other living essentials. Furthermore, a precise way of living should be communicated to the public regarding social and responsible consumption, whereas taxes and penalties can also be imposed on the violations that are being made by not following the rules and regulations. Lastly, the government should share and increase the transparency of the data related to the pollution and achievement of the sustainable goals in bulletins, newspapers, and advertising campaigns in all of the communicating channels, including social and print media, so that the public is regularly informed about how well they are progressing towards achieving the sustainable goals.
Finally, the current study also provides different avenues for future potential research based on the limitations. Among them, the most important could be further exploring the discussed phenomena, in precise, the proxies used in the current study so that the literature related to sustainability can be given a new and broad dimension. In addition to this, the model of the present study needs to be explored in other geographical contexts, especially in the high carbon polluting countries, so that the legitimacy of the said phenomena can be validated through the exploration of different contexts, which can also be helpful in further broadening the literature. Lastly, the overall trend of the data can have various sub-components. Therefore the findings can be validated by the techniques through which more insights from the data can be explained. Such estimations can include methods based on the wavelet framework, whereas quantile-based regressions can also explain the phenomena more appropriately.
References
- Agarwal, A., Giraud-Carrier, F. C., & Li, Y. (2018). A mediation model of green supply chain management adoption: The role of internal impetus. International Journal of Production Economics, 205, 342–358. https://doi.org/10.1016/j.ijpe.2018.09.011
- Ahmad, B., Da, L., Asif, M. H., Irfan, M., Ali, S., & Akbar, M. I. U. D. (2021). Understanding the antecedents and consequences of service-sales ambidexterity: A motivation-opportunity-ability (MOA) framework. Sustainability, 13(17), 9675.
- Ahmed, W., Ashraf, M. S., Khan, S. A., Kusi-Sarpong, S., Arhin, F. K., Kusi-Sarpong, H., & Najmi, A. (2020). Analyzing the impact of environmental collaboration among supply chain stakeholders on a firm’s sustainable performance. Operations Management Research, 1–18.
- Ahmed, W., Najmi, A., Arif, M., & Younus, M. (2019a). Exploring firm performance by institutional pressures driven green supply chain management practices. Smart and Sustainable Built Environment, 8(5), 415–437. https://doi.org/10.1108/SASBE-04-2018-0022
- Ahmed, W., Najmi, A., Mustafa, Y., & Khan, A. (2019b). Developing model to analyze factors affecting firms’ agility and competitive capability: A case of a volatile market. Journal of Modelling in Management, 14(2), 476–491. https://doi.org/10.1108/JM2-07-2018-0092
- Ahmed, Z., Wang, Z., & Ali, S. (2019c). Investigating the non-linear relationship between urbanization and CO 2 emissions: An empirical analysis. Air Quality, Atmosphere & Health, 12(8), 945–953. https://doi.org/10.1007/s11869-019-00711-x
- Akbar, M., Hussain, A., Akbar, A., & Ullah, I. (2021). The dynamic association between healthcare spending, CO2 emissions, and human development index in OECD countries: Evidence from panel VAR model. Environment, Development and Sustainability, 23(7), 10470–10489. https://doi.org/10.1007/s10668-020-01066-5
- Alam, M. S., Miah, M. D., Hammoudeh, S., & Tiwari, A. K. (2018). The nexus between access to electricity and labour productivity in developing countries. Energy Policy, 122, 715–726. https://doi.org/10.1016/j.enpol.2018.08.009
- An, H., Razzaq, A., Nawaz, A., Noman, S. M., & Khan, S. A. R. (2021). Nexus between green logistic operations and triple bottom line: Evidence from infrastructure-led Chinese outward foreign direct investment in Belt and Road host countries. Environmental Science and Pollution Research, 28, 51022–51045.
- Arminen, H., & Menegaki, A. N. (2019). Corruption, climate and the energy-environment-growth nexus. Energy Economics, 80, 621–634. https://doi.org/10.1016/j.eneco.2019.02.009
- Awan, A. M., Azam, M., Saeed, I. U., & Bakhtyar, B. (2020). Does globalization and financial sector development affect environmental quality? A panel data investigation for the Middle East and north African countries. Environmental Science and Pollution Research International, 27(36), 45405–45418. https://doi.org/10.1007/s11356-020-10445-4
- Balsalobre-Lorente, D., Driha, O. M., Shahbaz, M., & Sinha, A. (2020). The effects of tourism and globalization over environmental degradation in developed countries. Environmental Science and Pollution Research International, 27(7), 7130–7144. https://doi.org/10.1007/s11356-019-07372-4
- Baltagi, B. H., & Hashem Pesaran, M. (2007). Heterogeneity and cross section dependence in panel data models: Theory and applications introduction. Journal of Applied Econometrics, 22(2), 229–232. https://doi.org/10.1002/jae.955
- Chudik, A., & Pesaran, M. H. (2015). Common correlated effects estimation of heterogeneous dynamic panel data models with weakly exogenous regressors. Journal of Econometrics, 188(2), 393–420. https://doi.org/10.1016/j.jeconom.2015.03.007
- Cristóbal, J., Ehrenstein, M., Domínguez-Ramos, A., Galán-Martín, Á., Pozo, C., Margallo, M., Aldaco, R., Jiménez, L., Irabien, Á., & Guillén-Gosálbez, G. (2021). Unraveling the links between public spending and Sustainable Development Goals: Insights from data envelopment analysis. Science of the Total Environment, 786, 147459. https://doi.org/10.1016/j.scitotenv.2021.147459
- Eberhardt, M. (2012). Estimating panel time-series models with heterogeneous slopes. The Stata Journal: Promoting Communications on Statistics and Stata, 12(1), 61–71. https://doi.org/10.1177/1536867X1201200105
- Elavarasan, R. M., Leoponraj, S., Dheeraj, A., Irfan, M., Gangaram Sundar, G., & Mahesh, G. K. (2021). PV-Diesel-Hydrogen fuel cell based grid connected configurations for an institutional building using BWM framework and cost optimization algorithm. Sustainable Energy Technologies and Assessments, 43, 100934. https://doi.org/10.1016/j.seta.2020.100934
- Gao, Y., Gao, X., & Zhang, X. (2017). The 2 C global temperature target and the evolution of the long-term goal of addressing climate change—from the United Nations framework convention on climate change to the Paris agreement. Engineering, 3(2), 272–278. https://doi.org/10.1016/J.ENG.2017.01.022
- Goel, R. K., Herrala, R., & Mazhar, U. (2013). Institutional quality and environmental pollution: MENA countries versus the rest of the world. Economic Systems, 37(4), 508–521. https://doi.org/10.1016/j.ecosys.2013.04.002
- Guo, J., Zhou, Y., Ali, S., Shahzad, U., & Cui, L. (2021). Exploring the role of green innovation and investment in energy for environmental quality: An empirical appraisal from provincial data of China. Journal of Environmental Management, 292, 112779.
- He, X., Mishra, S., Aman, A., Shahbaz, M., Razzaq, A., & Sharif, A. (2021). The linkage between clean energy stocks and the fluctuations in oil price and financial stress in the US and Europe? Evidence from QARDL approach. Resources Policy, 72, 102021. https://doi.org/10.1016/j.resourpol.2021.102021
- Im, K. S., Pesaran, M. H., & Shin, Y. (2003). Testing for unit roots in heterogeneous panels. Journal of Econometrics, 115(1), 53–74. https://doi.org/10.1016/S0304-4076(03)00092-7
- Iqbal, W., Ming, Y., Yin, K., & Irfan, M. (2021). Nexus between air pollution and NCOV-2019 in China: Application of negative binomial regression analysis. Process Safety and Environmental Protection, 150, 557–565. https://doi.org/10.1016/j.psep.2021.04.039
- Irfan, M., & Ahmad, M. (2021). Relating consumers' information and willingness to buy electric vehicles: Does personality matter? Transportation Research Part D: Transport and Environment, 100, 103049. https://doi.org/10.1016/j.trd.2021.103049
- Irfan, M., Elavarasan, R. M., Hao, Y., Feng, M., & Sailan, D. (2021a). An assessment of consumers’ willingness to utilize solar energy in China: End-users’ perspective. Journal of Cleaner Production, 292, 126008. https://doi.org/10.1016/j.jclepro.2021.126008
- Irfan, M., Hao, Y., Ikram, M., Wu, H., Akram, R., & Rauf, A. (2021b). Assessment of the public acceptance and utilization of renewable energy in Pakistan. Sustainable Production and Consumption, 27, 312–324. https://doi.org/10.1016/j.spc.2020.10.031
- Irfan, M., Ikram, M., Ahmad, M., Wu, H., & Hao, Y. (2021c). Does temperature matter for COVID-19 transmissibility? Evidence across Pakistani provinces. Environmental Science and Pollution Research International, 28(42), 59705–59715. https://doi.org/10.1007/s11356-021-14875-6
- Irfan, M., Razzaq, A., Suksatan, W., Sharif, A., Elavarasan, R. M., Yang, C., Hao, Y., & Rauf, A. (2021d). Asymmetric impact of temperature on COVID-19 spread in India: Evidence from quantile-on-quantile regression approach. Journal of Thermal Biology, 103101. https://doi.org/10.1016/j.jtherbio.2021.103101
- Irfan, M., Zhao, Z. Y., Rehman, A., Ozturk, I., & Li, H. (2021e). Consumers' intention-based influence factors of renewable energy adoption in Pakistan: A structural equation modeling approach. Environmental Science and Pollution Research International, 28(1), 432–445. https://doi.org/10.1007/s11356-020-10504-w
- Irfan, M., Zhao, Z. Y., Ikram, M., Gilal, N. G., Li, H., & Rehman, A. (2020). Assessment of India's energy dynamics: Prospects of solar energy. Journal of Renewable and Sustainable Energy, 12(5), 053701. https://doi.org/10.1063/1.5140236
- Javaid, A., Akbar, A., & Nawaz, S. (2018). A review on human development index. Pakistan Journal of Humanities and Social Sciences, 6(3), 357–369. https://doi.org/10.52131/pjhss.2018.0603.0052
- Jeong, S. H., Lee, Y., & Kang, S. H. (2020). Government spending and sustainable economic growth: Based on first-and second-level COFOG data. Public Money & Management, 40(2), 140–148. https://doi.org/10.1080/09540962.2019.1651035
- Ji, X., Umar, M., Ali, S., Ali, W., Tang, K., & Khan, Z. (2021). Does fiscal decentralization and eco‐innovation promote sustainable environment? A case study of selected fiscally decentralized countries. Sustainable Development, 29(1), 79–88. https://doi.org/10.1002/sd.2132
- Khan, F., Ahmed, W., & Najmi, A. (2019a). Understanding consumers’ behavior intentions towards dealing with the plastic waste: Perspective of a developing country. Resources, Conservation and Recycling, 142, 49–58. https://doi.org/10.1016/j.resconrec.2018.11.020
- Khan, F., Ahmed, W., Najmi, A., & Younus, M. (2019b). Managing plastic waste disposal by assessing consumers' recycling behavior: The case of a densely populated developing country. Environmental Science and Pollution Research International, 26(32), 33054–33066. https://doi.org/10.1007/s11356-019-06411-4
- Khan, Z., Ali, M., Jinyu, L., Shahbaz, M., & Siqun, Y. (2020a). Consumption based carbon emissions and trade nexus: Evidence from nine oil exporting countries. Energy Economics, 89, 104806. https://doi.org/10.1016/j.eneco.2020.104806
- Khan, A., Chenggang, Y., Hussain, J., Bano, S., & Nawaz, A. A. (2020b). Natural resources, tourism development, and energy-growth-CO2 emission nexus: A simultaneity modeling analysis of BRI countries. Resources Policy, 68, 101751. https://doi.org/10.1016/j.resourpol.2020.101751
- Khan, I., & Hou, F. (2021). The impact of socioeconomic and environmental sustainability on CO2 emissions: A novel framework for thirty IEA countries. Social Indicators Research, 155(3), 1045–1076. https://doi.org/10.1007/s11205-021-02629-3
- Kharas, H., & McArthur, J. (2019). Building the SDG economy: Needs, spending and financing for universal achievement of the Sustainable Development Goals. Global Economy and Development at Brookings - Working Paper 131.
- Levin, A., Lin, C.-F., & Chu, C.-S J. (2002). Unit root tests in panel data: Asymptotic and finite-sample properties. Journal of Econometrics, 108(1), 1–24. https://doi.org/10.1016/S0304-4076(01)00098-7
- Li, G., He, Q., Wang, D., & Liu, B. (2021). Environmental non-governmental organizations and air-pollution governance: Empirical evidence from OECD countries. PLOS One, 16(8), e0255166. https://doi.org/10.1371/journal.pone.0255166
- Li, J., Zhang, X., Ali, S., & Khan, Z. (2020). Eco-innovation and energy productivity: New determinants of renewable energy consumption. Journal of Environmental Management, 271(June), 111028. https://doi.org/10.1016/j.jenvman.2020.111028
- Lingyan, M., Zhao, Z., Malik, H. A., Razzaq, A., An, H., & Hassan, M. (2021). Asymmetric impact of fiscal decentralization and environmental innovation on carbon emissions: Evidence from highly decentralized countries. Energy & Environment, 0958305X211018453.
- Najmi, A., Kanapathy, K., & Aziz, A. A. (2019). Prioritising factors influencing consumers' reversing intention of e-waste using analytic hierarchy process. International Journal of Electronic Customer Relationship Management, 12(1), 58–74. https://doi.org/10.1504/IJECRM.2019.098981
- Ozturk, I., & Acaravci, A. (2013). The long-run and causal analysis of energy, growth, openness and financial development on carbon emissions in Turkey. Energy Economics, 36, 262–267. https://doi.org/10.1016/j.eneco.2012.08.025
- Pesaran, M. H. (2007). A simple panel unit root test in the presence of cross-section dependence. Journal of Applied Econometrics, 22(2), 265–312. https://doi.org/10.1002/jae.951
- Pesaran, M. H. (2015). Testing weak cross-sectional dependence in large panels. Econometric Reviews, 34(6–10), 1089–1117. https://doi.org/10.1080/07474938.2014.956623
- Pesaran, M. H., & Yamagata, T. (2008). Testing slope homogeneity in large panels. Journal of Econometrics, 142(1), 50–93. https://doi.org/10.1016/j.jeconom.2007.05.010
- Pesaran, H. M. (2004). General diagnostic tests for cross-sectional dependence in panels. University of Cambridge, Cambridge Working Papers in Economics, 435.
- Razzaq, A., Ajaz, T., Li, J. C., Irfan, M., & Suksatan, W. (2021a). Investigating the asymmetric linkages between infrastructure development, green innovation, and consumption-based material footprint: Novel empirical estimations from highly resource-consuming economies. Resources Policy, 74, 102302. https://doi.org/10.1016/j.resourpol.2021.102302
- Razzaq, A., Sharif, A., Ahmad, P., & Jermsittiparsert, K. (2021b). Asymmetric role of tourism development and technology innovation on carbon dioxide emission reduction in the Chinese economy: Fresh insights from QARDL approach. Sustainable Development, 29(1), 176–193. https://doi.org/10.1002/sd.2139
- Razzaq, A., Sharif, A., Najmi, A., Tseng, M. L., & Lim, M. K. (2021c). Dynamic and causality interrelationships from municipal solid waste recycling to economic growth, carbon emissions and energy efficiency using a novel bootstrapping autoregressive distributed lag. Resources, Conservation and Recycling, 166(December 2020), 105372. https://doi.org/10.1016/j.resconrec.2020.105372
- Razzaq, A., Wang, Y., Chupradit, S., Suksatan, W., & Shahzad, F. (2021d). Asymmetric inter-linkages between green technology innovation and consumption-based carbon emissions in BRICS countries using quantile-on-quantile framework. Technology in Society, 66, 101656. https://doi.org/10.1016/j.techsoc.2021.101656
- Salo, M., Savolainen, H., Karhinen, S., & Nissinen, A. (2021). Drivers of household consumption expenditure and carbon footprints in Finland. Journal of Cleaner Production, 289, 125607. https://doi.org/10.1016/j.jclepro.2020.125607
- Sarkis, J., Zhu, Q., & Lai, K. H. (2011). An organizational theoretic review of green supply chain management literature. International Journal of Production Economics, 130(1), 1–15. https://doi.org/10.1016/j.ijpe.2010.11.010
- Sharif, A., Bhattacharya, M., Afshan, S., & Shahbaz, M. (2021). Disaggregated renewable energy sources in mitigating CO2 emissions: New evidence from the USA using quantile regressions. Environmental Science and Pollution Research, 28, 57582–57601.
- Sharif, A., Raza, S. A., Ozturk, I., & Afshan, S. (2019). The dynamic relationship of renewable and nonrenewable energy consumption with carbon emission: A global study with the application of heterogeneous panel estimations. Renewable Energy, 133, 685–691. https://doi.org/10.1016/j.renene.2018.10.052
- Sun, Y., Duru, O. A., Razzaq, A., & Dinca, M. S. (2021). The asymmetric effect eco-innovation and tourism towards carbon neutrality target in Turkey. Journal of Environmental Management, 299, 113653.
- Swamy, P. A. (1970). Efficient inference in a random coefficient regression model. Econometrica, 38(2), 311–323. https://doi.org/10.2307/1913012
- Tanveer, A., Zeng, S., Irfan, M., & Peng, R. (2021). Do perceived risk, perception of self-efficacy, and openness to technology matter for solar PV adoption? An application of the extended theory of planned behavior. Energies, 14(16), 5008.
- The Economist Intelligence Unit. (2020). The future of public spending – why the way we spend is critical to the Sustainable Development Goals.
- Ulucak, R., & Khan, S. U. D. (2020). Does information and communication technology affect CO2 mitigation under the pathway of sustainable development during the mode of globalization? Sustainable Development, 28, 857–867. https://doi.org/10.1002/sd.2041
- Wang, L., Luo, G. L., Sharif, A., & Dinca, G. (2021). Asymmetric dynamics and quantile dependency of the resource curse in the USA. Resources Policy, 72, 102104. https://doi.org/10.1016/j.resourpol.2021.102104
- Westerlund, J. (2007). Testing for error correction in panel data. Oxford Bulletin of Economics and Statistics, 69(6), 709–748. https://doi.org/10.1111/j.1468-0084.2007.00477.x
- Xuefeng, Z., Razzaq, A., Gokmenoglu, K. K., & Rehman, F. U. (2021). Time varying interdependency between COVID-19, tourism market, oil prices, and sustainable climate in United States: Evidence from advance wavelet coherence approach. Economic Research-Ekonomska Istraživanja, 1–23. https://doi.org/10.1080/1331677X.2021.1992642
- Zhang, H., Razzaq, A., Pelit, I., & Irmak, E. (2021). Does freight and passenger transportation industries are sustainable in BRICS countries? Evidence from advance panel estimations. Economic Research-Ekonomska Istraživanja, 1–21. https://doi.org/10.1080/1331677X.2021.2002708
- Zhang, X., Luo, L., & Skitmore, M. (2015). Household carbon emission research: An analytical review of measurement, influencing factors and mitigation prospects. Journal of Cleaner Production, 103, 873–883. https://doi.org/10.1016/j.jclepro.2015.04.024
- Zhuang, Y., Yang, S., Razzaq, A., & Khan, Z. (2021). Environmental impact of infrastructure-led Chinese outward FDI, tourism development and technology innovation: A regional country analysis. Journal of Environmental Planning and Management, 1–33. https://doi.org/10.1080/09640568.2021.1989672