
 ?Mathematical formulae have been encoded as MathML and are displayed in this HTML version using MathJax in order to improve their display. Uncheck the box to turn MathJax off. This feature requires Javascript. Click on a formula to zoom.
Abstract
The aim of this study is to examine the impact of international tourism on economic growth and carbon emissions by using the Panel VAR model in selected OECD countries. By using yearly data for the periods of 1995 and 2020, we examine the dynamic relationship between international tourism, economic growth, and carbon emissions using the Granger causality test and impulse responses analysis. Although we could not determine the presence of a causal link between the variables using the Granger causality test, impulse responses analysis confirmed that responses of carbon emissions and economic growth to an unexpected international tourism shock are positive and significant. On the other hand, impulse responses analysis results show that responses of carbon emissions and economic growth to unexpected international tourism are positive and significant. The empirical findings also indicated that the responses of carbon emissions to an unexpected international tourism shock are higher than the responses of economic growth to an unexpected international tourism shock and these findings indicate that the negative impact of international tourism on environmental quality is greater than its positive impact on economic growth. Policymakers should take actions and measures to reduce the impact of international tourism on environmental deterioration. Improvements and dissemination of eco-friendly technologies in all tourism activities may help to reduce the negative impact of international tourism on carbon emissions.
1. Introduction
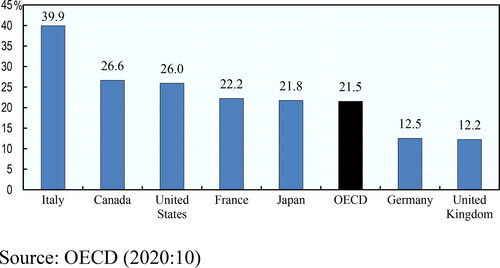
Following many decades of providing economic and social benefits, tourism remains one of the world’s most important economic sectors. Tourism can generate social impacts ranging from offering to meet different cultures and economic support to the creation of income and employment. Indeed, there is a strong correlation between tourism, economic growth, and employment (Akadiri et al., Citation2020; Azam et al., Citation2018; Ballı, Citation2021). It is estimated that approximately 12% of world GNP comes from the tourism industry (OECD, Citation2021). Increasing tourism activities have a positive effect on several sectors such as transportation, agriculture, construction, health, and the service sector. Particularly international tourism activities cause foreign exchange inflows to the hosting countries and hence it helps to reduce current account deficits. Therefore, the tourism sector is supported by most of the countries and thus, tourism expenditures have significantly increased over the last 20 years globally. While tourism expenditures were about 577.5 trillion dollars in 2000, they increased to 1079.5 trillion dollars in 2010 and 1549.6 trillion dollars in 2019. Parallel to the nominal increase in tourism revenues, the share of tourism revenues in world GDP has increased in the last 20 years. Hence, tourism revenues to world GDP ratios were calculated as 1.71%, 1.63%, and 1.77% in 2000, 2010, and 2019, respectively (Worldbank, Citation2021). Increasing tourism revenues provides an opportunity to make new investments and enable sustainable economic development for the countries through different macroeconomic indicators such as employment, economic growth, and current account balance (Brida & Risso, Citation2009; Paramati et al., Citation2017; Tang & Tan, Citation2013). illustrates some of the selected OECD countries and the tourism sector's contribution to the service export. According to , while the OECD average is 21.5%, Italy recorded the highest with the rate of 39.9%.
Figure 1. Contribution of tourism to service exports, selected OECD countries, 2018.
However, every plus has a minus. While the tourism sector induces economic activity, it also leads to increase energy consumption and electricity usage which causes increasing carbon emissions and environmental degradation. The domestic and international tourism activities significantly increase carbon footprint and carbon emissions that are the main indicators of global warming and climate change, due to subsectors that are related to tourism such as transportation, goods, food and beverage, agriculture, services, lodging, and construction, and mining (Lenzen et al., Citation2018; STI, Citation2021). Among these sectors, transportation comes to the fore, and carbon emissions due to tourism-based transportation are estimated to reach 1998 mt and it corresponds to a 25% increase compared to 2016 (UNWTO & ITF, Citation2019).
There has been a broad literature on tourism, its contribution to economic performance, and its effects on environmental quality. Besides, although most of the studies analyze the relationship between tourism and economic growth in the literature, there is also a growing literature focusing on examining the relationship between tourism and other sectors that are affected by tourism (Cao et al., Citation2021; Haven‐Tang & Jones, Citation2008; Zha et al., Citation2019).
Several factors affect carbon emissions such as economic growth, energy consumption, financial developments, foreign trade, and urbanization (Koçak et al., Citation2020). This study aims to examine the dynamic relationship between international tourism, economic growth, and carbon emissions in OECD countries. Although the impact of international tourism on economic growth and carbon emissions has been widely examined in the literature, these studies generally employ regression models by using time series and panel data. Besides, most of the studies find the bidirectional relationship between tourism and economic growth (Lee & Chang, Citation2008; Samimi et al., Citation2011; Seghir et al., Citation2015), and carbon emissions (Akadiri et al., Citation2020; Dumitrescu & Hurlin, Citation2012; Koçak et al., Citation2020). Also, Shan and Wilson (Citation2001) and Khoshnevis Yazdi et al. (Citation2017) found evidence in favor of a bidirectional relationship between tourism and foreign trade. These empirical findings show that the relationship between tourism, economic growth, and carbon emissions cannot be determined by using a single equation since it is not easy to identify the variables as endogenous or exogenous. Therefore, a more comprehensive model that considers all variables as endogenous should be employed. At this point, we employ the panel vector autoregression model suggested by Abrigo and Love (Citation2016) to examine the dynamic relationship between international tourism, carbon emissions, and economic growth. To the best of our knowledge, this study is the first research to examine the relationship between the variables in question by using the panel vector autoregression model. The dynamic relationship between the variables is examined by using the Granger causality test and impulse responses analysis. To avoid obtaining spurious findings, we use energy consumption, gross fixed capital formation, and foreign trade as control variables in the model estimations. The rest of the paper is organized as follows: Sec. 2 consists of a brief literature review and an econometric framework is given in Sec. 3. Empirical results are presented in Secs. 4 and 5 concludes.
2. Literature review
There has been extensive literature that focuses on the relationship between tourism, economic growth, and carbon emissions. Empirical studies show that while tourism promotes economic growth, the relationship between tourism and carbon emissions is mixed.
Robaina-Alves et al. (Citation2016) investigated the determinants of carbon emissions by using sub-sectors of tourism. They used sectoral data on fossil energy consumption, total energy consumption, tourism expenditures, the economic structure of tourism, and touristic activities for the periods of 2000–2008. Empirical results showed that carbon emissions are significantly affected by tourism. Dogan and Aslan (Citation2017) examined the impacts of real GDP, energy consumption, and international tourism on carbon emissions by using heterogeneous panel data analysis. Panel regression model results showed that while there is a positive relationship between energy consumption and carbon emissions, an increase in the GDP and international tourism causes to decrease in carbon emissions. Granger causality test results reveal that there is a unidirectional causality running from tourism to carbon emissions. They also determined the presence of a bidirectional causality link among carbon emissions, energy consumption, and GDP. Paramati et al. (Citation2017) analyzed the effect of tourism on economic growth and carbon emissions in developing and developed countries. The analysis results showed that the impact of tourism on economic growth and carbon emissions varies due to developed and developing countries, and the negative impact of international tourism on carbon emissions is significantly higher in developing countries than in developed countries.
Zhang and Zhang (Citation2018) examined the impact of carbon tax policy on carbon emissions and economic welfare with a computable general equilibrium model in China tourism industry. By using different carbon tax scenarios in the simulation studies, they found that changes in the carbon tax policy significantly affect tourism-related carbon emissions and economic welfare. Also, they documented that this effect varies both due to sectors of the tourism industry and time. Shi et al. (Citation2020) analyzed the relationship between tourism expenditures, economic growth, carbon emissions, and primary energy consumption with panel cointegration analysis for the countries that have different incomes. According to the results of the analysis, the negative impact of tourism on carbon emissions is more pronounced in low-income countries than high-income countries in the long run.
Koçak et al. (Citation2020) investigated the relationship between tourism and carbon emissions by using panel data for the 10 most visited countries for the periods of 1995–2014. Their empirical results showed that while the arrival tourist number increases carbon emissions, an increase in tourism receipts leads to a decrease in carbon emissions. Also, Granger causality test results indicate the presence of a bidirectional causal link between tourism and carbon emissions. Khan et al. (Citation2020) analyzed the relationship between tourism and natural resources in the energy-growth-carbon emissions nexus by using a simultaneous equations framework in 51 Belt & Road Initiative (BRI) countries. Empirical results show that there is bidirectional causality between income and tourism and carbon emissions are significantly affected by carbon emissions. Leitão and Lorente (Citation2020) studied the presence of the long and short-run relationship among the economic growth, renewable energy, tourist arrivals, trade openness, and carbon emissions in the European Union countries. Empirical results emphasize that an increase in tourism arrivals decreases carbon emissions. Moreover, Dumitrescu-Hurlin causality test results show that tourism arrivals are a Granger cause of the carbon emissions, trade openness, and renewable energy consumptions.
Grythe and Lopez-Aparicio (Citation2021) investigated the effect of domestic and international tourism on carbon emissions in Norway and stated that the main driver of carbon emissions from tourism is transportation specifically the airplane. In addition, they concluded that touristic activity by cruise and the private vehicle has significant impacts on carbon emissions. Neger et al. (Citation2021) determined similar results for Austria and tourism-related transportations such as airplane, private vehicle, and bus causes to increase carbon emissions in which private vehicle use is in the first place. Cao et al. (Citation2021) examined the relationship between carbon tax, economic uncertainty, and tourism for 12 tourism-related sectors in China by using the Dynamic Stochastic General Equilibrium (DSGE) model. They emphasized that there is a positive effect of carbon taxes on output and carbon emissions and carbon taxes can be used to reduce carbon emissions from tourism.
Ali et al. (Citation2021) developed the new global tourism index consist of several variables that are related by international tourism indicators and they investigated the impact of the index on GDP-per capita, renewable energy consumption, trade openness, urban population, cultural globalization on the ecological footprints per capita and net resources depletion for the different income group of the 128 countries with panel data regression model. They showed that the environmental Kuznets curve is valid for high-income; lower-middle-income and low-income countries. Also, they indicated that ecological footprint is affected by renewable energy consumption, urbanization, and cultural globalization. Fethi and Senyucel (Citation2021) investigated the relationship between tourism and carbon emissions in terms of the environmental Kuznets curve in the top 50 tourist destination countries. They showed that there is a significant relationship between tourism and carbon emissions in the long term. Ozpolat et al. (Citation2021) examined the relationship between environmental pollution and economic growth, tourism, urbanization, and energy intensity in 10 countries for the periods of 1995–2014. Their empirical results showed that the impact of tourism on environmental pollution varies according to country. In this vein, while tourism causes to increase in environmental pollution in European countries, there is no significant relationship between the variables in the United States and Australia.
3. Econometric framework
After the seminal paper of Sims (Citation1980), Vector Autoregression (henceforth VAR) model has been widely employed in macro econometrics to determine the effect of policy implications on the macroeconomic variables. The panel version of the VAR model was introduced first by Holtz-Eakin et al. (Citation1988) and it has been widely used in empirical studies.
In this study, we employ a panel VAR (henceforth PVAR) model suggested by Abrigo and Love (Citation2016) to examine the dynamic relationship between international tourism, carbon emissions, and economic growth. There are two reasons for using the PVAR model to investigate the relationship between pollution, international tourism, and growth. First, as in the traditional VAR model, all variables in the system are treated as endogenous in the PVAR model, and hence using the PVAR model allows us to investigate the dynamic relationships among the variables by using the Granger causality test and impulse responses analysis. It is more evident for our topic because the responses of the carbon emission to policy changes are time delayed. In addition, empirical studies show that there is a bidirectional relationship between tourism, economic growth, and carbon emissions and thus it is not easy to classify the variables in question as dependent or independent variables. Secondly, the data for carbon emission and international tourism can be obtained as low frequency (such as yearly) for most countries, and hence a problem arises for the time dimension of the variables in the estimation of the conventional VAR model. Therefore, using the PVAR model increases the sample size significantly, and hence it provides more efficient estimations than the traditional VAR model.
Furthermore, Topcu et al. (Citation2020) indicated that the PVAR model has several advantages in contrast to conventional panel regression analysis. First, the PVAR allows us to determine whether shock transmission among the variables. Secondly, the PVAR model can be used to estimate average effects for non-homogeneous panels and it can be also employed to investigate specific differences regarding the mean. Thirdly, since all variables can be treated as endogenous in the PVAR, the presence of interdependences of the variables can be examined without any a priori theoretical information. Finally, since the estimation of the PVAR model relies on the lags of the variables in the system, we can examine dynamic relations among the variables.
In this context, the PVAR model has been widely used in recent studies. For instance, Huang et al. (Citation2008) employed the dynamic panel data approach to examine the relationship between energy consumption and GDP. Topcu et al. (Citation2020) investigated the relationship between economic growth, natural resources, energy consumption, and gross capital formation by using the PVAR model. Koengkan and Fuinhas (Citation2020) employed the PVAR model to investigate the relationship between renewable energy consumption and economic growth. Adedoyin and Bekun (Citation2020) examined the relationship among international tourism, economic growth, carbon emissions, and energy consumption by using the PVAR model suggested by Love and Zicchino (Citation2006).
Abrigo and Love (Citation2016) indicated that homogenous panel VAR of order p with panel-specific effects for k variables can be described as follows:
(1)
(1)
where Yit is a vector of endogenous variables, Xit is a vector of exogenous covariates and ui and eit are vectors of dependent variable-specific panel fixed effects and idiosyncratic errors respectively. A and B are the parameter matrices. The properties of residuals can be described as
and
for all t > s.
Abrigo and Love (Citation2016) suggested using fixed effects in the estimation to consider cross-sectional heterogeneity. Note that EquationEq. (1)(1)
(1) cannot be estimated via OLS because the presence of lagged dependent variables on the right-hand side of the system of equations may obtain biased results when N is large. Abrigo and Love (Citation2016) suggested that GMM estimations provide consistent estimates for the PVAR model when T is fixed and N is large. The most important issue in the GMM estimations is to avoid the overidentification problem. In this manner, Abrigo and Love (Citation2016) indicated that the J test suggested by Hansen (Citation1982) can be used to determine whether there are over-identifying restrictions for the instrumental variables.
As in time-series VAR, selecting optimal lag lengths is the most important task in the PVAR model. There are three well-known model selection criteria namely Akaike information criteria (AIC), the Bayesian information criteria (BIC), and the Hannan-Quinn information criteria (HQIC) in time-series VAR. Similarly, Abrigo and Love (Citation2016) suggested a panel version of the three model selection criteria such as modified AIC (MAIC), modified BIC (MBIC), and modified HQIC (MHQIC) that depend on J statistic to determine optimal lag lengths.
4. Data and empirical results
We investigate the dynamic relationship between international tourism, economic growth, and carbon emission for the periods of 1995–2020 in the 28 OECD countries.Footnote1 We also consider energy consumption, gross fixed capital formation, and trade as the control variables in the model estimations. The name, definition, and sources of the variables are presented in .
Table 1. Variables definition.
The descriptive statistics for the variables are given in . The results in show that the mean GDP per capita is $35,366. Panel mean of international inbound tourists is 25,900 million during the sample period. While the highest international inbound tourists were obtained from the USA, Iceland has the lowest international inbound tourists over the sample countries. The panel mean of per capita carbon emission is 9.136 and we determine that the USA produces the highest carbon emission whereas Iceland has the lowest one. These findings indicate that the USA has the highest international inbound tourists and carbon emission among the countries. The panel mean of gross fixed capital to GDP and trade to GDP ratio are 22% and 83% respectively over the sample periods. Also, we determine that the mean of energy consumption is 192.104 for the sample countries.
Table 2. Descriptive statistics.
The Pearson correlation coefficients for the variables are presented in . We express all series in natural logarithms and use them in the empirical analysis. The correlation analysis results show that there is a negative and statistically significant correlation between GDP and international tourism. On the other hand, carbon emissions, energy consumption, and trade are positively correlated with GDP. Although international tourism is negatively correlated with all variables, the correlation coefficient between international tourism and energy consumption is statistically significant. We also determine a positive and significant correlation between carbon emissions, energy consumption, and trade.
Table 3. Correlations and CD test results.
We also examine the presence of cross-sectional dependence within the panel by using the CD test suggested by Pesaran (Citation2015) and present the results in . The CD test results in show that the null hypothesis of weak cross-sectional dependence can be rejected for all variables at the 1% significance level. This result indicates that there is strong cross-sectional dependence within the panel.
Abrigo and Love (Citation2016) stated that GMM estimations suffer from the weak instrument variables that have the near unit root and also when the variables are not stationary, the moment conditions are not satisfied. Therefore, it is required to examine time-series properties of the variables before estimation of the PVAR model and when the variables are not stationary in level, the first difference of the variables should be considered in the model estimations.
Hence, we start our analysis by first employing the panel unit root test. Nevertheless, the CD test results in indicate the presence of cross-sectional dependence and well-documenting literature shows that first-generation unit root tests provide biased results when there is cross-sectional dependence within the panel. Therefore, we employ the second-generation panel unit root test (CIPS) suggested by Pesaran (Citation2007) and test results are presented in .
Table 4. Panel unit root test results.
The results in show that the null hypothesis of nonstationarity cannot be rejected at a 1% significance level for all variables and these findings indicate that all variables are not stationary at level. When we consider the first difference of the variables, the null hypothesis is rejected at a 1% significance level for all variables. These results indicate that it is appropriate to use the first differences of all variables in the econometric analyses.
We estimate the PVAR model with three endogenous variables namely growth rate in international tourism, per capita GDP and carbon emissions and energy consumption, gross fixed capital, and trade are considered as exogenous variables in the PVAR estimations. The first step of the PVAR model is to determine the optimal lag lengths. We consider model information criteria and Hansen’s J test for overidentification and present the results in . According to the results in , the lowest value for Coefficient Determinations (CD) is found at first lag. While the MBIC and MHQIC suggest one lag as optimal lag length, we cannot reject the null hypothesis of overidentification at the 5% significance level according to the Hansen J test. Therefore, we consider two lags according to the MAIC as an optimal lag length in PVAR model estimation.Footnote2
Table 5. Lag length selection.
Then, we estimate the PVAR model where Helmert transformation is employed to remove panel-specific fixed effects. Note that dynamic relationships among the variables can be analyzed using the Granger causality test and impulse-responses analysis in the PVAR model. Therefore, we employ a Wald test by imposing zero restrictions for the estimated autoregressive coefficients to determine causality relationships among the variables. We present the Granger causality test results in .
Table 6. Granger causality test results.
The results in show that the null hypothesis of GDP per capita is not a Granger cause of international tourism and carbon emissions cannot be rejected at conventional significance level. Similarly, we cannot determine the Granger causality running from international tourism to GDP per capita because we fail to reject the null hypothesis. It should be noted that the Granger causality link from international tourism to carbon emissions is a borderline case because the p-value for the null hypothesis is 11%. Finally, there is no Granger causality from carbon emissions to international tourism and per capita GDP. Overall, the Granger causality test result shows that there is no causality relationship among the variables in question.
The Granger causality test results imply that there is no causal relationship between the variables and this result contradicts the empirical results in the literature. However, Lütkepohl (Citation2005) indicated that the Granger causality test provides only a limited story regarding any dynamic relationships among the variables. In this context, the impulse-response analysis is important for the policy implications because policymakers want to know the responses of one variable to unexpected shocks in another variable in a system for desired policy implications (Cevik et al., Citation2021). Therefore, the impulse-responses analysis provides a picture to better understand the magnitude and the persistence of the responses of carbon emission to an unexpected shock in international tourism (and vice versa). Therefore, we also conduct the impulse-responses analysis for the relationship between international tourism, carbon emission, and GDP per capita.
The impulse-responses analysis results are given in .Footnote3 The first row in shows the responses of international tourism and GDP per capita to an unexpected carbon emission shock. The middle row in shows the responses of carbon emission and international tourism to an unexpected GDP per capita shock and the last row in shows the responses of GDP per capita and carbon emissions to an unexpected international tourism shock.
Figure 2. Impulse-responses analysis results. Note: The results show cumulative responses. Shaded areas are 95% confidence interval. Monte Carlo simulation with 1000 draws is used to obtain a confidence interval.
Source: Authors.
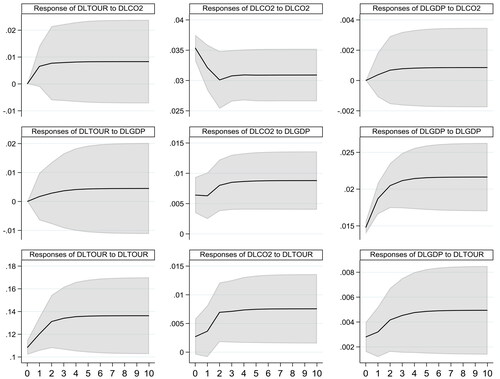
The responses of international tourism to an unexpected carbon emission shock are positive but not statistically significant. This result confirms the Granger causality test result because we cannot find any causal link running from carbon emission to international tourism. This finding suggests that there is no significant link between carbon emissions and international tourism. Similarly, the responses of GDP per capita to an unexpected carbon emission shock are positive and not statistically significant. The Granger causality test results and impulse-responses analysis results suggest that carbon emissions are weak endogenous variables and it is generally affected by the other macroeconomic variables.
The responses of international tourism to a GDP per capita shock are positive but they are not statistically significant. This finding is consistent with Granger causality test results because we cannot find a causal link running from GDP per capita to international tourism. On the other hand, the responses of carbon emissions to an unexpected GDP per capita shock are positive and statistically significant and this finding is consistent with empirical results documented in Wang et al. (Citation2016), Ahmad et al. (Citation2017), and Acheampong (2018).
Even though the initial responses of carbon emissions to an unexpected international tourism shock are not statistically significant, these responses are determined to be statistically significant after the second lag. In this context, carbon emissions react positively and statistically significant to an international tourism shock after a second lag and this finding suggests that an increase in international tourism causes environmental deterioration in the sample countries and it is consistent with theoretical expectations. The responses of GDP per capita to an unexpected international tourism shock are positive and statistically significant and this result indicates that GDP per capita is positively affected by international tourism. This finding is consistent with theoretical expectations because large numbers of studies in the literature show that international tourism provides a positive contribution to the economic growth in host countries.
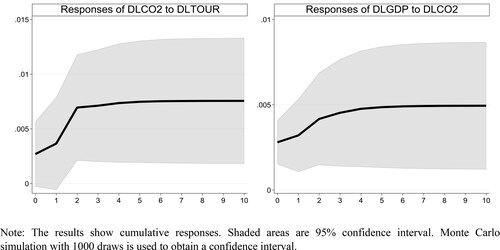
Since the aim of the study is to examine the impact of international tourism on environmental quality and economic growth, we present the responses of carbon emissions and GDP per capita to an unexpected international tourism shock separately in . The results in clearly show that the responses of carbon emissions and economic growth to an increase in international tourism are positive and this effect is persistent over the 10 years. In other words, while international tourism provides a positive contribution to economic growth, it harms environmental quality by increasing carbon emissions. Secondly, the responses of carbon emissions to an unexpected international tourism shock are higher than the responses of economic growth to an unexpected international tourism shock. According to these findings, it can be said that the negative impact of international tourism on environmental quality is greater than its positive impact on economic growth. Thirdly, the relationship between international tourism and carbon emissions is not simultaneous because the initial response of carbon emissions to an unexpected shock in international tourism is not statistically significant. This finding is consistent with theoretical expectations because studies in the literature show that the negative impact of international tourism on carbon emissions is mediated by energy consumption. In this context, Dogan and Aslan (Citation2017) emphasized that all tourism activities such as transportation and accommodation are depending on energy consumption and hence energy consumption plays an important role in the relationship between tourism and carbon emissions. Therefore, policymakers or regulators should take several actions to reduce the impact of international tourism on environmental deterioration. For instance, improvements and dissemination of eco-friendly technologies that are related to all tourism activities may help to reduce the negative impact of international tourism on carbon emissions. Besides, during the post-Covid-19 period, the governments should be more proactive to regenerate touristic activities and preserve the environment (Gedikli & Yalçın, Citation2022).
Figure 3. The responses of carbon emissions and GDP to a tourism shock.
Source: Authors.
5. Conclusions
The tourism industry provides a significant contribution to not only cultural interaction but also economic activity through the service industry that supports economic growth and employment. In addition, international tourism causes foreign exchange inflows to the hosting countries and hence it helps to reduce current account deficits. Although there is a positive impact of tourism on economic activity, tourism activities lead to increasing energy consumption and electricity usage and thus it negatively affects environmental quality by increasing carbon emissions. It is well known that carbon emissions and carbon footprint are the main indicators of global warming and climate change. Global tourism significantly increases carbon footprint due to subsectors related to tourism such as transportation, goods, food and beverage, agriculture, services, lodging and construction, and mining.
In this study, we employ a panel VAR model suggested by Abrigo and Love (Citation2016) to examine the dynamic relationship between international tourism, carbon emissions, and economic growth in selected OECD countries over the periods of 1995–2020. Two reasons are using the PVAR model to investigate the relationship between pollution, international tourism, and growth. First, as in the traditional VAR model, all variables in the system are treated as endogenous in the PVAR model, and hence using the PVAR model allows us to investigate the dynamic relationships among the variables by using the Granger causality test and impulse responses analysis. It is more evident for our topic because the responses of the carbon emissions to policy changes are time delayed. In addition, empirical studies show that there is a bidirectional relationship among tourism, economic growth, and carbon emissions. Therefore, it is not easy to classify the variables in question as dependent or independent variables. Secondly, the data for carbon emissions and international tourism can be obtained as low frequency (such as yearly) for most countries, and hence the problem arises for the time dimension of the variables in the estimation of the conventional VAR model. Therefore, using the PVAR model increases the sample size significantly, and it provides more efficient estimations than the traditional VAR model.
The Granger causality test result depends on the PVAR model shows that there is no causal relationship between international tourism, carbon emissions, and economic growth. On the other hand, impulse responses analysis provides a different picture because carbon emissions and economic growth react positively to an unexpected shock in international tourism. This finding suggests that while international tourism provides a positive contribution to economic growth, it harms environmental quality by increasing carbon emissions. Also, the responses of carbon emissions to an unexpected international tourism shock are higher than the responses of economic growth to an unexpected international tourism shock. According to these findings, it can be said that the negative impact of international tourism on environmental quality is greater than its positive impact on economic growth. Furthermore, the relationship between international tourism and carbon emissions is not simultaneous because the initial response of carbon emissions to an unexpected shock in international tourism is not statistically significant. This finding is consistent with theoretical expectations because studies in the literature show that the negative impact of international tourism on carbon emissions is mediated by energy consumption. Although international tourism plays an important role in economic growth, policymakers or regulators should take several actions to reduce the impact of international tourism on environmental deterioration. Innovative policies and the dissemination of eco-friendly technologies related to all tourism activities may help to reduce the negative impact of international tourism on carbon emissions.
The empirical studies in the literature show that the indirect effect of tourism on carbon emissions is more significant than its direct effect. At this point, transportation comes to the fore and environmental quality is negatively affected by several transportation activities such as plane flights, boat rides, and bus tours. In this context, an increase in the innovation process for eco-friendly transportation may help to reduce the negative impact of international tourism on environmental quality.
Note that the relationship between tourism and carbon emissions can be examined in different ways in further researches. First, a quantile regression model can be used to examine the relationship between carbon emissions and tourism at different stages of carbon levels such as low, medium, and high. Second, the threshold VAR model can be employed to examine the nonlinear relationship between the variables.
Acknowledgment
This research was partially funded by the program of the Minister of Science and Higher Education titled ‘Regional Initiative of Excellence’ in 2019–2022, project number 018/RID/2018/19, the amount of funding PLN 10 788 423,16. We also thank to the Portuguese national funds through FCT—Fundação para a Ciência e a Tecnologia, I.P., project number UIDB/00685/2020.
Notes
1 The countries are selected according to data availability. The selected countries are Australia, Austria, Belgium, Canada, Colombia, Finland, Germany, Hungary, Iceland, Israel, Italy, Japan, Korea, Rep., Latvia, Luxembourg, Mexico, Netherlands, New Zealand, Norway, Poland, Portugal, Slovenia, Spain, Sweden, Switzerland, Turkey, United Kingdom, the United States.
2 We examine the stability of the PVAR model with two lags and find that the PVAR model satisfies the stability condition.
3 The impulse-responses analysis depends on the Cholesky decomposition and hence the order of variables is important. We order the variables as international tourism → GDP → carbon emissions.
References
- Abrigo, M. R. M., & Love, I. (2016). Estimation of panel vector autoregression in Stata. The Stata Journal: Promoting Communications on Statistics and Stata, 16(3), 778–804. https://doi.org/10.1177/1536867X1601600314
- Acheampong, A. O. (2018). Economic growth, CO2 emissions and energy consumption: What causes what and where? Energy Economics, 74, 677–692.
- Adedoyin, F. F., & Bekun, F. V. (2020). Modelling the interaction between tourism, energy consumption, pollutant emissions and urbanization: Renewed evidence from panel VAR. Environmental Science and Pollution Research International, 27(31), 38881–38900. https://doi.org/10.1007/s11356-020-09869-9
- Ahmad, N., Du, L., Lu, J., Wang, J., Li, H.-Z., & Hashmi, M. Z. (2017). Modelling the CO2 emissions and economic growth in Croatia: Is there any environmental Kuznets curve? Energy, 123, 164–172. https://doi.org/10.1016/j.energy.2016.12.106
- Akadiri, S. S., Alola, A. A., & Uzuner, G. (2020). Economic policy uncertainty and tourism: Evidence from the heterogeneous panel. Current Issues in Tourism, 23(20), 2507–2514. https://doi.org/10.1080/13683500.2019.1687662
- Akadiri, S. S., Lasisi, T. T., Uzuner, G., & Akadiri, A. C. (2020). Examining the causal impacts of tourism, globalization, economic growth and carbon emissions in tourism island territories: Bootstrap panel Granger causality analysis. Current Issues in Tourism, 23(4), 470–484. https://doi.org/10.1080/13683500.2018.1539067
- Ali, Q., Yaseen, M. R., Anwar, S., Makhdum, M. S. A., & Khan, M. T. I. (2021). The impact of tourism, renewable energy, and economic growth on ecological footprint and natural resources: A panel data analysis. Resources Policy, 74, 102365. https://doi.org/10.1016/j.resourpol.2021.102365
- Azam, M., Alam, M. M., & Hafeez, M. H. (2018). Effect of tourism on environmental pollution: Further evidence from Malaysia, Singapore and Thailand. Journal of Cleaner Production, 190, 330–338. https://doi.org/10.1016/j.jclepro.2018.04.168
- Ballı, E. (2021). The Nexus between tourism, environmental degradation and economic growth. Ege Akademik Bakis (Ege Academic Review), 21(2), 149–161. https://doi.org/10.21121/eab.907436
- Brida, J. G., & Risso, W. A. (2009). Tourism as a factor of long-run economic growth: An empirical analysis for Chile. European Journal of Tourism Research, 2(2), 178.
- Cao, F., Zhang, Y., & Zhang, J. (2021). Carbon tax, economic uncertainty and tourism: A DSGE approach. Journal of Hospitality and Tourism Management, 49, 494–507. https://doi.org/10.1016/j.jhtm.2021.11.001
- Cevik, E. I., Yıldırım, D. Ç., & Dibooglu, S. (2021). Renewable and non-renewable energy consumption and economic growth in the US: A Markov-switching VAR analysis. Energy & Environment, 32(3), 519–541. https://doi.org/10.1177/0958305X20944035
- Dogan, E., & Aslan, A. (2017). Exploring the relationship among CO2 emissions, real GDP, energy consumption and tourism in the EU and candidate countries: Evidence from panel models robust to heterogeneity and cross-sectional dependence. Renewable and Sustainable Energy Reviews, 77, 239–245. https://doi.org/10.1016/j.rser.2017.03.111
- Dumitrescu, E. I., & Hurlin, C. (2012). Testing for Granger non-causality in heterogeneous panels. Economic Modelling, 29(4), 1450–1460. https://doi.org/10.1016/j.econmod.2012.02.014
- Fethi, S., & Senyucel, E. (2021). The role of tourism development on CO2 emission reduction in an extended version of the environmental Kuznets curve: Evidence from top 50 tourist destination countries. Environment, Development and Sustainability, 23(2), 1499–1524. https://doi.org/10.1007/s10668-020-00633-0
- Gedikli, A., & Yalçın, A. K. (2022). The role of the government in the environmental sustainability during the Covid-19 pandemic. In R. A. Castanho (Ed.), Handbook of research on sustainable development goals, climate change, and digitalization (pp. 308–325). IGI Global Publication.
- Grythe, H., & Lopez-Aparicio, S. (2021). The who, why and where of Norway’s CO2 emissions from tourist travel. Environmental Advances, 5, 100104. https://doi.org/10.1016/j.envadv.2021.100104
- Hansen, L. (1982). Large sample properties of generalized method of moments estimators. Econometrica, 50(4), 1029–1054. https://doi.org/10.2307/1912775
- Haven‐Tang, C., & Jones, E. (2008). Labour market and skills needs of the tourism and related sectors in Wales. International Journal of Tourism Research, 10(4), 353–363. https://doi.org/10.1002/jtr.666
- Holtz-Eakin, D., Newey, W., & Rosen, H. S. (1988). Estimating Vector autoregressions with panel data. Econometrica, 56(6), 1371. https://doi.org/10.2307/1913103
- Huang, B.-N., Hwang, M.-J., & Yang, C. W. (2008). Causal relationship between energy consumption and GDP growth revisited: A dynamic panel data approach. Ecological Economics, 67(1), 41–54. https://doi.org/10.1016/j.ecolecon.2007.11.006
- Khan, A., Chenggang, Y., Hussain, J., Bano, S., & Nawaz, A. (2020). Natural resources, tourism development, and energy-growth-CO2 emission nexus: A simultaneity modeling analysis of BRI countries. Resources Policy, 68, 101751. https://doi.org/10.1016/j.resourpol.2020.101751
- Khoshnevis Yazdi, S., Nateghian, N., & Sheikh Rezaie, N. (2017). The causality relationships between tourism development and foreign direct investment: An empirical study in EU countries. Journal of Policy Research in Tourism, Leisure and Events, 9(3), 247–263. https://doi.org/10.1080/19407963.2017.1297310
- Koçak, E., Ulucak, R., & Ulucak, Z. Ş. (2020). The impact of tourism developments on CO2 emissions: An advanced panel data estimation. Tourism Management Perspectives, 33, 100611. https://doi.org/10.1016/j.tmp.2019.100611
- Koengkan, M., & Fuinhas, J. A. (2020). The interactions between renewable energy consumption and economic growth in the Mercosur countries. International Journal of Sustainable Energy, 39(6), 594–614. https://doi.org/10.1080/14786451.2020.1732978
- Lee, C. C., & Chang, C. P. (2008). Tourism development and economic growth: A closer look at panels. Tourism Management, 29(1), 180–192. https://doi.org/10.1016/j.tourman.2007.02.013
- Leitão, N. C., & Lorente, D. B. (2020). The linkage between economic growth, renewable energy, tourism, CO2 emissions, and international trade: The evidence for the European Union. Energies, 13(18), 4838. https://doi.org/10.3390/en13184838
- Lenzen, M., Sun, Y. Y., Faturay, F., Ting, Y. P., Geschke, A., & Malik, A. (2018). The carbon footprint of global tourism. Nature Climate Change, 8(6), 522–528. https://doi.org/10.1038/s41558-018-0141-x
- Love, I., & Zicchino, L. (2006). Financial development and dynamic investment behavior: Evidence from panel VAR. The Quarterly Review of Economics and Finance, 46(2), 190–210. https://doi.org/10.1016/j.qref.2005.11.007
- Lütkepohl, H. (2005). New introduction to multiple time series analysis. Springer-Verlag.
- Neger, C., Prettenthaler, F., Gössling, S., & Damm, A. (2021). Reprint of: Carbon intensity of tourism in Austria: Estimates and policy implications. Journal of Outdoor Recreation and Tourism, 34, 100434. https://doi.org/10.1016/j.jort.2021.100434
- OECD. (2020). Tourism trends and policies 2020-policy highlight.
- OECD. (2021). Tourism. https://www.oecd.org/greengrowth/consumption-innovation/tourism.htm.
- Ozpolat, A., Ozsoy, F. N., & Destek, M. A. (2021). Investigating the tourism originating CO2 emissions in top 10 tourism-induced countries: Evidence from tourism index. In Strategies in sustainable tourism, economic growth and clean energy (pp. 155–175). Springer.
- Paramati, S. R., Alam, M. S., & Chen, C. F. (2017). The effects of tourism on economic growth and CO2 emissions: A comparison between developed and developing economies. Journal of Travel Research, 56(6), 712–724. https://doi.org/10.1177/0047287516667848
- Pesaran, M. H. (2007). A simple panel unit root test in the presence of cross-section dependence. Journal of Applied Econometrics, 22(2), 265–312. https://doi.org/10.1002/jae.951
- Pesaran, M. H. (2015). Testing weak cross-sectional dependence in large panels. Econometric Reviews, 34(6–10), 1089–1117. https://doi.org/10.1080/07474938.2014.956623
- Robaina-Alves, M., Moutinho, V., & Costa, R. (2016). Change in energy-related CO2 (carbon dioxide) emissions in Portuguese tourism: A decomposition analysis from 2000 to 2008. Journal of Cleaner Production, 111, 520–528. https://doi.org/10.1016/j.jclepro.2015.03.023
- Samimi, A. J., Sadeghi, S., & Sadeghi, S. (2011). Tourism and economic growth in developing countries: P-VAR approach. Middle-East Journal of Scientific Research, 10(1), 28–32.
- Seghir, G. M., Mostéfa, B., Abbes, S. M., & Zakarya, G. Y. (2015). Tourism spending-economic growth causality in 49 countries: A dynamic panel data approach. Procedia Economics and Finance, 23, 1613–1623. https://doi.org/10.1016/S2212-5671(15)00402-5
- Shan, J., & Wilson, K. (2001). Causality between trade and tourism: Empirical evidence from China. Applied Economics Letters, 8(4), 279–283. https://doi.org/10.1080/135048501750104114
- Shi, H., Li, X., Zhang, H., Liu, X., Li, T., & Zhong, Z. (2020). Global difference in the relationships between tourism, economic growth, CO2 emissions, and primary energy consumption. Current Issues in Tourism, 23(9), 1122–1137. https://doi.org/10.1080/13683500.2019.1588864
- Sims, C. (1980). Macroeconomics and reality. Econometrica, 48(1), 1–48. https://doi.org/10.2307/1912017
- STI. (2021). Carbon footprint of tourism, sustainable travel international. https://sustainabletravel.org/issues/carbon-footprint-tourism/
- Tang, C. F., & Tan, E. C. (2013). How stable is the tourism-led growth hypothesis in Malaysia? Evidence from disaggregated tourism markets. Tourism Management, 37, 52–57. https://doi.org/10.1016/j.tourman.2012.12.014
- Topcu, E., Altinoz, B., & Aslan, A. (2020). Global evidence from the link between economic growth, natural resources, energy consumption, and gross capital formation. Resources Policy, 66, 101622. https://doi.org/10.1016/j.resourpol.2020.101622
- UNWTO & ITF. (2019). Transport-related CO2 emissions of the tourism sector–modelling results. UNWTO.
- Wang, S., Li, Q., Fang, C., & Zhou, C. (2016). The relationship between economic growth, energy consumption, and CO2 emissions: Empirical evidence from China. Science of the Total Environment, 542, 360–371. https://doi.org/10.1016/j.scitotenv.2015.10.027
- Worldbank. (2021). World development indicators. https://databank.worldbank.org/source/world-development-indicators
- Zha, J., Shao, Y., & Li, Z. (2019). Linkage analysis of tourism‐related sectors in China: An assessment based on network analysis technique. International Journal of Tourism Research, 21(4), 531–543. https://doi.org/10.1002/jtr.2280
- Zhang, J., & Zhang, Y. (2018). Carbon tax, tourism CO2 emissions and economic welfare. Annals of Tourism Research, 69, 18–30. https://doi.org/10.1016/j.annals.2017.12.009