
 ?Mathematical formulae have been encoded as MathML and are displayed in this HTML version using MathJax in order to improve their display. Uncheck the box to turn MathJax off. This feature requires Javascript. Click on a formula to zoom.
Abstract
In the past couple of years, most of the countries observed an increase in the size of their ecological footprints. Therefore, researchers and policymakers are now more focused on the potential drivers through which the ecological deficiency can be reduced. In the same context, this study evaluates international tourism, globalization, and technology innovation effects on the ecological footprints of G-10 countries over the period of 1995–2019. This study initially applied second-generation cross-sectional dependency, unit root, and cointegration tests. The long-run and short-run estimates were obtained through the Cross-Sectional ARDL method. The study’s empirical findings demonstrate that tourism, globalization, and economic growth significantly contributed to ecological footprint, while technology innovation reduced the environmental burden, thus leads to a decline in ecological footprints of sample countries. These results suggest the use of alternate energy resources and advanced technology in the tourism industry.
1. Introduction
With the carbon neutrality targets, the sustainable development of the environment has become the prime concern of all countries over the last couple of years (Caglar et al., Citation2021; Tao et al., Citation2021). The diversified social, economic, and environmental human activities have induced a tradeoff between economic performance and environmental sustainability (Liu et al., Citation2022; Nathaniel et al., Citation2021b). Various studies have used ecological footprint (EF) as a reliable measure of environmental quality (Anser et al., Citation2021; Godil et al., Citation2020; Shokoohi et al., Citation2022). The EF is the comprehensive matric to compare the resources consumption and waste production by humans with nature’s resource regeneration and waste absorption capacity (Nathaniel et al., Citation2021a; Ozturk et al., Citation2016; Usman & Makhdum, Citation2021). The boom in industrialization, tourism, financial and economic growth, and globalization has significantly reduced the ecological reserve and increased the ecological footprint globally (An et al., Citation2021; Sarkodie, Citation2021; Udemba & Keleş, Citation2021).
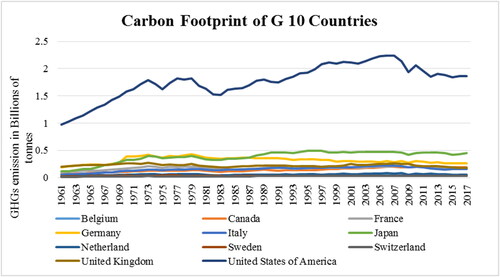
The major and rapidly growing component of the ecological footprint is the carbon footprint used to measure the fossil fuel-related greenhouse gas emissions or a ‘carbon weight of kilograms or tonnes per person or activity tonnes per year’ (Wiedmann & Minx, Citation2008). The increase in carbon concentration in the environment refers as the ecological debt. Currently, the carbon footprint composes more than 60% of the overall EF of the world (Global Footprint Network, Citation2019). demonstrates the carbon footprint of G-10 countries from 1961 to 2017. It has clearly been observed that the USA has the highest carbon footprint throughout all these years among all groups of ten countries. At the same time, other countries are individually responsible for emitting greenhouse less than 0.5 billion tonnes of GHGs in a year.
Figure 1. Carbon footprint of G-10 countries. Source: Global Footprint Network Citation2017, https://data.footprintnetwork.org/.
The group of Ten (G-10) is the group of eleven industrial countries with similar economic interests. The primary objective of the G10 group is to coordinate fiscal and monetary policies to foster economic stability worldwide. The members of the group are Belgium, Sweden, France, Germany, Japan, Italy, Canada, Netherlands, Switzerland, UK and USA (IMF, Citation2021).
Currently, the growing carbon footprint is the prime concern of scholars, who link different economic and environmental determinants with EF to provide better solutions. Similarly, the study’s objective is to evaluate the impact of the tourism industry, globalization, and technology innovation on ecological footprints in G-10 Countries. For this purpose, the study incorporates the annual series of variables for G-10 countries from 1995 to 2017.
The tourism industry (TOR) significantly contributes to economic advancement (Adedoyin et al., Citation2021; Song et al., Citation2021). Tourism accelerates the earnings of the transportation sector (Tahir & Rafiq, Citation2021), improves the development of infrastructure, promotes trade activities (Tang, Citation2021), and abates unemployment (Ozturk & Acaravci, Citation2009; Sharma & Mitra, Citation2021). Although tourism has a great influence on economic stability, at the same time, its deteriorating impact on the environment is also very high. TOR is directly linked with the high fossil fuel energy consumption through transportation which causes more than 75% of the total carbon emission related to tourism activities (Zhang & Liu, Citation2019), moreover tourism requires the proper development of the infrastructure, the excessive exploration to the natural resources grow the carbon footprint and deplete the biocapacity (Nathaniel et al., Citation2021b; Razzaq et al., Citation2021a).
Globalization (GLB) is another key driver that can significantly affect the environment. It refers to an increasing link between the countries through the social, economic, and political aspects (Rehman et al., Citation2021), for instance, globalization increases trade activities, financial integration, sharing of information, technological transfer, economic growth, and total factor productivity to establish unified and mutually dependent global economy (Godil et al., Citation2021). Globalization has also supported tourism with enormous ramifications and encouraged it to become a major economic force (Razzaq et al., Citation2021b).
However, globalization leads to the high consumption of nonrenewable energy resources (Pata, Citation2021) and provides the platform for progressing to pollution-intensive industries. With global advancement, it is difficult the control environmental degradation without developing strong policies related to environmental sustainability (Kirikkaleli et al., Citation2021). However, with the environmental policy intervention and increased dissemination of new eco-friendly technology and business practices, globalization can reduce the carbon footprint (Sabir & Gorus, Citation2019; Saud et al., Citation2020).
As discussed earlier, globalization (GLB) leads toward the technology transformation of the industrial and business practices to improve ecological quality. For this purpose, this study also considers the technology innovation impact on the carbon footprint. Advanced economies seek new methods to reduce the dependency on fossil fuels in production and transportation (Bekun et al., Citation2019). The TOR provides accessibility to alternative or renewable energy resources, reduces production time, and provides better solutions to mitigate carbon emissions (Chen et al., Citation2021; Cheng et al., Citation2021; Destek & Manga, Citation2021).TOR is a critical factor in mitigating carbon emissions in developing countries (Shuai et al., Citation2017; Sinha et al., Citation2020; Wang et al., Citation2021). However, in developing countries, the TOR increases its ecological footprint due to the adaptation of imported technologies that are less eco-friendly (Chunling et al., Citation2021; Mushta et al., Citation2020).
There are several reasons to select the group of Ten (G-10) countries for the analysis, such as these countries have a common interest in economic growth. Moreover, the member’s countries of the group are accounted to hold the major share of around 48% of the aggregate GDP of the world with the highest contribution of 24.08% of the USA (Worldometer, Citation2017). Furthermore, these countries have established better economic growth policies to support sustainable development due to economic, financial, and monetary interests. According to the Global Footprint Network (Citation2020), among 11 countries of G-10, only two countries, such as Canada and Sweden, have ecological reserves (biocapacity exceed footprint). In contrast, the remaining nine countries are ecologically deficient (footprint exceed biocapacity) countries. Therefore this group needs to pay more attention to reducing its ecological footprint.
As per our knowledge, not a single study has been carried out to analyze the integrated impact of TOR, GLB, INV on EF specifically for G-10 countries. The study covers the gap by using the CS-ARDL method to analyze the association among tourism, globalization, technology innovation and ecological footprint for the penal of G-10 countries. This method was first introduced by Chudik and Pesaran (Citation2015) give some advantage over the other panel data estimators such as this method can tackle the issue of C-SD (cross-section dependency) in panel data analysis and provide robust results. Moreover, this method can be applied to the same or mixed order integrated series. Furthermore, due to the heterogeneous nature of the sample group of G-10 countries, this method is the most appropriate estimator to investigate the long-run and short-run associations. The outcomes of the study revealed that tourism and globalization are spurring the ecological footprint in G-10 countries, whereas technology innovation helps to reduce environmental degradation. These results will provide a better understanding to the policymakers of G-10 countries to control the ecological deficits.
The remaining part of the study covers the following sections: Sec. 2 provides the detailed literature review, whereas Sec. 3 describes the methodology with data description and methodological framework employed in the study. Section 4 consists of the estimations and their discussions while Sec. 5 presents the study’s conclusion and suggests some policy implications.
2. Literature review
Environmental sustainability becomes a key challenge that gets the researchers’ growing concern and broadens the field of empirical research. The EF as a proxy of environmental quality has gained special attention. Numerous recent studies have addressed the factors which contribute to increasing/decreasing the size of ecological footprints, such as natural resources, economic growth, globalization, agriculture, tourism, human capital, and renewable energy resources (Ahmad et al., Citation2020; Ansari et al., Citation2021; Cheng et al., Citation2021; Chunling et al., Citation2021; Katircioglu, Citation2021; Nathaniel et al., Citation2021a, Citation2021b; Rehman et al., Citation2021; Yang et al., Citation2021a, Citation2021b; X. Yang et al., Citation2021). The brief literature related to the study variables is as follows.
2.1. Tourism industry and ecological footprint
Tourism, as one of the fast-growing industries of the world, is an energy-intensive industry (Luo et al., Citation2020). Moreover, tourism is also held responsible for emitting extensive carbon emissions through various tourism-related activities (Xuefeng et al., Citation2021; Zhang & Liu, Citation2019).
A considerable amount of existing research has analyzed the effects of tourism on environmental sustainability by using ecological footprint with different empirical methods, and research approaches such as Godil et al. (Citation2020) studied the link between TOR, FDI and EF. The study used the data series of Turkey from 1986 to 2018. The empirical finding demonstrates that the FDI, GLB, and TOR have a constructive influence on the EF. Similarly, Kongbuanai et al. (2020) study the impact of TOR and nonrenewable energy resources in the ASEAN countries over the period of 1995 to 2016. The findings of the Driscoll-Kraay panel regression method endorsed the positive relationship of tourism and nonrenewable energy resources with the EF (Sharif et al., Citation2020; Sun et al., Citation2022).
In the same vein, Ansari and Villanthenkodath (Citation2021) access the effect of tourism arrival and tourism receipt on the top tourism countries. The estimates of the NARDL approach have affirmed that the tourism arrivals increase the size of ecological footprint, whereas the tourism receipt plays an important role in reducing the EF. In addition, the analysis of tourism with respect to EF for top 10 destinations courtiers carried out by Alola et al. (Citation2021) shows that during the period from 1995 to 2016, the development of the tourism industry has significantly enhanced the environmental degradation. Lee and Chen (Citation2021) also endorse the positive correlation of TOR with environmental degradation. They applied the quantile regression approach to the panel data of 123 economies.
Moreover, Nathaniel et al. (Citation2021a) studied the contribution of tourism toward ecological distortion by employing the CUP-FM and CUP-BC estimates for the panel data of the top ten tourist countries. The results of the study revealed that tourism growth (as tourist arrival and tourist receipt) positively affects the EF. Conversely, Katircioglu et al. (Citation2018) explored the negative and significant relationship of TOR development with EF in top tourist countries. The increase of tourism activities improves the environmental quality. Similarly, Khan and Hou (Citation2021) suggest the adverse impact of TOR on the EF for 38 IEA countries based on estimates obtained through the FMOLS approach for the time span from 1995 to 2018.
2.2. Globalization and ecological footprint
Globalization plays an important role in environmental sustainability. In recent years, number of several researchers have investigated the impact of GLB on the EF to confirm whether globalization upsurge the size of EF or reduces the size of EF. For instance, Kirikkalieli et al. (2021) observe the effects of GLB on environmental degradation in Turkey for the period from 1970 to 2017 by applying the dual adjustment approach and found that globalization enhances the EF. Similarly, Adebayo and Acheampong (Citation2021) use the quantile to quantile regression approach to explore the detrimental effects of globalization in Australia from 1970 to 2018. The study result revealed that the increase in globalization in Australia upsurges environmental degradation. Moreover, Rehman et al. (Citation2021) examine the link of globalization with EF in Pakistan for the span of 1974–2017. The study has applied the linear ARDL method. The findings have confirmed that GLB enhances environmental deprivation in Pakistan.
Moreover, Sharif et al. (Citation2019) found mixed results of the influence of GLB on EF. The empirical study for OEDC and non-OEDC countries shows the positive nexus between GLB and EF for Belgium, Sweden, Norway, the Netherlands, Denmark, Switzerland, Portugal, and Canada. The increased level of GLB enhances trading and manufacturing and leads to an increase in EF. Whereas in the case of France, Germany, the UK, and Hungary and the study report the negative relationship of GLB and EF. Similarly, Ahmed et al. (Citation2021a) has also highlighted the mixed relationship of globalization with EF. Their study for the United States explores the impact of different dimensions of GLB, such as economic globalization contributes toward environmental degradation whereas social globalization reduces the EF.
On the other hand, the studies carried out by Zaidi et al. (Citation2019) for ASEAN countries, and Saud et al. (Citation2020) for one-belt-one-road countries endorsed the negative impact of GLB on EF. The result shows that GLB alters economic advancement and mitigates environmental deterioration. Correspondingly, Apaydin et al. (Citation2021) study the environmental convergence phenomena for 130 countries to find the association among GLB and EF from 1980 to 2016. The results of CCEMG and AMG methods discovered that there is no significant impact of globalization on the EF. Similarly, a recent study by Ahmed et al. (Citation2021b) employed the symmetric, and asymmetric methods of ARDL applied on the data from 1997 to 2016 to explore the link between economic GLB and EF in Japan. The outcomes of the study suggest that both the positive and negative changes in economic GLB reduce the size of EF.
2.3. Technology innovation and ecological footprint
The role of TOR for environmental sustainability has been widely discussed in recent literature, and most of the studies found a negative association between INV and ecological footprint. (Ahmad et al., Citation2020; Cheng et al., Citation2021; Chunling et al., Citation2021; Ke et al., Citation2021; Khan et al., Citation2020; Kihomobo et al.2021; Rehman et al., Citation2021; Ulucak, Citation2020; Zhuang et al., Citation2021) .Ahmad et al. (Citation2020) investigate the impact of technology innovation on the EF through the CS-ARDL method for the time span from 1984 to 2016 and found that TOR has a contrary effect on EF and elevates the emission of greenhouse gases in emerging economies. Similarly, Kihombo et al. (Citation2021a) has employed the STIRPAT framework and analyzed the role of technology innovation to reduce carbon emission in West Asia and Middle East countries from 1990 to 2017. The results of the study endorse the positive association of technology innovation with the improvement of environmental quality. In addition, Yang et al. (Citation2021a) also explore technology innovation’s role in controlling environmental degradation. The study employed the advanced estimator of the second generation to evaluate the data of BICS (Brazil, India, China, and South Africa) countries for the period from 1990 to 2016. The finding of the study affirms the contribution of technology innovation to reducing the size of EF in BICS countries. Contrarily, Chunling et al. (Citation2021) explore the opposite relationship for TOR and EP in Pakistan. The surprising outcome of the study disclosed that in developing countries, the TOR increase ecological footprint because the adaptation of imported technologies that are less eco-friendly.
3. Methodology
3.1. Description and source of data
The aim of this study is to evaluate the impact of the tourism industry, globalization, and technology innovation on the ecological footprint in G-10 countries. The Group of (G-10) is eleven industrial countries with common economic interests consisting of Belgium, Canada, France, Germany, Italy, Netherland, Switzerland, the United Kingdom, and the United States of America. The logarithmic transformed annualized panel data was used from 1995 to 2019 in the study, which comprise of ecological footprint (EF) employed as a proxy of environmental degradation, international tourist arrival (TOR) as the tourism industry, technology innovation (INV) as the number of registered patents, KOF Globalization Index (GLB) as globalization, and gross domestic product as economic growth (GDP) of G-10 countries. KOF Index measured globalization in terms of foreign direct investment (FDI), flow of trade (actual) income outflow to foreign nationals, including taxes and other tariff rates. The summary of the variable is presented in .
Table 1. Variable’s description.
3.2. Methodological framework
The panel data can be subject to persuasive cross-sectional dependency (C-SD). Therefore, it is crucial to address the effect of some common unobserved factors or spillover effects influencing all the series, which may lead to spurious results if ignored before carrying out further estimates (Pesaran, Citation2004). Moreover, the identification of C-SD between series helps to select the appropriate unit root test (Tao et al., Citation2021). This study uses the Pesaran (Citation2015) test to assess the presence of C-SD issue.
Moreover, to identify the stationarity of the panel, the study employed the widely used second-generation CIPS panel unit root test introduced by Pesaran (Citation2007). This test is based on the average of the observed individual CADF and establishes the null hypothesis testing by considering the C-SD and residual serial correlation (Khan & Hou, Citation2021; Nathaniel et al., Citation2020).
The following step is to apply the cointegration test to assess the correlation among nonstationary time series in long run. The Westerlund (Citation2007) test is an error correlation model (ECM) based cointegration test comprised of four cointegration tests Gt, Ga, Pa, and Pt. Among these four cointegration tests, the Gt and Ga test assume that cointegration is present at least in one panel data unit. In comparison, the other two tests, such as Pa and Pt, support the presence of cointegration in the entire panel. Moreover, the Westerlund (Citation2007) cointegration test also considers the potentially prevailed C-SD issue in the data (Kihombo et al., Citation2021b).
To evaluate the impact of tourism (TOR), globalization (GLB), technology innovation (INV), economic growth (GDP) on the ecological footprint (EF), the proposed general specific model is as under:
(1)
(1)
The group of ten (G-10) countries is represented as i and the study span from 1995 to 2019 is demonstrated as t in the given EquationEq. (1)(1)
(1) . Further, the regression model has transformed from EquationEq. (1)
(1)
(1) is as under:
(2)
(2)
In the above EquationEq. (2)(2)
(2) , the intercept, regression parameters, cross-section term, and error term represented as µ, α, γ, and ε, respectively.
The study employed the CS-ARDL (cross-sectionally augmented autoregressive distributed lag) method of estimation presented by Chudik and Pesaran (Citation2015). It is the most appropriate methodology to access the long-run association of variables in the presence of C-SD and slope heterogeneity. The CS-ARDL estimator extends the ARDL approach by considering the time dynamics and error terms’ cross-sectional correlation. The initial ARDL model for the study is illustrated as under:
(3)
(3)
where
= (
+
+
)
The ARDL model extended into CS-ARDL model by taking the cross-section average to limit the effect of CS-D
(4)
(4)
In EquationEq. (4)(4)
(4)
is used as the dependent variable such as ecological footprint, while the lag value of EF is illustrated as
In the same equation, the independent variables such as tourism (TOR), globalization (GLB), technology innovation (INV), economic growth (GDP) for G-10 countries refer as
Whereas the
in EquationEq. (4)
(4)
(4) is demonstrated as the average of all variables and Pd, Pe, and Pa, represent the variable lags.
The slope parameters of long-run estimates through the short-run slope parameters in CS-ARDL model. The long-run slope parameters and the mean group estimator are described in EquationEqs. (5)(5)
(5) and Equation(6)
(6)
(6) .
(5)
(5)
The mean group is referred as under
(6)
(6)
The estimations of the short run coefficients are as under
(7)
(7)
Where
(8)
(8)
(9)
(9)
(10)
(10)
The negative and significant value of ECM (-1) indicates the validity of the CS-ARDL estimates which represent long-run equilibrium adjustment and stability (Shen et al., Citation2021).
4. Estimations and discussions
The world has become a global village (Ahmed et al., Citation2020). Technological advancement the rapid growth of industrialization has strengthened the factor of dependency across economies (Keser et al., Citation2021). Therefore the effects of any positive or negative tremors (unobserved common factor here) may be transmitted to other countries of the study. Thus identification of the C-SD issue in panel data is the primary and crucial step to avoid the spurious results of the further estimates. The panel data analysis starts with the test of Pesaran (Citation2015) to evaluate the presence of C-SD. According to , the result of C-SD test shows that the probability values of C-SD test are significant at the significance level of 1% and fail to accept the null hypothesis of no C-SD. Thus the existence of C-SD in the selected panel data has been confirmed and required to apply the panel unit root test and panel cointegration estimator from second generation (Ahmed et al., Citation2020).
Table 2. Cross-sectional dependency and unit root tests.
For the unit root deduction in all variables, CADF and CIPS panel unit root tests are applied (refer for results). According to the outcomes, all the panel data series such as EF, TOR, INV, GLB, and GDP are stationary at the first difference and significantly reject the null hypothesis of unit root presence. Thus all the variables are integrated into order I(1).
Moreover, in order to evaluate the cointegration among variables of G-10 countries the Westerlund (Citation2007) panel cointegration test has applied which also take into account the C-SD issue of panel data. The test results are reported in to demonstrate that the statistical group Gt and Ga and the panel group Pt and Pa have significant P-values and reject the null hypotheses of no cointegration. Thus the cointegration existence implies the long-run association of TOR, INV, GLB, and GDP with EF.
Table 3. Panel cointegration (Westerlund, Citation2007).
Further, after the confirmation of cointegration among variables, the CS-ARDL (Cross-sectionally augmented autoregressive distributed lags) test was employed by the study to investigate the long-run and short-run relationship of TOR, INV, GLB, and GDP with EF. demonstrates the outcomes of long-run CS-ARDL estimates.
Table 4. CS-ARDL analysis (long run CS-ARDL results).
According to the outcomes presented in , the long-run coefficient of the TOR is 0.097 and highly significant. The positive coefficient demonstrates that the 1% increase in the TOR upsurges the ecological footprint of G-10 countries by 0.097% in the long run. The empirical finding of a positive association of TOR with EF endorses the results of Nathaniel et al. (Citation2021a) and Kongbuamai et al. (Citation2020). In contrast, these outcomes are contrary to the empirical finding of Khan and Hou (Citation2021), who state that tourism reduces environmental degradation.
Moreover, the technological innovation parameters illustrate the destructive effect on the ER; in the long run, the negative and significant value of the coefficient is −0.102, which indicates that the increase in INV by 1% decreases the EF by 0.102% long-run. The inverse relationship between INV and EF is in line with the existing studies of Adebayo and Odugbesan (Citation2021) for Brazil, Khan et al. (Citation2020), and Ahmad et al. (Citation2020) for China, while inconstant with the study results of Chunling et al. (Citation2021) for Pakistan. On the other hand, the long run CS-ARDL estimates give the positive and significant coefficient of 0.298 for GLB, demonstrating that the increase in globalization is the reason for EF enlargement in G-10 countries. These findings are consistent with the study result of Ahmed et al. (Citation2021a) for the USA, Kirikkaleli et al. (Citation2021), for Turkey and inconsistent with the study outcomes of Ahmed et al. (Citation2021b) for Japan, and Apaydin et al. (Citation2021) for 130 countries. Besides this, the GDP is also significantly and positively linked with ER in the long run with the coefficient value of 0.530. The activities related to economic growth increase the environmental deterioration (Lee & Chen, Citation2021).
presents the short-run CS-ARDL estimates of the panel data. According to the outcomes, the TOR, INV, GLB, and GDP have the same associations with EF in the long run. However, the correlation significance has been reduced for TOR and INV. Whereas the coefficients value of short-run estimates of TOR, INV, GLB, and GDP are 0.05, −0.074, 0.250, and 0.480, respectively, show the intensity of the impact of these variables on EF. Finally, the value of ECM (error correction model) illustrates as −0.405 in which is negative and significant and indicates a casual long-run relationship among variables and reasonable convergence toward equilibrium.
Table 5. CS-ARDL analysis (short run CS-ARDL results).
5. Conclusion
The increased size of the ecological footprint is an alarming situation for the world. Several studies have highlighted the factors that contribute to increasing environmental deterioration. This study has taken the initiative to evaluate the aggregate impact of tourism, globalization, and technology innovation on the ecological footprint of G 10 courtiers for the time span over 1995 to 2019. The C-SD test (Pesaran, Citation2015) has confirmed the C-SD issue present in the study data. In contrast, the unit root existence examined by the CIPS panel unit root test introduced by Pesaran (Citation2007). The panel data for all variables are found to be stationary at the first difference, which has motivated to use the Westerlund (Citation2007) panel cointegration test, which has shown that the cointegration exists between TOR, GLB, INV, and EF.
Moreover, the results of the CS-ARDL test illustrate the significant and positive correlation of TOR, GLB, and GDP with EF. In comparison, the outcome shows a significant negative correlation of INV with EF. The positive association of tourism with the ecological footprint is plausible because tourism growth requires more investment. High tourism activities are responsible for excessive fossil fuel consumption, loss of natural habitat, and more carbon emissions. Thus, in the long run, tourism’s contribution increases the ecological footprint in G-10 countries. Similarly, the increase in globalization also tends to increase the trade activities and excessive use of fossil fuel which leads to an increase in the size of EF.
On the other hand, according to this study’s empirical finding, the INV and EF negative association for G-10 countries is also justifiable as TOR is considered a sustainable development tool in all developed economies and promotes renewable energy resources consumption, thus mitigating carbon emission and reducing the EF.
Based on the empirical findings to control the environmental impact of tourism and globalization it has been suggested that the policymakers should implement a few new policies to support tourism and globalization without compromising the sustainability of the environment. Moreover, few initiates can be taken on an urgent basis in G-10 countries which are free from financial constraints. Such as, the tourism industry should carefully handle the natural resources and encourage the use of renewable energy resources. For instance, the use of electric vehicles for domestic tourism transportation encourages eco-friendly activities and implement comprehensive tourism policies and practices to protect the environment. Moreover, the increase in capital investment for domestic tourism helps the industry to change the energy consumption patterns and limit the carbon emission of this sector.
On the other side, to reduce the impact of globalization, policymakers need to consider both the economic and social aspects that enhance environmental issues. Furthermore, there is a need to create awareness at the industry level to save natural resources. High investment in R&D related to TOR will help to find new ways to get more output with less input of energy resources. The investment in technology innovation to reduce the carbon footprint of the high ecological deficit countries of the group such as Belgium, Japan, Netherland, Italy, Germany, Switzerland, and the United Kingdom should be supported collectively by all group members through offering incentives and subsidies. Here the exchange of resources and knowledge can also help to reduce the overall EF.
This study has investigated the impact of TOR, INV, and GLB on EF in G-10 countries and limited the analysis to the long-run and short-run causal estimates. However, future studies can include more social, political, and economic variables such as human capital, industrialization, agriculture, etc. This can make the study more comprehensive. Moreover, in a future study, the use of the quantile regression approach provides in-depth knowledge of variable associations.
Additional information
Funding
References
- Adedoyin, F. F., Nwulu, N., & Bekun, F. V. (2021). Environmental degradation, energy consumption and sustainable development: accounting for the role of economic complexities with evidence from World Bank income clusters. Business Strategy and the Environment, 30(5), 2727–2740.
- Adebayo, T. S., & Acheampong, A. O. (2021). Modelling the globalization-CO2 emission nexus in Australia: Evidence from quantile-on-quantile approach. Environmental Science and Pollution Research, 29(7), 9867–9882.
- Adebayo, T. S., & Odugbesan, J. A. (2021). Modeling CO2 emissions in South Africa: empirical evidence from ARDL based bounds and wavelet coherence techniques. Environmental Science and Pollution Research, 28(8), 9377–9389.
- Ahmed, Z., Ali, S., Saud, S., & Shahzad, S. J. H. (2020). Transport CO2 emissions, drivers, and mitigation: an empirical investigation in India. Air Quality, Atmosphere & Health, 13(11), 1367–1374.
- Ahmad, M., Jiang, P., Majeed, A., Umar, M., Khan, Z., & Muhammad, S. (2020). The dynamic impact of natural resources, technological innovations and economic growth on ecological footprint: An advanced panel data estimation. Resources Policy, 69, 101817. https://doi.org/10.1016/j.resourpol.2020.101817
- Ahmed, Z., Cary, M., & Le, H. P. (2021a). Accounting asymmetries in the long-run nexus between globalization and environmental sustainability in the United States: An aggregated and disaggregated investigation. Environmental Impact Assessment Review, 86, 106511. https://doi.org/10.1016/j.eiar.2020.106511
- Ahmed, Z., Zhang, B., & Cary, M. (2021b). Linking economic globalization, economic growth, financial development, and ecological footprint: Evidence from symmetric and asymmetric ARDL. Ecological Indicators, 121, 107060. https://doi.org/10.1016/j.ecolind.2020.107060
- Alola, A. A., Eluwole, K. K., Lasisi, T. T., & Alola, U. V. (2021). Perspectives of globalization and tourism as drivers of ecological footprint in top 10 destination economies. Environmental Science and Pollution Research, 28(24), 31607–31617.
- An, H., Razzaq, A., Haseeb, M., & Mihardjo, L. W. (2021). The role of technology innovation and people’s connectivity in testing environmental Kuznets curve and pollution heaven hypotheses across the Belt and Road host countries: New evidence from Method of Moments Quantile Regression. Environmental Science and Pollution Research International, 28(5), 5254–5270.
- Ansari, M. A., Haider, S., & Masood, T. (2021). Do renewable energy and globalization enhance ecological footprint: An analysis of top renewable energy countries? Environmental Science and Pollution Research International, 28(6), 6719–6732.
- Ansari, M. A., & Villanthenkodath, M. A. (2021). Does tourism development promote ecological footprint? A Nonlinear ARDL Approach. Anatolia, 1–13.
- Anser, M. K., Apergis, N., Syed, Q. R., & Alola, A. A. (2021). Exploring a new perspective of sustainable development drive through environmental Phillips curve in the case of the BRICST countries. Environmental Science and Pollution Research, 28(35), 48112–48122.
- Apaydin, Ş., Ursavaş, U., & Koç, Ü. (2021). The impact of globalization on the ecological footprint: Do convergence clubs matter? Environmental Science and Pollution Research, 28(38), 53379–53393. https://doi.org/10.1007/s11356-021-14300-y
- Bekun, F. V., Alola, A. A., & Sarkodie, S. A. (2019). Toward a sustainable environment: Nexus between CO2 emissions, resource rent, renewable and nonrenewable energy in 16-EU countries. The Science of the Total Environment, 657, 1023–1029. https://doi.org/10.1016/j.scitotenv.2018.12.104
- Caglar, A. E., Balsalobre-Lorente, D., & Akin, C. S. (2021). Analysing the ecological footprint in EU-5 countries under a scenario of carbon neutrality: Evidence from newly developed sharp and smooth structural breaks in unit root testing. Journal of Environmental Management, 295, 113155. https://doi.org/10.1016/j.jenvman.2021.113155
- Chen, J., Hu, X., Razi, U., & Rexhepi, G. (2021). The sustainable potential of efficient air-transportation industry and green innovation in realising environmental sustainability in G7 countries. Economic Research-Ekonomska Istraživanja, 54(5), 1–22.
- Cheng, C., Ren, X., Dong, K., Dong, X., & Wang, Z. (2021). How does technological innovation mitigate CO2 emissions in OECD countries? Heterogeneous analysis using panel quantile regression. Journal of Environmental Management, 280, 111818.
- Chudik, A., & Pesaran, M. H. (2015). Common correlated effects estimation of heterogeneous dynamic panel data models with weakly exogenous regressors. Journal of Econometrics, 188(2), 393–420. https://doi.org/10.1016/j.jeconom.2015.03.007
- Chunling, L., Memon, J. A., Thanh, T. L., Ali, M., & Kirikkaleli, D. (2021). The impact of public-private partnership investment in energy and technological innovation on ecological footprint: The case of Pakistan. Sustainability, 13(18), 10085. https://doi.org/10.3390/su131810085
- Destek, M. A., & Manga, M. (2021). Technological innovation, financialization, and ecological footprint: Evidence from BEM economies. Environmental Science and Pollution Research International, 28(17), 21991–22001.
- Global Footprint Network. (2017). Country trend (2021). Ecological footprint- carbon footprint. https://data.footprintnetwork.org/
- Global Footprint Network. (2019). Climate change carbon footprint. https://www.footprintnetwork.org/our-work/climate-change/
- Global Footprint Network. (2020). National footprint accounts, 2019 edition. https://www.data.footprintnetwork.org
- Godil, D. I., Sharif, A., Rafique, S., & Jermsittiparsert, K. (2020). The asymmetric effect of tourism, financial development, and globalization on ecological footprint in Turkey. Environmental Science and Pollution Research International, 27(32), 40109–40120.
- Godil, D. I., Yu, Z., Sharif, A., Usman, R., & Khan, S. A. R. (2021). Investigate the role of technology innovation and renewable energy in reducing transport sector CO2 emission in China: A path toward sustainable development. Sustainable Development, 29(4), 694–707.
- IMF. (2021). Group of 10, a guide to committees, groups, and clubs. https://www.imf.org/en/About/Factsheets/A-Guide-to-Committees-Groups-and-Clubs
- Katircioglu, S. (2021). Estimating the role of urban development in environment quality: Evidence from G7 countries. Energy & Environment, 0958305X21997980.
- Katircioglu, S., Gokmenoglu, K. K., & Eren, B. M. (2018). Testing the role of tourism development in ecological footprint quality: Evidence from top 10 tourist destinations. Environmental Science and Pollution Research International, 25(33), 33611–33619.
- Ke, H., Dai, S., & Fan, F. (2021). Does innovation efficiency inhibit the ecological footprint? An empirical study of China’s provincial regions. Technology Analysis & Strategic Management, 1–15. https://doi.org/10.1080/09537325.2021.1959910
- Keser, A., Çütcü, İ., & Eren, V. M. (2021). Does country-level governance matter for national development? An analysis on the founding states of Turkic council. Applied Economics, 1–14.
- Khan, I., & Hou, F. (2021). The dynamic links among energy consumption, tourism growth, and the ecological footprint: The role of environmental quality in 38 IEA countries. Environmental Science and Pollution Research International, 28(5), 5049–5062.
- Khan, Z., Ali, M., Kirikkaleli, D., Wahab, S., & Jiao, Z. (2020). The impact of technological innovation and public‐private partnership investment on sustainable environment in China: Consumption‐based carbon emissions analysis. Sustainable Development, 28(5), 1317–1330. https://doi.org/10.1002/sd.2086
- Kihombo, S., Ahmed, Z., Chen, S., Adebayo, T. S., & Kirikkaleli, D. (2021a). Linking financial development, economic growth, and ecological footprint: What is the role of technological innovation? Environmental Science and Pollution Research International, 28(43), 61235–61245.
- Kihombo, S., Vaseer, A. I., Ahmed, Z., Chen, S., Kirikkaleli, D., & Adebayo, T. S. (2021b). Is there a tradeoff between financial globalization, economic growth, and environmental sustainability? An advanced panel analysis. Environmental Science and Pollution Research, 29(3), 3983. https://doi.org/10.1007/s11356-021-15878-z
- Kirikkaleli, D., Adebayo, T. S., Khan, Z., & Ali, S. (2021). Does globalization matter for ecological footprint in Turkey? Evidence from dual adjustment approach. Environmental Science and Pollution Research International, 28(11), 14009–14017.
- Kongbuamai, N., Bui, Q., Yousaf, H. M. A. U., & Liu, Y. (2020). The impact of tourism and natural resources on the ecological footprint: A case study of ASEAN countries. Environmental Science and Pollution Research International, 27(16), 19251–19264. https://doi.org/10.1007/s11356-020-08582-x
- Lee, C. C., & Chen, M. P. (2021). Ecological footprint, tourism development, and country risk: International evidence. Journal of Cleaner Production, 279, 123671. https://doi.org/10.1016/j.jclepro.2020.123671
- Liu, D., Xie, Y., Hafeez, M., & Usman, A. (2022). The tradeoff between economic performance and environmental quality: Does financial inclusion matter for emerging Asian economies? Environmental Science and Pollution Research, 1–10.
- Luo, F., Moyle, B. D., Moyle, C. L. J., Zhong, Y., & Shi, S. (2020). Drivers of carbon emissions in China’s tourism industry. Journal of Sustainable Tourism, 28(5), 747–770. https://doi.org/10.1080/09669582.2019.1705315
- Mushta, A., Chen, Z., Ud Din, N., Ahmad, B., & Zhang, X. (2020). Income inequality, innovation and carbon emission: Perspectives on sustainable growth. Economic Research-Ekonomska Istraživanja, 33(1), 769–787. https://doi.org/10.1080/1331677X.2020.1734855
- Nathaniel, S., Anyanwu, O., & Shah, M. (2020). Renewable energy, urbanization, and ecological footprint in the Middle East and North Africa region. Environmental Science and Pollution Research, 27(13), 14601–14613.
- Nathaniel, S. P., Barua, S., & Ahmed, Z. (2021a). What drives ecological footprint in top ten tourist destinations? Evidence from advanced panel techniques. Environmental Science and Pollution Research, 28(28), 38322. https://doi.org/10.1007/s11356-021-13389-5
- Nathaniel, S. P., Murshed, M., & Bassim, M. (2021b). The nexus between economic growth, energy use, international trade and ecological footprints: The role of environmental regulations in N11 countries. Energy, Ecology and Environment, 6(6), 496. https://doi.org/10.1007/s40974-020-00205-y
- Ozturk, I., & Acaravci, A. (2009). On the causality between tourism growth and economic growth: Empirical evidence from Turkey. Transylvanian Review of Administrative Sciences, 5(25), 73–81.
- Ozturk, I., Al-Mulali, U., & Saboori, B. (2016). Investigating the environmental Kuznets curve hypothesis: The role of tourism and ecological footprint. Environmental Science and Pollution Research International, 23(2), 1916–1928. https://doi.org/10.1007/s11356-015-5447-x
- Pata, U. K. (2021). Linking renewable energy, globalization, agriculture, CO2 emissions and ecological footprint in BRIC countries: A sustainability perspective. Renewable Energy, 173, 197–208. https://doi.org/10.1016/j.renene.2021.03.125
- Pesaran, M. H. (2004). General diagnostic tests for cross section dependence in panels (IZA Discussion Paper No. 1240). Institute for the Study of Labor (IZA).
- Pesaran, M. H. (2007). A simple panel unit root test in the presence of cross‐section dependence. Journal of Applied Econometrics, 22(2), 265–312. https://doi.org/10.1002/jae.951
- Pesaran, M. H. (2015). Testing weak cross-sectional dependence in large panels. Econometric Reviews, 34(6–10), 1089–1117. https://doi.org/10.1080/07474938.2014.956623
- Razzaq, A., Fatima, T., & Murshed, M. (2021a). Asymmetric effects of tourism development and green innovation on economic growth and carbon emissions in Top 10 GDP Countries. Journal of Environmental Planning and Management, 1–30. https://doi.org/10.1080/09640568.2021.1990029
- Razzaq, A., Sharif, A., Ahmad, P., & Jermsittiparsert, K. (2021b). Asymmetric role of tourism development and technology innovation on carbon dioxide emission reduction in the Chinese economy: Fresh insights from QARDL approach. Sustainable Development, 29(1), 176–193. https://doi.org/10.1002/sd.2139
- Rehman, A., Radulescu, M., Ma, H., Dagar, V., Hussain, I., & Khan, M. K. (2021). The impact of globalization, energy use, and trade on ecological footprint in Pakistan: Does environmental sustainability exist? Energies, 14(17), 5234. https://doi.org/10.3390/en14175234
- Sabir, S., & Gorus, M. S. (2019). The impact of globalization on ecological footprint: Empirical evidence from the South Asian countries. Environmental Science and Pollution Research International, 26(32), 33387–33398.
- Sarkodie, S. A. (2021). Environmental performance, biocapacity, carbon & ecological footprint of nations: Drivers, trends and mitigation options. The Science of the Total Environment, 751, 141912.
- Saud, S., Chen, S., & Haseeb, A. (2020). The role of financial development and globalization in the environment: Accounting ecological footprint indicators for selected one-belt-one-road initiative countries. Journal of Cleaner Production, 250, 119518.
- Sharif, A., Afshan, S., Chrea, S., Amel, A., & Khan, S. A. R. (2020). The role of tourism, transportation and globalization in testing environmental Kuznets curve in Malaysia: New insights from quantile ARDL approach. Environmental Science and Pollution Research International, 27(20), 25494–25509.
- Sharif, A., Afshan, S., & Qureshi, M. A. (2019). Idolization and ramification between globalization and ecological footprints: Evidence from quantile-on-quantile approach. Environmental Science and Pollution Research International, 26(11), 11191–11211.
- Sharma, J., & Mitra, S. K. (2021). Asymmetric relationship between tourist arrivals and employment. Tourism Economics, 27(5), 952–970. https://doi.org/10.1177/1354816620910000
- Shen, Y., Su, Z. W., Malik, M. Y., Umar, M., Khan, Z., & Khan, M. (2021). Does green investment, financial development and natural resources rent limit carbon emissions? A provincial panel analysis of China. Science of the Total Environment, 755, 142538. https://doi.org/10.1016/j.scitotenv.2020.142538
- Shokoohi, Z., Dehbidi, N. K., & Tarazkar, M. H. (2022). Energy intensity, economic growth and environmental quality in populous Middle East Countries. Energy, 239, 122164.
- Shuai, C., Shen, L., Jiao, L., Wu, Y., & Tan, Y. (2017). Identifying key impact factors on carbon emission: Evidences from panel and time-series data of 125 countries from 1990 to 2011. Applied Energy, 187, 310–325. https://doi.org/10.1016/j.apenergy.2016.11.029
- Sinha, A., Sengupta, T., & Alvarado, R. (2020). Interplay between technological innovation and environmental quality: Formulating the SDG policies for next 11 economies. Journal of Cleaner Production, 242, 118549. https://doi.org/10.1016/j.jclepro.2019.118549
- Song, Y., Zhao, P., Chang, H. L., Razi, U., & Dinca, M. S. (2021). Does the COVID-19 pandemic affect the tourism industry in China? Evidence from extreme quantiles approach. Economic Research-Ekonomska Istraživanja, 1–18.
- Sun, Y., Kamran, H. W., Razzaq, A., Qadri, F. S., Economist, R., & Suksatan, W. (2022). Dynamic and causality linkages from transportation services and tourism development to economic growth and carbon emissions: New insights from Quantile ARDL approach. Integrated Environmental Assessment and Management. https://doi.org/10.1002/ieam.4570
- Tahir, Z. I., & Rafiq, G. A. (2021). Sustainable development of the tourism industry in Azerbaijan. Universidad y Sociedad, 13(1), 43–50.
- Tang, R. (2021). Trade facilitation promoted the inbound tourism efficiency in Japan. Tourism Management Perspectives, 38, 100805. https://doi.org/10.1016/j.tmp.2021.100805
- Tao, R., Umar, M., Naseer, A., & Razi, U. (2021). The dynamic effect of eco-innovation and environmental taxes on carbon neutrality target in emerging seven (E7) economies. Journal of Environmental Management, 299, 113525.
- Udemba, E. N., & Keleş, N. İ. (2021). Interactions among urbanization, industrialization and foreign direct investment (FDI) in determining the environment and sustainable development: New insight from Turkey. Asia-Pacific Journal of Regional Science, 6(1), 191–212.
- Ulucak, R. (2020). How do environmental technologies affect green growth? Evidence from BRICS economies. Science of the Total Environment, 712, 136504.
- Usman, M., & Makhdum, M. S. A. (2021). What abates ecological footprint in BRICS-T region? Exploring the influence of renewable energy, non-renewable energy, agriculture, forest area and financial development. Renewable Energy, 179, 12–28. https://doi.org/10.1016/j.renene.2021.07.014
- Wang, Y. L., Zhao, C., Guan, X. Y., & Yaqoob, T. (2021). Strengthening climate prevention through economic globalization, clean energy, and financial development in N11 countries: Evidence from advance panel estimations. Economic Research-Ekonomska Istraživanja, 1–23.
- Westerlund, J. (2007). Testing for error correction in panel data. Oxford Bulletin of Economics and Statistics, 69(6), 709–748. https://doi.org/10.1111/j.1468-0084.2007.00477.x
- Wiedmann, T., & Minx, J. (2008). A definition of ‘carbon footprint’. Ecological Economics Research Trends, 1, 1–11.
- Worldometer. (2017). GDP by country 2017. https://www.worldometers.info/gdp/gdp-by-country/
- Xuefeng, Z., Razzaq, A., Gokmenoglu, K. K., & Rehman, F. U. (2021). Time varying interdependency between COVID-19, tourism market, oil prices, and sustainable climate in United States: Evidence from advance wavelet coherence approach. Economic Research-Ekonomska Istraživanja, 1–23. https://doi.org/10.1080/1331677X.2021.1992642
- Yang, B., Jahanger, A., & Ali, M. (2021a). Remittance inflows affect the ecological footprint in BICS countries: Do technological innovation and financial development matter? Environmental Science and Pollution Research International, 28(18), 23482–23500. https://doi.org/10.1007/s11356-021-12400-3
- Yang, B., Usman, M., & Jahanger, A. (2021b). Do industrialization, economic growth and globalization processes influence the ecological footprint and healthcare expenditures? Fresh insights based on the STIRPAT model for countries with the highest healthcare expenditures. Sustainable Production and Consumption, 28, 893–910. https://doi.org/10.1016/j.spc.2021.07.020
- Yang, X., Li, N., Mu, H., Zhang, M., Pang, J., & Ahmad, M. (2021). Study on the long-term and short-term effects of globalization and population aging on ecological footprint in OECD countries. Ecological Complexity, 47, 100946. https://doi.org/10.1016/j.ecocom.2021.100946
- Zaidi, S. A. H., Zafar, M. W., Shahbaz, M., & Hou, F. (2019). Dynamic linkages between globalization, financial development and carbon emissions: Evidence from Asia Pacific Economic Cooperation countries. Journal of Cleaner Production, 228, 533–543. https://doi.org/10.1016/j.jclepro.2019.04.210
- Zhang, S., & Liu, X. (2019). The roles of international tourism and renewable energy in environment: New evidence from Asian countries. Renewable Energy, 139, 385–394. https://doi.org/10.1016/j.renene.2019.02.046
- Zhuang, Y., Yang, S., Razzaq, A., & Khan, Z. (2021). Environmental impact of infrastructure-led Chinese outward FDI, tourism development and technology innovation: A regional country analysis. Journal of Environmental Planning and Management, 1–33. https://doi.org/10.1080/09640568.2021.1989672