
 ?Mathematical formulae have been encoded as MathML and are displayed in this HTML version using MathJax in order to improve their display. Uncheck the box to turn MathJax off. This feature requires Javascript. Click on a formula to zoom.
Abstract
This study examines the relationship between green energy, non-renewable energy, financial development, and economic growth with carbon footprint by using panel data from 63 emerging and developed economies for the time period from 1990 to 2020. The study utilises second-generation panel data econometrics techniques to investigate cross-section independence and adjust for cross-section heterogeneity. The studies also used the CIPS and CADF unit root tests, Wester Lund bootstrap cointegration techniques, and AMG and CCEMG heterogeneous panel causality techniques. The findings show that, over the long run, all variables are cointegrated. Additionally, the data indicate that non-renewable energy consumption leads to carbon footprint, whereas green energy reduces environmental degradation and supports the reduction of environmental hazards. Likewise, financial development has a considerable negative effect on environmental degradation. A statistically significant bidirectional correlation is found between green energy, nonrenewable energy, financial development, economic growth, and carbon footprint according to the Dumitrescu-Hurlin causality test. Finally, according to the findings of the study, the economies that were examined should use more green energy in order to reduce their carbon footprint.
1. Introduction
Economies that rely heavily on energy from fossil fuels are increasingly focusing on green energy sources. ‘Green energy’ is a colloquial term for ‘green’ or ‘sustainable’ energy sources. Sustainable energy sources include solar, wind, rain, and geothermal heat, all of which have low environmental impacts when used. Many societal benefits can be attributed to the use of green energy and energy efficiency, including decreased energy costs, better air quality and public health, and an increase in job creation and economic growth. Conserving green energy is widely recognised as a critical component of reducing carbon footprint. There is a carbon imprint on more than two thirds of worldwide energy production and consumption. The use of green energy sources has an immense impact on reducing the carbon footprint of the world.
The eradication of catastrophic climate events that continue to damage the entire planet is one of the most explosive concerns of the last two to three decades. Due to its ability to hold heat, carbon footprint is both a major source of global warming and an immediate danger to the environment. Natural and man-made catastrophes are to blame for climate change (Udemba, Citation2020) Carbon dioxide (CO2), sulphur hexafluoride (SF6), nitrous oxide (N2O), and methane (CH4) are some of the gases that contribute to global warming because of human activities such as deforestation, industrial smoke, and fossil fuel burning. (Grossman & Krueger, Citation1991) also analysed three air contaminants in 42 nations to see if they were associated with economic growth. While at low-income levels, he found that sulphur dioxide and carbon dioxide levels rose in correlation with per capita GDP, at higher-income levels, he found that these concentrations declined and an inverted U-shaped association exists between pollution levels and income growth.
The analysis concludes that evidence of the relationship between carbon footprint, green energy, non-renewable energy and economic growth is critical for environmental policy. Green energy development or use seems to have a significant impact on both the economy and the environment. Another way, boosting economic, human, and environmental development through the use of green energy is important because it is more environmentally friendly (Rafindadi & Ozturk, Citation2017). Various factors, time periods, nations, and econometric methodologies have been researched empirically in the past to see if there is a long-term link between the use of green energy and sustainable economic growth. Green energy, carbon footprint, and economic growth are all intertwined (Apergis & Payne, Citation2011; Ozturk, Citation2010; Payne, Citation2010).
Furthermore, some studies have suggested that green energy does not help to reduce the carbon footprint (Frondel et al., Citation2010; Marques & Fuinhas, Citation2012). From this perspective (Apergis et al., Citation2010), they claim that green energy adoption is frequently coupled with excessive complexity in green energy development. In most cases, the cost of constructing green energy systems is mitigated by the utilisation of non-renewable energy sources such as coal and natural gas. In certain instances, the cost of unskilled labour and the unmet goal of a low-carbon economy often exceed the cost of green intermittent renewables. Due to the extensive deployment procedure, the economy fails to shrink the grey proposed clustering, resulting in adverse outcomes.
The expanse of thermal emissions released into the atmosphere by the world′s most carbon-emitting countries varies dramatically. Major emerging economies are in dire need of economic growth, which frequently results in environmental degradation. As a result, developed economies often emit more per capita than emerging economies, although some emerging economies are also growing at the fastest rate in the world (Kong & Khan, Citation2019). The panel report on (BP, Citation2019) statistics on global energy shows that this carbon emitting emerging and developed economies significantly increase carbon footprint: China (27.8%), the United States (15.1%), India (7.3%), Russia (4.8%), Japan (3.3%), Germany (2.1%), South Korea (2.0%), Iran (1.8%), Saudi Arabia (1.6%), Canada (1.6%), Indonesia (1.4%). These statistics show that these economies cause the most environmental harm. The emitting countries’ energy use amounts to roughly 82 percent of global consumption (Newell et al., Citation2019). However, in recent years, the entire global population has contributed to environmental destruction, and finding equitable and effective solutions to global pollution, carbon footprint, global warming, and environmental protection, while maintaining economic growth has now become exceedingly challenging.
On the other hand, stable financial system helps reduce environmental destruction and improves business prospects, product and service interchange, savings, investment efficiency, and technology however, if the financial sector is expanded without consideration for the country′s economic circumstances, the repercussions could be disastrous (Charfeddine & Kahia, Citation2019; Shahbaz et al., Citation2012) also found that financial development enhances the amount of environmental deficit. The increase in carbon footprint has pushed governments to undertake efforts toward the execution and formulation of energy plans aimed at encouraging the use of green & sustainable energy and thereby eliminating carbon footprint in the economic process (Sharif et al., Citation2020). As a result, it is necessary to evaluate the influence of green energy and non-renewable energy, as well as financial inclusion, on the carbon footprint in emerging and developed economies in order to construct a suitable policy.
Many studies have demonstrated that there is a link between green energy and non-renewable energy, financial development, economic growth, and carbon footprint (Assi et al., Citation2021; Usman & Makhdum, Citation2021). Real-income growth affects energy consumption indirectly and this influence might be favourable or adverse, depending on how well energy management and economic growth are organised. Consequently, expansion in manufacturing tends to enhance production behaviour and activities. This will lead to increased economic growth and energy consumption, while also exacerbating global warming and carbon footprint (Shahbaz et al., Citation2012; Yang et al., Citation2021).
Using heterogeneous panel analysis techniques and a cross-sectional dependency test, this study contributes to understand the link between green energy and non-renewable energy, financial development, and economic growth with carbon footprint in 63 emerging and developed economies. This research also investigates the long-run elasticity of all variables so these elasticities reflect the cross-sectional and panel longitudinal dimensional composition and provide more significant results than time series techniques. The remaining portion of the paper is organised as follows: To begin, Section 2 presents an outline of the theoretical underpinning and empirical evidences. Sections 3 and 4 detail the data, model and econometric modelling strategy and estimation results respectively. Toward the end of the research, Section 5 analyses the conclusion, policy implications and future research recommendations.
2. Theoretical underpinning and empirical evidence
Carbon footprint, financial development, green energy, non-renewable energy use and economic growth are examined in a variety of inconclusive literatures, as shown in . Previous research has shown that economic growth and environmental sustainability are two sides of the same coin that must be balanced (Khan et al., Citation2019). Recognising these detrimental effects on environmental sustainability, developed countries incorporated pro-environmental policies and prompted firms to integrate green energy sources into their manufacturing and strategic operations through a variety of incentives, including tax exemptions and/or subsidies on green products, which not only stimulate economic development but also contribute to the environmental sustainability (Kouhizadeh et al., Citation2020; Zhu et al., Citation2020).
Table 1. Summary of the literature review on the nexus between carbon footprint, financial development, green energy, non-renewable energy and economic growth.
Recent empirical research on the link between carbon footprint, green energy and economic growth can be categorised into numerous strands. Green energy and its determinants have been highlighted in recent studies (Sohag et al., Citation2021; Taşkın & Demir, Citation2020; Ulucak, Citation2020). Many of these studies, such as (Fang, Citation2011) for China, (Payne, Citation2011) for the United States, (Adedoyin et al., Citation2021) and (Salahuddin et al., Citation2020) for countries in Sub-Saharan Africa (SSA), (Chien & Hu, Citation2007) for 45 economies, (Inglesi-Lotz, Citation2016) for countries in the OECD, (Ozturk & Bilgili, Citation2015) for 51 countries in Sub-Sahara depending on the number of stages of production, green energy can create more jobs, particularly when the technological accessories are manufactured and controlled domestically and can still be cost-effective as well. Both production growth and employment prospects could be facilitated by expanding the use of green energy to a greater level (Dai et al., Citation2016).
The literature on the relationship between real per capita income and green energy usage in emerging and OECD nations (Apergis et al., Citation2010) is also helpful in this regard. According to Tugcu et al. (Citation2012), a rise in the share of green energy in the total energy mix for the G7 countries increases GDP. Accordingly, a number of additional studies confirm the link between China′s GDP, carbon footprint and an increase in the share of green energy in the entire energy mix (Fang, Citation2011) and for Denmark (Mathiesen et al., Citation2011).
Various research has been done on energy utilisation and carbon footprint in developing and developed countries, as shown in the above literature review. Green energy has no causal association with carbon footprint in the U.S.A. (Menyah & Wolde-Rufael, Citation2010) and (Apergis et al., Citation2010) also found no causal link between green energy consumption and carbon footprint in panel analyses of 19 countries. So, a time-frequency causal analysis is still needed to analyse the causal link between green energy consumption and carbon footprint.
3. Data, model and econometric modelling strategy
Panel data from 63 emerging and developed economies were used for this study, which covered the years 1990–2020. As shown in , the data on carbon footprint (CF), GDP per capita (Y), non-renewable energy use (NREU), and green energy use (GEU) comes from the World Development Indicators database (WDI). The International Monetary Fund (IMF) is the source of financial development (FD) data.
Table 2. Data variables and sources.
GDP per capita is measured by Y, CO2 footprint are measured by CF, non-renewable energy use is measured by NRE, financial development is measured by FD, and green energy use is defined by GEU. In this study, which uses panel data from 63 economies from 1999 to 2020, green and non-renewable energy are utilised as determinants of the carbon footprint model. According to our model, carbon footprints have the following function:
(1)
(1)
Whereas; stands for carbon footprint per capita,
is a RGDP per capita,
is a financial development as a % of GDP,
is a green energy and
is a non-renewable energy.
To proceed, shows how statistically significant each indicator is. (i.e., Mean, Median, Minimum, Maximum, Standard Deviation, Skewness and Kurtosis). The mean values of CF, Y, FD, GEU and NREU are 9.9021, 98.3563, 51.2210, 45.0095 and 90.8212, respectively. The standard deviations for CF, Y, FD, GEU and NREU are impressive as 2.6712, 10.3211, 8.6410, 30.1123 and 15.9043, respectively. The variables′ descriptive statistics enable for further analysis. In addition, it is observed that a positive bivariate correlation of GDP exists with all aforementioned variables except renewable energy utilisation.
Table 3. Descriptive statistics.
As seen in , CF is highly correlated with NREU (0.9931) had the strongest positive correlation with the dependent variable (CF), followed by financial development (0.4961), economic growth (0.6967). However, it is adversely linked with green energy (−0.3001). In addition, it is observed that a positive bivariate correlation of GDP exists with all aforementioned variables except green energy consumption.
Table 4. Correlation matrix.
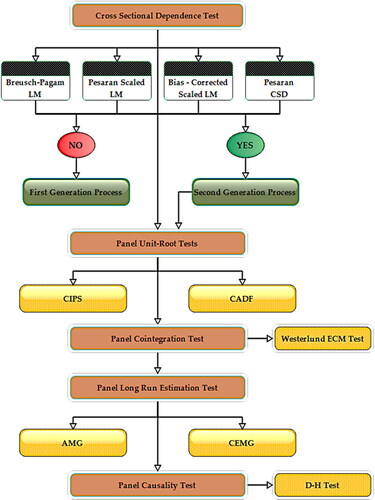
portrays the step-by-step econometric modelling strategy for the sake of clarity and ease of understanding by beginning to run the cross-sectional dependence test (CD) on the data. Cointegration and long-run analysis were also done after CD. Finally, panel causality between variables was tested.
Figure 1. Steps of econometric modelling strategy.
Source: The Author.
4. Estimation results
4.1. Cross-sectional dependence (CSD) test
Increasing interdependence has made panel data analysis more vulnerable to cross-sectional dependency. The problem of cross-sectional interdependence may lead to biased and unreliable assessments if it cannot be resolved while claiming independence between cross-sections (Adebayo et al., Citation2020). It is determined whether there is cross-sectional dependency in this study by calculating the (Pesaran, Citation2007) test as follows:
(2)
(2)
where
represents a correlation among the errors. The cross-sectional dependence test’s null and alternative hypotheses are as follows:
Firstly, CSD across variables and economies in panel data sets must be evaluated. This study used CSD tests to see if CSD exist or not. shows all four CSD tests. The CSD test results for cross-sectional variables exhibit statistically significant P-values, indicating that the CSD exists at a 1 percent significance level. According to this, one country′s shock produces a repercussion that can be seen across the entire panel. Therefore, the second-generation tests must be carried out among the variables in the study.
Table 5. Cross-sectional dependence test results.
4.2. Panel unit root tests
It was suggested by Rauf et al. (Citation2018) that both parametric and non-parametric approaches be used to verify the right level of cointegration order in panel data (because of the CSD). In the first generation of panel unit root tests CSD effects, heterogeneity, and over-rejection of the null hypothesis (H0) are not taken into account (Choi, Citation2001). A second-generation panel unit root test, the Cross-sectional Augmented Dickey-Fuller (CADF) and Cross Sectional Augmented CIPS, are used in the study to overcome this issue (Pesaran, Citation2021). The CADF test is carried out using the following equation:
(3)
(3)
the single lag in the preceding EquationEquation (3)
(3)
(3) , the succeeding EquationEquation (4)
(4)
(4) is as follows:
(4)
(4)
where
and
show the lagged level mean and each cross-first section′s difference from each unit. The CIPS test statistics are computed after the CADF statistics. The CIPS test statistics are presented below in EquationEquation (5)
(5)
(5) :
(5)
(5)
It is preferable to use Second-generation panel unit root tests that provide robust coefficients when variables and panels demonstrate heterogeneity and CSD. Second-generation panel unit root (CIPS and CADF) tests that address the CSD problem are depicted in and indicated by the rejection of the null hypothesis of CSD for all variables at the 1% level of significance. The CIPS unit root test results reveal the null hypothesis is rejected for all variables and accept alternative. Generally, assessing the presence of unit root among variables in empirical analysis might lead to inaccurate results. Thus, stationarity of variables is established before empirical estimation.
Table 6. Panel unit root test results.
4.3. Panel cointegration test
After data stationarity, this study will utilise a second-generation panel cointegration test (Westerlund, Citation2007) to check for long-term cointegration between the variables. This method provides more consistent and trustworthy estimates of cointegration than first-generation panel-cointegration approaches. So, according to (Belaïd & Zrelli, Citation2019). The functional version of the Westerlund cointegration test is expressed as follows:
(6)
(6)
After confirming the variables’ stationarity, the second-generation cointegration test (Westerlund, Citation2007) bootstrap panel cointegration is used to assess the variables’ cointegration for analysing the long-run relationship between variables over the entire sample of 63 emerging and developed economies. Because of these benefits, bootstrapping panel cointegration is increasingly being used by researchers to investigate long-term relationships (Lee & Brahmasrene, Citation2013; Westerlund, Citation2007) has developed a novel panel cointegration test that focuses on structural rather than residual dynamics. The results show that these tests have restricted normal distributions and are more consistent. According to Westerlund (Citation2007) and Persyn and Westerlund (Citation2008) the cointegration hypothesis is tested using two separate tests: group mean and panel mean. Westerlund (Citation2007) developed four test statistics based on the Error Correction Model: Ga, Gt, Pa, and Pt. The Gt and Pt are calculated using the error correction model’s standard error parameters. Ga and Pa are based on Newey and West (Citation1994) standard errors corrected for autocorrelations and heteroskedasticity. The findings are offered in two formats, the outcome rejects the null hypothesis and accepts the alternative. The second-generation test confirms the long-term cointegration of the variables. As shown in , all variables strongly and significantly support the long-run cointegration process at the 1% level in both tests (intercept and intercept & trend).
Table 7. Panel cointegration test results.
4.4. Long-run estimation test
When an econometric model is subjected to both cross-sectional dependency and economy-specific heterogeneity, panel estimators may yield inconsistent and biased results, leading to inaccurate interpretations (Wang & Dong, Citation2019). Eberhardt and Bond (Citation2009) presented an augmented mean group (AMG) technique to address these difficulties. AMG regression enables policymakers in achieving more precise policy objectives since it provides results that are particular to the economy. The two-phase AMG process is represented by the following two EquationEquations (7)(7)
(7) and Equation(8)
(8)
(8) :
(7)
(7)
(8)
(8)
Correlation and heterogeneity among individual cross sections were also addressed using the CCEMG approach in this study. Non-stationarity, heterogeneous slopes, and CSD are all well-suited for this test, which also deals with unobservable elements (Pesaran, Citation2006; Usman, Makhdum, et al., Citation2021). This test′s functional appearance is shown in the following EquationEquation (9)(9)
(9) :
(9)
(9)
where
represents the first half (t = 1, 2, …, (T/2)) of CCEMG in time dimension and
represents the second half (t = (T/2) +1, (T/2) +2, (T/2) +3, …, T) of CCEMG, respectively.
According to these findings, economic development and the use of nonrenewable energy sources have a major impact on our planet′s ecological imprint as shown in . On the other hand, financial development and the extensive use of green energy are key factors in raising the global ecological footprint over the long term in both emerging and advanced economies. According to AMG findings, a 1% influence in financial development will create a 0.5200 percent decrease in the carbon footprint. Statistically, the developed financial industry contributes greatly to these countries′ environmental sustainability. To prevent and regulate carbon footprint, these economies′ financial infrastructures and industrial units use current and eco-friendly technologies (Tamazian et al., Citation2009).
Table 8. Panel long-run estimation test results.
4.5. Panel causality test
The Dumitrescu-Hurlin test (DH) was created for heterogeneous panel data models. Prior panel causality tests did not take into consideration cross-section dependency; the DH test does; and it works well in panels with imbalances (Dumitrescu & Hurlin, Citation2012). Dumitrescu and Hurlin came up with the linear model as shown in EquationEquation (10)(10)
(10) .
(10)
(10)
where
individual fixed effects,
Lag parameters, K = lag length and
slope parameters.
and
show the units′ differences.
Using Wald statistics to evaluate the null and alternative hypotheses for a specific individual is a reliable method. The following EquationEquation (11)(11)
(11) represents the results of the panel test:
(11)
(11)
where Dumitrescu and Hurlin (Citation2012) advocated using the z-test statistic as stated in EquationEquation (12)
(12)
(12) for greater time dimensions as contrasted to cross-sections (T > N).
(12)
(12)
To conclude, we utilised the D-H non-causality test to see if there was a link between the variables we were investigating. and indicated that increasing the use of non-renewable energy leads to carbon footprint, suggesting a bidirectional causality between economic growth, financial development, and green energy. On the other hand, there appears to be a unidirectional causality between non-renewable energy use and carbon footprint. Prior research supports this notion, and it is important to note that most emerging or high carbon emitting economies rely on conventional energy sources like oil, gas and coal. However, the biocapacity of the environment is being enhanced by the use of green energy sources.
Figure 2. Flow of causality relationship (Carbon Footprint Function).
Source: The Author.
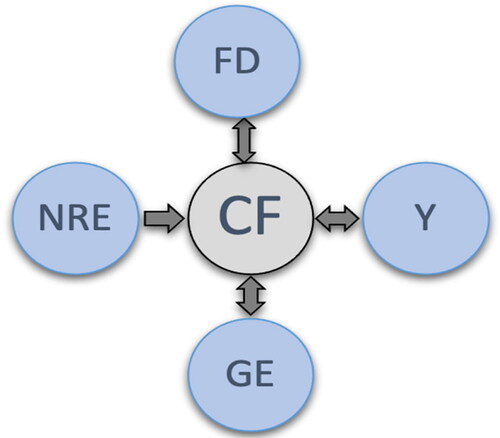
Table 9. Panel causality test results.
5. Conclusion and policy recommendation
This study examines the influence of green energy and non-renewable energy consumption on environmental degradation from 1990 to 2020 utilising a multivariate framework and panel data sets for 63 developing economies. This study′s findings represent a ground-breaking attempt to examine the relationship between economic growth, carbon footprint, and green energy and non-renewable energy consumption across a large panel of countries. The findings of this study reinforce the widely held belief in the literature that non-renewable energy consumption has a positive and significant effect on overall carbon footprint, whereas green energy consumption has a negative and significant impact on the global ecosystem. In short, non-renewable energy is likely contributing to worldwide carbon footprint, whereas green energy contributes to mitigating and regulating worldwide carbon footprint, as this study also illustrates. Conversely, financial development has a significant unfavourable effect on carbon footprint. Renewable energy sources should be promoted in this study, which found that green and renewable electrical infrastructures, as well as eco-friendly projects, should be given more attention. This will help the economies studied, as well as their energy security and pollution (Usman, Khalid, et al., Citation2021; Usman, Yaseen, et al., Citation2021). Cleaner energy and energy-efficient equipment are long-term projects that require financial support. In this case, well-developed markets and institutions can help these projects move forward. This will help the environment because it will cut down on the amount of energy that is used (Nasreen et al., Citation2017; Usman et al., Citation2020).
On the basis of these findings, it is proposed that governments of emerging and developed carbon emitting economies increase international and national strategies to address carbon footprint while also reducing non-renewable energy usage. Additionally, they must promote green energy usage across all sectors. Additionally, the government invests more in advanced technology to create a more effective and efficient energy producing system, which contributes to the reduction of carbon footprint. Furthermore, these countries must have an adequate and suitable alternative to expand their dependence on non-renewable energy sources that are generally not polluting to the environment. Similarly, government must take significant action, such as reducing non-renewable energy consumption and increasing the ratio of green energy use. Additionally, the government may initiate a micro-finance proposal for hydrological and biomass generation. As a result of this, the government will benefit and sustained growth will be possible. As a result, energy policies in these countries should prioritise environmental growth, economic growth, and the use of green energy.
Researchers, on the other hand, are given particular attention so that they can analyse the results of these inventions in depth. Extending the data chronology and added more variables allows researchers to perform a more comprehensive empirical investigation on the same variables. The dynamic nexus of the environmental Kuznets curve (EKC) and the pollution heaven, halo hypothesis can also be investigated in future research. In addition, future studies may include variables that represent cultural activities, such as social, institutional, and political indicators, which may influence the financial and energy-led growth hypothesis and their impact on environmental quality. These variables have different preferences in specific countries. In addition, the findings of this study should inspire further research on the same indicators (and other indicators) for emerging and developed economies individually.
Acknowledgment
I would like to acknowledge the support of Prince Sultan University for paying the article processing charges (APC) of this publication.
Disclosure statement
No potential conflict of interest was reported by the author.
References
- Acaravci, A., & Ozturk, I. (2010). On the relationship between energy consumption, CO2 emissions and economic growth in Europe. Energy, 35(12), 5412–5420.
- Adebayo, T. S., Awosusi, A. A., & Adeshola, I. (2020). Determinants of CO2 emissions in emerging markets: An empirical evidence from MINT economies. International Journal of Renewable Energy Development, 9(3), 411–422.
- Adedoyin, F. F., Ozturk, I., Agboola, M. O., Agboola, P. O., & Bekun, F. V. (2021). The implications of renewable and non-renewable energy generating in Sub-Saharan Africa: The role of economic policy uncertainties. Energy Policy, 150, 112115.
- Ahmad, M., Jiang, P., Majeed, A., & Raza, M. Y. (2020). Does financial development and foreign direct investment improve environmental quality? Evidence from belt and road countries. Environmental Science and Pollution Research International, 27(19), 23586–23601.
- Ajmi, A. N., Hammoudeh, S., Nguyen, D. K., & Sato, J. R. (2015). On the relationships between CO2 emissions, energy consumption and income: The importance of time variation. Energy Economics, 49, 629–638.
- al Mamun, M., Sohag, K., Shahbaz, M., & Hammoudeh, S. (2018). Financial markets, innovations and cleaner energy production in OECD countries. Energy Economics, 72, 236–254.
- Al-Mulali, U., Weng-Wai, C., Sheau-Ting, L., & Mohammed, A. H. (2015). Investigating the environmental Kuznets curve (EKC) hypothesis by utilizing the ecological footprint as an indicator of environmental degradation. Ecological Indicators, 48, 315–323.
- Apergis, N., & Payne, J. E. (2009). CO2 emissions, energy usage, and output in Central America. Energy Policy, 37(8), 3282–3286.
- Apergis, N., & Payne, J. E. (2011). The renewable energy consumption–growth nexus in Central America. Applied Energy, 88(1), 343–347.
- Apergis, N., & Payne, J. E. (2015). Renewable energy, output, carbon dioxide emissions, and oil prices: Evidence from South America. Energy Sources, Part B: Economics, Planning, and Policy, 10(3), 281–287.
- Apergis, N., Payne, J. E., Menyah, K., & Wolde-Rufael, Y. (2010). On the causal dynamics between emissions, nuclear energy, renewable energy, and economic growth. Ecological Economics, 69(11), 2255–2260.
- Assi, A. F., Isiksal, A. Z., & Tursoy, T. (2021). Renewable energy consumption, financial development, environmental pollution, and innovations in the ASEAN+ 3 group: Evidence from (P-ARDL) model. Renewable Energy, 165, 689–700.
- Bekhet, H. A., Matar, A., & Yasmin, T. (2017). CO2 emissions, energy consumption, economic growth, and financial development in GCC countries: Dynamic simultaneous equation models. Renewable and Sustainable Energy Reviews, 70, 117–132.
- Belaïd, F., & Zrelli, M. H. (2019). Renewable and non-renewable electricity consumption, environmental degradation and economic development: Evidence from Mediterranean countries. Energy Policy, 133, 110929.
- Bhat, J. A. (2018). Renewable and non-renewable energy consumption – Impact on economic growth and CO2 emissions in five emerging market economies. Environmental Science and Pollution Research International, 25(35), 35515–35530.
- Bhattacharya, M., Churchill, S. A., & Paramati, S. R. (2017). The dynamic impact of renewable energy and institutions on economic output and CO2 emissions across regions. Renewable Energy, 111, 157–167.
- Bölük, G., & Mert, M. (2014). Fossil & renewable energy consumption, GHGs (greenhouse gases) and economic growth: Evidence from a panel of EU (European Union) countries. Energy, 74, 439–446.
- Cai, Y., Sam, C. Y., & Chang, T. (2018). Nexus between clean energy consumption, economic growth and CO2 emissions. Journal of Cleaner Production, 182, 1001–1011.
- Charfeddine, L., & Kahia, M. (2019). Impact of renewable energy consumption and financial development on CO2 emissions and economic growth in the MENA region: A panel vector autoregressive (PVAR) analysis. Renewable Energy, 139, 198–213.
- Chien, T., & Hu, J.-L. (2007). Renewable energy and macroeconomic efficiency of OECD and non-OECD economies. Energy Policy, 35(7), 3606–3615.
- Choi, I. (2001). Unit root tests for panel data. Journal of International Money and Finance, 20(2), 249–272.
- Dai, H., Xie, X., Xie, Y., Liu, J., & Masui, T. (2016). Green growth: The economic impacts of large-scale renewable energy development in China. Applied Energy, 162, 435–449.
- Destek, M. A., & Sarkodie, S. A. (2019). Investigation of environmental Kuznets curve for ecological footprint: The role of energy and financial development. The Science of the Total Environment, 650(Pt 2), 2483–2489.
- Dogan, E., & Seker, F. (2016). The influence of real output, renewable and non-renewable energy, trade and financial development on carbon emissions in the top renewable energy countries. Renewable and Sustainable Energy Reviews, 60, 1074–1085.
- Dumitrescu, E.-I., & Hurlin, C. (2012). Testing for Granger non-causality in heterogeneous panels. Economic Modelling, 29(4), 1450–1460.
- Eberhardt, M., & Bond, S. (2009). Cross-section dependence in nonstationary panel models: A novel estimator. https://mpra.ub.uni-muenchen.de/id/eprint/17692
- Fang, Y. (2011). Economic welfare impacts from renewable energy consumption: The China experience. Renewable and Sustainable Energy Reviews, 15(9), 5120–5128.
- Frondel, M., Ritter, N., Schmidt, C. M., & Vance, C. (2010). Economic impacts from the promotion of renewable energy technologies: The German experience. Energy Policy, 38(8), 4048–4056.
- Ganda, F. (2019). The impact of innovation and technology investments on carbon emissions in selected organisation for economic co-operation and development countries. Journal of Cleaner Production, 217, 469–483.
- Grossman, G. M., & Krueger, A. B. (1991). Environmental Impacts of a North American Free Trade Agreement [Working paper No. 3914]. National Bureau of Economic Research Cambridge, Mass., USA.
- Inglesi-Lotz, R. (2016). The impact of renewable energy consumption to economic growth: A panel data application. Energy Economics, 53, 58–63.
- Ito, K. (2017). CO2 emissions, renewable and non-renewable energy consumption, and economic growth: Evidence from panel data for developing countries. International Economics, 151, 1–6.
- Jebli, B., Youssef, B., & Ozturk, I. (2016). Testing environmental Kuznets curve hypothesis: The role of renewable and non-renewable energy consumption and trade in OECD countries. Ecological Indicators, 60, 824–831.
- Khan, M. K., Teng, J.-Z., Khan, M. I., & Khan, M. O. (2019). Impact of globalization, economic factors and energy consumption on CO = emissions in Pakistan. Science of the Total Environment, 688, 424–436.
- Khan, M. T. I., Yaseen, M. R., & Ali, Q. (2017). Dynamic relationship between financial development, energy consumption, trade and greenhouse gas: Comparison of upper middle income countries from Asia, Europe, Africa and America. Journal of Cleaner Production, 161, 567–580.
- Kihombo, S., Vaseer, A. I., Ahmed, Z., Chen, S., Kirikkaleli, D., & Adebayo, T. S. (2022). Is there a tradeoff between financial globalization, economic growth, and environmental sustainability? An advanced panel analysis. Environmental Science and Pollution Research, 29(3), 3983–3993.
- Kong, Y., & Khan, R. (2019). To examine environmental pollution by economic growth and their impact in an environmental Kuznets curve (EKC) among developed and developing countries. PLoS One, 14(3), e0209532.
- Kouhizadeh, M., Zhu, Q., & Sarkis, J. (2020). Blockchain and the circular economy: Potential tensions and critical reflections from practice. Production Planning & Control, 31(11-12), 950–966.
- Le Quéré, C., Jackson, R., Jones, M., Smith, A., Abernethy, S., Andrew, R., De-Gol, A., Willis, D., Shan, Y., Canadell, J., Friedlingstein, P., Creutzig, F., & Peters, G. (2020). Temporary reduction in daily global CO2 emissions during the COVID-19 forced confinement. Nature Climate Change, 10(7), 647–653.
- Lee, J. W., & Brahmasrene, T. (2013). Investigating the influence of tourism on economic growth and carbon emissions: Evidence from panel analysis of the European Union. Tourism Management, 38, 69–76.
- Marques, A. C., & Fuinhas, J. A. (2012). Is renewable energy effective in promoting growth? Energy Policy, 46, 434–442.
- Mathiesen, B. V., Lund, H., & Karlsson, K. (2011). 100% renewable energy systems, climate mitigation and economic growth. Applied Energy, 88(2), 488–501.
- Menyah, K., & Wolde-Rufael, Y. (2010). CO2 emissions, nuclear energy, renewable energy and economic growth in the US. Energy Policy, 38(6), 2911–2915.
- Nasreen, S., Anwar, S., & Ozturk, I. (2017). Financial stability, energy consumption and environmental quality: Evidence from South Asian economies. Renewable and Sustainable Energy Reviews, 67, 1105–1122.
- Newell, R., Raimi, D., & Aldana, G. (2019). Global energy outlook 2019: The next generation of energy. Resources for the Future, 1, 8–19. https://media.rff.org/documents/GEO_Report_8-22-19.pdf
- Newey, W. K., & West, K. D. (1994). Automatic lag selection in covariance matrix estimation. The Review of Economic Studies, 61(4), 631–653.
- Ozturk, I. (2010). A literature survey on energy–growth nexus. Energy Policy, 38(1), 340–349.
- Ozturk, I., & Acaravci, A. (2010). CO2 emissions, energy consumption and economic growth in Turkey. Renewable and Sustainable Energy Reviews, 14(9), 3220–3225.
- Ozturk, I., & Bilgili, F. (2015). Economic growth and biomass consumption nexus: Dynamic panel analysis for Sub-Sahara African countries. Applied Energy, 137, 110–116.
- Payne, J. E. (2010). A survey of the electricity consumption-growth literature. Applied Energy, 87(3), 723–731.
- Payne, J. E. (2011). On biomass energy consumption and real output in the US. Energy Sources, Part B: Economics, Planning, and Policy, 6(1), 47–52.
- Persyn, D., & Westerlund, J. (2008). Error-correction–based cointegration tests for panel data. The Stata Journal: Promoting Communications on Statistics and Stata, 8(2), 232–241.
- Pesaran, M. H. (2006). Estimation and inference in large heterogeneous panels with a multifactor error structure. Econometrica, 74(4), 967–1012.
- Pesaran, M. H. (2007). A simple panel unit root test in the presence of cross‐section dependence. Journal of Applied Econometrics, 22(2), 265–312.
- Pesaran, M. H. (2021). General diagnostic tests for cross-sectional dependence in panels. Empirical Economics, 60(1), 13–50.
- Petroleum, B. (2019). BP statistical review of world energy report. BP, London, UK.
- Qayyum, U., Anjum, S., & Sabir, S. (2021). Armed conflict, militarization and ecological footprint: Empirical evidence from South Asia. Journal of Cleaner Production, 281, 125299.
- Rafindadi, A. A., & Ozturk, I. (2017). Impacts of renewable energy consumption on the German economic growth: Evidence from combined cointegration test. Renewable and Sustainable Energy Reviews, 75, 1130–1141.
- Rauf, A., Liu, X., Amin, W., Ozturk, I., Rehman, O. U., & Hafeez, M. (2018). Testing EKC hypothesis with energy and sustainable development challenges: A fresh evidence from belt and road initiative economies. Environmental Science and Pollution Research International, 25(32), 32066–32080.
- Saidi, K., & Mbarek, B. (2016). Nuclear energy, renewable energy, CO2 emissions, and economic growth for nine developed countries: Evidence from panel Granger causality tests. Progress in Nuclear Energy, 88, 364–374.
- Saidi, K., & Omri, A. (2020). The impact of renewable energy on carbon emissions and economic growth in 15 major renewable energy-consuming countries. Environmental Research, 186, 109567.
- Salahuddin, M., Gow, J., & Ozturk, I. (2015). Is the long-run relationship between economic growth, electricity consumption, carbon dioxide emissions and financial development in Gulf Cooperation Council countries robust? Renewable and Sustainable Energy Reviews, 51, 317–326.
- Salahuddin, M., Habib, M. A., Al-Mulali, U., Ozturk, I., Marshall, M., & Ali, M. I. (2020). Renewable energy and environmental quality: A second-generation panel evidence from the Sub Saharan Africa (SSA) countries. Environmental Research, 191, 110094.
- Saqib, M., & Benhmad, F. (2021). Does ecological footprint matter for the shape of the environmental Kuznets curve? Evidence from European countries. Environmental Science and Pollution Research International, 28(11), 13634–13648.
- Saqib, N. (2018). Greenhouse gas emissions, energy consumption and economic growth: Empirical evidence from gulf cooperation council countries. International Journal of Energy Economics and Policy, 8(6), 392–400.
- Saqib, N. (2021). Energy consumption and economic growth: Empirical evidence from MENA region. International Journal of Energy Economics and Policy, 11(6), 191–197.
- Saud, S., Chen, S., & Haseeb, A. (2020). The role of financial development and globalization in the environment: Accounting ecological footprint indicators for selected one-belt-one-road initiative countries. Journal of Cleaner Production, 250, 119518.
- Shahbaz, M., Lean, H. H., & Shabbir, M. S. (2012). Environmental Kuznets curve hypothesis in Pakistan: Cointegration and Granger causality. Renewable and Sustainable Energy Reviews, 16(5), 2947–2953.
- Sharif, A., Mishra, S., Sinha, A., Jiao, Z., Shahbaz, M., & Afshan, S. (2020). The renewable energy consumption-environmental degradation nexus in Top-10 polluted countries: Fresh insights from quantile-on-quantile regression approach. Renewable Energy, 150, 670–690.
- Sohag, K., Chukavina, K., & Samargandi, N. (2021). Renewable energy and total factor productivity in OECD member countries. Journal of Cleaner Production, 296, 126499.
- Tamazian, A., Chousa, J. P., & Vadlamannati, K. C. (2009). Does higher economic and financial development lead to environmental degradation: Evidence from BRIC countries. Energy Policy, 37(1), 246–253.
- Taşkın, A., & Demir, N. (2020). Life cycle environmental and energy impact assessment of sustainable urban municipal solid waste collection and transportation strategies. Sustainable Cities and Society, 61, 102339.
- Tugcu, C. T., Ozturk, I., & Aslan, A. (2012). Renewable and non-renewable energy consumption and economic growth relationship revisited: Evidence from G7 countries. Energy Economics, 34(6), 1942–1950.
- Udemba, E. N. (2020). A sustainable study of economic growth and development amidst ecological footprint: New insight from Nigerian perspective. Science of the Total Environment, 732, 139270.
- Ulucak, R. (2020). How do environmental technologies affect green growth? Evidence from BRICS economies. Science of the Total Environment, 712, 136504.
- Ulucak, R., & Khan, S. U.-D. (2020). Determinants of the ecological footprint: Role of renewable energy, natural resources, and urbanization. Sustainable Cities and Society, 54, 101996.
- Usman, M., Khalid, K., & Mehdi, M. A. (2021). What determines environmental deficit in Asia? Embossing the role of renewable and non-renewable energy utilization. Renewable Energy, 168, 1165–1176.
- Usman, M., Kousar, R., & Makhdum, M. S. A. (2020). The role of financial development, tourism, and energy utilization in environmental deficit: Evidence from 20 highest emitting economies. Environmental Science and Pollution Research International, 27(34), 42980–42995.
- Usman, M., & Makhdum, M. S. A. (2021). What abates ecological footprint in BRICS-T region? Exploring the influence of renewable energy, non-renewable energy, agriculture, forest area and financial development. Renewable Energy, 179, 12–28.
- Usman, M., Makhdum, M. S. A., & Kousar, R. (2021). Does financial inclusion, renewable and non-renewable energy utilization accelerate ecological footprints and economic growth? Fresh evidence from 15 highest emitting countries. Sustainable Cities and Society, 65, 102590.
- Usman, M., Yaseen, M. R., Kousar, R., & Makhdum, M. S. A. (2021). Modeling financial development, tourism, energy consumption, and environmental quality: Is there any discrepancy between developing and developed countries? Environmental Science and Pollution Research International, 28(41), 58480–58501.
- Wang, J., & Dong, K. (2019). What drives environmental degradation? Evidence from 14 Sub-Saharan African countries. Science of the Total Environment, 656, 165–173.
- Westerlund, J. (2007). Testing for error correction in panel data. Oxford Bulletin of Economics and Statistics, 69(6), 709–748.
- Yang, B., Usman, M., & jahanger, A. (2021). Do industrialization, economic growth and globalization processes influence the ecological footprint and healthcare expenditures? Fresh insights based on the STIRPAT model for countries with the highest healthcare expenditures. Sustainable Production and Consumption, 28, 893–910.
- Zafar, M. W., Shahbaz, M., Hou, F., & Sinha, A. (2019). From nonrenewable to renewable energy and its impact on economic growth: The role of research & development expenditures in Asia-Pacific Economic Cooperation countries. Journal of Cleaner Production, 212, 1166–1178.
- Zhu, N., Zhang, D., Wang, W., Li, X., Yang, B., Song, J., Zhao, X., Huang, B., Shi, W., Lu, R., Niu, P., Zhan, F., Ma, X., Wang, D., Xu, W., Wu, G., Gao, G., & Tan, W. (2020). A novel coronavirus from patients with pneumonia in China, 2019. New England Journal of Medicine, 382(8), 727–733.