
 ?Mathematical formulae have been encoded as MathML and are displayed in this HTML version using MathJax in order to improve their display. Uncheck the box to turn MathJax off. This feature requires Javascript. Click on a formula to zoom.
Abstract
Green finance is an effective means adopted by the Chinese government to reduce carbon emissions. Does the development of green finance in Chinese provinces reduce carbon emissions to a certain extent? This study selects panel data of various provinces and cities in China from 2003 to 2019. Based on the Hansen threshold regression model, an empirical analysis is conducted with economic growth and industrial structure as threshold variables to test the impact of green finance on carbon emissions. The results show that green finance increases the speed of carbon emission mitigation when PGDP is the threshold. Taking industrial structure as the threshold, the impact of green finance development on carbon emissions presents an inverted N shape. At the same time, it is found that green finance has become an important means to reduce carbon emissions in the eastern region, the impact of green finance on carbon emissions in the central region presents an inverted U shape, and the driving force of green finance on carbon emission reduction in the western region is weak. Furthermore, it is pointed out that improving the quality of green finance and enhancing the level of green finance empowered by science and technology are the keys to realizing sustainable green development.
1. Introduction
The COVID-19 pandemic in 2020 has caused incalculable losses to the world's social, economic and natural environment, as well as the financial sector (Mirza et al., Citation2020b; Rizvi et al., Citation2020a), resulting in a series of consequences such as financial market volatility, asset depreciation, and financing difficulties of enterprises (Li et al., Citation2020; Mirza et al., Citation2020a; Citation2022; Umar et al., Citation2021; Yarovaya et al., Citation2021). People further realize the importance of a healthy ecological environment for human survival; therefore, there is a consensus to promote green development and harmonious coexistence between humans and nature; therefore, society is facing a transition to green development (Ji et al., Citation2021; Rizvi et al., Citation2020b). Finance, as the ‘chief scheduler’ of resources in the economic and social system, can effectively coordinate the allocation of resources in various fields to promote social development (Arestis & Demetriades, Citation1997), but it is also an important driving factor for the increase in carbon emissions, which to some extent restricts regional green development (Dorfleitner & Grebler, Citation2022; Zhang, Citation2011).
Because capital is ‘profit-seeking’, while green projects generally have strong positive externalities that bring benefits to economic and social life, the profits of the financial industry do not increase due to such positive externalities, resulting in a large funding gap for local green development (Linnenluecke et al., Citation2016). Therefore, to expand investment, improve the ecological benefits of financing and achieve sustainable development goals, it is necessary to adopt new financial instruments and policies, such as green bonds, green funds, green banks, carbon-trading markets, fiscal policies and fin-tech, collectively known as ‘Green Finance’ (Berensmann & Lindenberg, Citation2019). Different from traditional finance, green finance, also known as environmental finance or sustainable finance, is a financial tool to improve environmental quality and transfer environmental risks (Zerbib, Citation2019). It is a great innovation in the financial industry, which plays a key role in balancing economic development and the climate environment (Naqvi et al., Citation2021; Sachs et al., Citation2019).
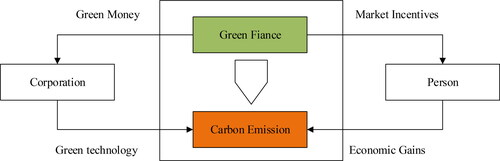
China is the world's 2nd largest economy, and its carbon emission volume ranks first in the world, which has a great impact on global climate change and threatens its own sustainable development. Balancing economic growth and carbon emissions has become an urgent problem to be solved. ‘Carbon peak and carbon neutral’ is a major policy decision and deployment proposed by the Chinese government on global climate deterioration during the transition period from the 13th Five-year Plan to the 14th Five-year Plan. This reflects the Chinese government's responsibility in addressing global climate change. ‘Carbon peak and carbon neutral’ is both an opportunity and a challenge for China's development and will have a far-reaching impact on China's economic structure, energy structure, production and consumption patterns and other aspects (Liang,Wei,Li et al., Citation2020; Liang et al., Citation2020; Hasnaoui et al., Citation2021). Over the next 30 years, achieving ‘carbon peak and carbon neutral’ will require massive investment. Although the existing forecast results are different, all investment scales are expected to exceed 100 trillion RMB. Therefore, the future development of green finance will have an increasingly important impact on the climate environment, especially carbon emissions ().
Figure 1. Mechanism of green finance and carbon emissions.
Source: Authors.
2. Literature review
Different from traditional finance, green finance is also called environmental finance or sustainable finance. It was proposed against a background of the escalating contradiction between energy consumption and green development in the process of economic growth (Salazar, Citation1998). The People's Bank of China defined green finance as financial services for economic activities such as improving the environment, coping with climate change, and saving and efficiently utilizing resources. Green finance is a great innovation in the financial industry that plays a key role in balancing economic development and the ecological environment. It enables people to re-examine the development of modern financial systems from a perspective of finance and the environment.
After decades of development, green finance theory has generally formed three kinds of views. The first kind of view is embodied in the instrument level of financial application. It holds that green finance is an innovative financial tool provided by the government and financial institutions to solve environmental problems, which is used to improve the ecological environment, reduce pollution, save energy and provide personalized financial services for green development (Cowan, Citation1999; Labatt & White, Citation2002). This view was generated in the early stage of green finance theory. The research mainly focused on green insurance, green securities, green credit, green funds and other financial products and their effects and constructed an indicator system of the green finance development level based on the transaction volume of such products (Aizawa & Yang, Citation2010; Yu et al., Citation2022). The second type of view is at the top-down strategic level. Green finance should comply with environmental, social and governance (ESG) standards (Busch et al., Citation2016; Dyllick & Hockerts, Citation2002) and should be incorporated into the government, financial institutions and enterprises to formulate sustainable development policies, upgrade financial services, and develop green investment products and financial strategies (Scholtens, Citation2006; Umar et al., Citation2021; Weber, Citation2012). By using institutional text data, financial data, and enterprise financial data, a green finance indicator system should be built (Fatemi & Fooladi, Citation2013; Umar et al., Citation2021). The third kind of view is from the bottom-up behavioral perspective. With the enhancement of public awareness of environmental protection and the improvement of environmental protection laws and regulations, economic development gradually enters the ‘deep green’ state, and green finance starts to be driven by the public spontaneously, forming pro-environmental preferences, and capital flows to green products and green industries. This kind of green behavior affects the green transformation of the whole financial system and promotes the green development of the economy ( Linnenluecke et al., Citation2016; Zerbib, Citation2019; Umar, Ji, Mirza, Naqvi et al., Citation2021 ). In this context, scholars place more emphasis on the green contribution of the financial system and to the development of the green economy (Berensmann & Lindenberg, Citation2019; Kaiser & Welters, Citation2019). Lv et al. (Citation2021) pointed out that if the indicator system of the efficiency of financial green development is only constructed from the perspective of green financial capital input, the green function of the financial system will be ignored. Therefore, it is necessary to include a wider range of financial development data, and at the same time, it is necessary to consider unexpected outputs such as ecological environmental pollution. Based on this point of view, this paper constructs and improves the indicator system of green finance development efficiency.
Green finance mainly reduces carbon emissions through green project financing and carbon market trading. On the one hand, green finance provides funds for green environmental protection projects through green financial policies and the issuance of green bonds, reducing the financing costs and transaction costs of green environmental protection projects, which not only helps to improve the conversion efficiency of green environmental protection projects and promote the progress of green technology but also effectively reduces carbon emissions (Hartzmark & Sussman, Citation2019; Heine et al., Citation2019). Sartzetakis (Citation2021) believed that green bonds could serve as an important signal of a company's environmental friendliness and stimulate investor enthusiasm for investment in the stock market to continuously improve the company's environmental benefits and contribute to reducing carbon emissions. On the other hand, a carbon-trading market based on a carbon emission quota can effectively reduce the carbon emissions of enterprises and individuals through policy and economic means. First, the competent department of carbon trading allocates carbon emission quotas to relevant enterprises with emission reduction obligations through legal means to limit the carbon emissions of enterprises (Wang et al., Citation2019). Second, enterprise carbon emission quotas that cannot be used can be sold on the carbon-trading market; therefore, economic incentives encourage enterprises to continue to reduce carbon emissions by scientific and technological innovation, forming a virtuous cycle (Chen et al., Citation2020; Lobato et al., Citation2021). Finally, individuals can also sell personal-saving carbon emissions to enterprises through the carbon-trading market to improve citizen consciousness of carbon emission reduction and reduce carbon emissions for society as a whole. Weng and Xu (Citation2018) believed that the formation of China's carbon-trading market can effectively reduce carbon emissions. Chen and Lin (Citation2021) believed that the carbon emission-trading mechanism can be used as an important market-oriented environmental policy tool to reduce carbon emissions.
The extant literature on this topic has laid a solid foundation, but there is still a lack in regard to three aspects. One is that the green financial support for the strength of green low carbon transformation development for enterprises is not enough, and the green financial support system has yet to catch up with the ‘double carbon’ vision to realize the strong demand around the ‘double carbon’ vision of the green financial support system of follow-up studies. Second, there have been many theoretical studies on the relationship between green finance and carbon emissions, but due to the lack of statistical data on carbon emissions, there have been few empirical studies on the impact of green finance on carbon emissions. Third, there is no mature comprehensive index to measure the development level of green finance. Therefore, based on the impact mechanism of green finance on carbon emissions, this study adopts the current mature calculation model of carbon emissions, uses panel data of provinces and cities in China, and uses comprehensive indicators of green finance to empirically test the impact of green finance development on carbon emissions in China.
3. Model setting and indicator description
3.1. Threshold regression model
The ‘threshold effect’ occurs when one variable increases and its influence on another variable changes with its own change; then the critical value causing the change is the threshold value, which is called the threshold effect. To study the nonlinear relationship between green finance development and the carbon emission level, this paper utilizes GDP per capita and industrial structure as estimates. The nondynamic panel threshold regression model of Hansen (1999) is used to construct a segmented function, and ‘endogenous grouping’ is used to replace ‘exogenous grouping’, which is highly subjective. The threshold model is as follows:
(1)
(1)
In Formula (1), i is the region, t is the year, CEit is the level of financial development, and Xit is the set of control variables. This paper selects the influential factors that have a stable relationship with financial development, mainly including financial openness, trade openness TL, economic development level ED, capital stock CAPS, household consumption level HOUC, industrial structure IND, and human capital level HUMC. Additionally, GEit is green finance, Thrit is the threshold variable, and PGDP and IND are selected as the threshold variables in this paper. I(•) is the indicative function, εit is the random disturbance term, and ηi is the threshold value. ηi can take any value of Thrit and obtain the regression coefficients of other variables by the least square method (OLS) to obtain the square sum of residual S0 and select the minimum value of S0, i.e.,
3.2. Selection and description of indicators
3.2.1. Carbon emission index
The explained variable of this paper is carbon emissions (CE). Due to the lack of such data in the current statistical yearbook, this paper refers to the current mature measurement methods, selects the three types of energy consumption, electricity, natural gas and liquefied petroleum gas, in the statistical yearbook, and carries out the conversion in combination with the CO2 emission coefficient. The specific algorithm is shown in Formula (2), where CO2 represents carbon emissions; Ce, Cn and Cp are the carbon emissions calculated based on the consumption of electricity, natural gas and liquefied petroleum gas, respectively; Ee, En and Ep are the consumption of three kinds of energy; and φ is the GHG emission coefficient of the coal-powered fuel chain. Equivalent to 1.3023 kg/m3 kg/kW·h, η is the proportion of coal power generation to total power generation. where κ and γ are the CO2 emission coefficients of natural gas and LPG, respectively. It should be emphasized that although electric energy does not produce CO2 in the process of use, China's endowment characteristics of ‘rich in coal, poor in oil and little in gas’ and low coal price determine that thermal power generation is still the main source of China's carbon emissions, which are highly dependent on coal (Yu & Zhang, Citation2021).
(2)
(2)
3.2.2. Green financial indicators
The explanatory variable of this paper is green finance (GF). Green bonds are now used as proxy variables (Park, Citation2018; Sartzetakis, Citation2021), but the total amount of green credit only accounts for a part of green finance, and the overall development of green finance should also be considered. Therefore, green credit, green securities and green investment are taken as comprehensive indicators to measure the development of green finance, as shown in .
Table 1. Green finance indicator system.
To avoid the differences between units and magnitudes of FD data, the entropy weight method is adopted to standardize the synthesis of FD indicators. The specific formula is as follows:
(3)
(3)
In the formula, Max(xi) and Min(xi) are the maximum and minimum values of the order parameters, respectively. The value obtained after calculation by the formula represents the influence degree of each variable. The larger the value is, the greater the influence; otherwise, the smaller the influence. Then, each indicator is weighted to eliminate subjective factors and make indicators accurately reflect the degree of influence of variables and better reflect the degree of correlation between indicators. The entropy weight method is adopted in this study, and the formula is as follows:
(4)
(4)
(5)
(5)
Finally, for the parameter entropy (E1, E2…, Ek), the following formula is used to calculate the index weight:
(6)
(6)
3.2.3. Threshold variables and other control variables
The economy is the foundation of the development of the financial industry, and the industrial structure reveals the optimization degree of the supply side of regional development and can effectively guide the flow of local capital (Cheng et al., Citation2018; Dasgupta & Stiglitz, Citation1980). As a result, the threshold variables in this paper include the following: (1) economic development level (ED). In the economic growth system, the PGDP is representative and is the core index used to measure the level of regional economic growth. (2) Industrial structure (IND). The industrial structure of a country is closely related to carbon emissions, especially the secondary industry. Therefore, the proportion of industrial added value in the secondary industry to GDP is selected as the threshold variable to represent the development of industrial structure.
Regional differences in development modes, social resource endowment and green development environment all affect the flow of regional financial elements and the development of green finance. First, the import and export volume and FDI can reflect the degree of economic openness of the region, among which FDI and financial development can significantly improve the efficiency of regional capital allocation(Alfaro et al., Citation2004; Demena & Afesorgbor, Citation2020). Second, in terms of the level of social resources, regional human and material resources are effective support for local financial development. That is, finance can only improve the level of financial services to the real economy by transforming capital into fixed asset investment, and capital stock is an important indicator of capital transformation. As a result, the control variables selected in this paper include the following:
Financial openness (FO): The degree of financial openness is considered from the perspective of actual capital flows. This paper draws on the research conclusions of Zhang Chengsi et al. and uses the nominal total FDI of each province for standardized treatment to express the degree of financial openness.
Trade openness (TL): Referring to academic standards, the nominal total amount of import and export trade of each province is used, and the entropy method is used for standardization processing to indicate the degree of trade openness.
Human capital (HUMC): Using the algorithm of Barro and Lee (Citation1993) for reference, the stock of human capital in each province is calculated according to the level of education.
Capital stock (CAPS): The calculation method of Hao (2008) is adopted and extended to 2019. The specific formula is:
(7)
(7)
In Formula (3), is the capital stock in region i in year t,
is the investment growth in region i in year t, and δ is the depreciation rate of capital stock.
The STI is generally regarded as the basic index system construction standard by measuring STI input and STI output, as shown in .
Table 2. STI index system.
4. Empirical analysis and conclusions
4.1. Threshold existence test
According to the research method mentioned above, panel data of Chinese provinces from 2003 to 2019 were adopted, and the threshold model was estimated by the STATA13.0 research method. The threshold value and P value were obtained by the bootstrap method 1000 times. shows the results of the threshold existence test in the whole country and the eastern, central and western regions. shows the empirical results of the impact of green finance on carbon emissions with PGDP and IND as threshold variables.
Table 3. Tests of thresholds for the whole country and subregions.
Table 4. Threshold estimates and confidence intervals.
The results in show that both the whole country and different regions have passed the triple threshold test, and with the development of the regional economy and the change in industrial structure, there is a significant nonlinear relationship between green finance and carbon emissions.
4.2. Empirical analysis at the national level
Furthermore, with PGDP and industrial structure as threshold variables, triple threshold regression is conducted, and the results are shown in . Taking PGDP as the threshold variable, from the national level, although China's economic growth is strongly correlated with the development level of green finance, the influence coefficient is small. Industrial structure has a strong positive impact on carbon emissions under different threshold variables. The reason for this is that China's industrial development level continues to improve, and industry is an important field of carbon emissions, accounting for approximately 70% of the total carbon emissions and leading to high carbon emissions in China. It is worth noting that human capital has an obvious negative correlation with carbon emissions in China because human capital reflects the overall cultural quality of people, and high-quality talent tends to flock to high-tech industries, which is conducive to reducing the overall carbon emissions. At the same time, with the improvement of people's cultural quality, it will be easier to accept and advocate the concept of a low-carbon life, which will also help reduce carbon emissions. There is a positive correlation between resident consumption levels and carbon emissions. However, this paper argues that this cannot mean that the improvement of resident consumption levels hinders carbon emission reduction because with the improvement of resident levels, their material demand is increasing, which inevitably increases the consumption of resources, which undoubtedly increases carbon emissions to a certain extent. However, with the further improvement of resident consumption levels, they will inevitably give more attention to environmental protection and increase their consumption of green products. The continuous increase in capital stock will improve the level of infrastructure nationwide, increase social welfare, and promote the overall development of the social economy. The analytical results show a negative correlation, but they have a certain inhibitory effect on carbon emissions. The degree of financial openness will increase carbon emissions to a certain extent because the influx of foreign capital through FDI will transfer carbon emissions from developed regions to China and increase the level of carbon emissions in China, which is consistent with the conclusion of Liu et al. (Citation2021)Liu et al. (Citation2021). China's foreign trade restrains carbon emissions to some extent, especially in the eastern region, which is consistent with the conclusion of Zhang et al. (Citation2018).
Table 5. Regression results at the whole country level.
Green finance has an obvious nonlinear impact on carbon emissions, which is verified by the results shown in . This shows that the continuous implementation of green finance policies in China promotes the innovation of green finance products and services, improves the efficiency of green finance, and promotes the overall development of green finance. The improvement of green finance provides financial support for green projects, reduces the application cost of green technologies to a certain extent, and effectively promotes carbon reduction. However, under the influence of different threshold variables, the impact of green finance on carbon reduction is slightly different, and the marginal effect tends to decrease with the improvement of the economic level. Under the threshold of industrial structure, the trend of change is more complex, and there is an inverted N-shaped trend of rising first, then falling and then rising.
Taken as the threshold, when PGDP is less than 7686 yuan, green finance has the greatest impact on carbon emissions, with the absolute value of the coefficient being 1.21, and then decreases step by step under each threshold value, with a relatively stable decline rate. This indicates that green finance will reduce carbon emissions to a large extent in the case of a low level of economic development. This is because at a lower level of economic development, it is more difficult to finance green projects and green technologies, and the support effect of green finance on green projects and green technologies is more significant, with a greater influence coefficient on carbon emissions. However, with the further development of the economy, other factors affecting carbon emissions are also emerging. For example, social capital will also flood into environmentally friendly enterprises or projects, which will weaken the impact and lead to diminishing marginal effects. Under the IND threshold test, the impact of green finance on carbon emissions shows an inverted N shape. Under the first threshold value, the absolute value of the influence coefficient decreases from 1.13 to 1.04 when the proportion of industrial growth transitions from 0.42 to 0.45. After surpassing the second threshold, the absolute value of the influence coefficient increases to 1.23, but after surpassing the third threshold, it decreases to the level of 1.03.
Looking at the panel data of all provinces and cities from 2003 to 2019, it can be clearly seen that, at the beginning of the investigation period, the improvement of industrialization stimulated the development of the overall economy. However, its industrial technology level was low, which was not enough to support China's green and sustainable development. Therefore, the eastern region, represented by the eastern Yangtze River Delta region, gradually reduced the proportion of secondary industry by adjusting its industrial structure and improved its scientific and technological content, which had a more obvious promoting effect on carbon emission reduction and finally formed an inverted N-type influence model of the relationship between the two regions.
4.3. Comparative analysis by region
Due to different development scenarios in different regions of China, it is necessary to further analyze the relationship between green finance and carbon emissions in different regions. Based on the practice of China's National Bureau of Statistics and extant research, this paper divides China into three regions: the eastern, the central and the western regions. The eastern region includes 11 provinces (including municipalities directly under the central government): Beijing, Tianjin, Hebei, Liaoning, Shanghai, Jiangsu, Zhejiang, Fujian, Shandong, Guangdong and Hainan. The central part consists of eight provinces: Heilongjiang, Jilin, Shanxi, Anhui, Jiangxi, Henan, Hubei and Hunan. The western region comprises 12 provinces (including autonomous regions and municipalities): Inner Mongolia, Guangxi, Chongqing, Sichuan, Guizhou, Yunnan, Tibet, Shaanxi, Gansu, Qinghai, Ningxia and Xinjiang. (Démurger et al., Citation2002; Song & van Geenhuizen, Citation2014; Su et al., Citation2021). The threshold test results based on PER capita GDP and IND of industrial structure are shown in and . 在绿色金融对碳排放影响的基准回归结果检验中, Hausmen检验的p值为0.821,在1%的水平下, adj_Rsqr的拟合度较好, 所以选取固定效应对模型进行回归分析是合理的。
Table 6. Interregional comparison based on PGDP as the threshold variable.
Table 7. Comparison between regions based on IND as the threshold variable.
As seen from and 7, green finance and carbon emission levels in eastern China have entered a virtuous cycle stage. First, when economic development is taken as the threshold variable, the impact of green finance on carbon emissions does not show a trend of marginal decline, and the absolute value of the coefficient gradually increases. Correspondingly, when the industrial structure is taken as the threshold variable, the impact of green finance on carbon emissions is also negatively correlated, and the degree of negative correlation is increasing, which is related to the industrial development concept of downstream regions. For example, Shanghai, located in the eastern region, belongs to the typical export-oriented economy. Since 2008, its secondary industry proportion has been declining, and green finance has received great attention and high-speed development. At the same time, the scientific and technological innovation level of Shanghai was also high; these factors above all ensure its green finance and benign fusion of carbon emissions. Other eastern regions have also invested a large amount of green funds in the field of scientific and technological innovation, promoting the iteration of industrial technology. The rapid development of inclusive finance and digital finance has greatly improved the development quality of green finance. Furthermore, the eastern region also gives attention to improving industrial technology. The income of high technology industry accounted for 76.7% of the eastern Yangtze River Delta region in 2019, providing a large amount of return on investment to green finance. Therefore, under the premise of the value increase of the eastern regional industrial structure, the green financial impact on carbon emission reduction is still positive, forming a benign circulation pattern.
On the basis of the continuous improvement of the economic level in the central region, the impact of green finance on carbon emissions shows an inverted U-shaped trend of rising first and falling after. When per capita GDP surpassed the first threshold value of 5097.25, the absolute value of the impact coefficient jumped from 0.85 to 1.05, with a large increase. However, after surpassing the threshold, the elastic coefficient continued to decline, and after surpassing the third threshold value of 16780.36, the absolute value of the elastic coefficient decreased to 0.70. The reason for this is that although there are many universities and scientific research institutions in the central region, the total number of R&D personnel is only 40% of that in the eastern region. Another reason is the loss of scientific and technological resources such as high-tech talent; as a result, scientific and technological finance, high-end technology, and green finance make little contribution to carbon emission reduction. In addition, in the test of IND as the threshold variable of industrial structure, the impact of green finance on carbon emissions also shows an inverted U shape. The reason for this is that since the adjustment of the industrial structure in the eastern region, the central region has taken over most of the traditional industries. Although it has stimulated the local economy for a period of time, in the long run, it does not have the potential for sustainable development, and the impact of green finance on carbon emission reduction cannot maintain a good momentum.
The situation in the western region is more complicated. In the threshold test of per capita GDP, the marginal utility of green finance's impact on emission reduction is increasing, and the absolute value of the coefficient increases obviously with each threshold crossed. In the study period, the rate increased from 1.19 in the first stage to 2.00 in the fourth stage, which is sufficient to verify the strong positive externality of green finance on carbon emission reduction. However, under the action of the threshold of industrial structure, it demonstrates an N-shaped trend of rising first, then falling and rising again. Considering Sichuan and Shaanxi as representative western regions, in recent years, economic growth has been more remarkable. Especially thanks to China's implementation of the ‘Belt and Road’ strategy, the overall driving influence of the western region is greater.
In conclusion, when PGDP is taken as the threshold variable, the marginal diminishing trend of the impact of national green finance on carbon emission reduction is obvious. In the eastern region, per capita GDP is at the highest level in the whole country, but there is no marginal diminishing effect of green finance on carbon emission reduction, which continually increases instead of decreases. The coefficient of green finance on carbon emission reduction in western China continues to rise at a low level of economic development, while the driving effect of green finance on carbon emission reduction in central China declines after crossing the second threshold. With IND as the threshold, green finance in eastern China can still play a significant role in promoting financial development when the proportion of added value of secondary industry decreases. The impact of green finance on carbon emission reduction in central China presents a typical inverted U-shaped structure. When the industrial structure reaches a certain threshold, the driving effect of green finance on carbon emission reduction gradually declines. In western China, the influence coefficient fluctuates, showing a dumbbell structure with high ends and a low middle. The comparison of specific coefficients and trends is shown in .
Table 8. Comparison of regional impact coefficients and trends.
Green finance has an obvious nonlinear impact on carbon emissions, which is verified by the results reflected in . This shows that with the improvement of the level of green finance, the application of green projects and green technologies not only promotes the innovation of green financial products and services and improves financial efficiency but also brings higher returns to green finance, forming a virtuous circle with the environment and promoting the green development of society. However, under the influence of different threshold variables, the impact of green finance on carbon emission reduction is slightly different, and the marginal effect tends to decrease with the improvement of the economic level. Under the background of the change in industrial structure, the trend of change is more complex, and there is an inverted N-shaped trend of first declining, then rising and then declining.
As seen from the threshold test of the national economic development level, when per capita GDP is less than 7686 yuan, green finance has the greatest impact on carbon emission reduction on this economic basis, with the absolute value of the coefficient being 1.21, and then decreases step by step under each threshold value with a relatively stable speed. This indicates that green finance has a more obvious effect on carbon emission reduction at a lower level of economic development. A large number of green projects and green technology are the key to financial support, and green technological innovation through the results of market transformation, not only by the high value of the product or technology back to green finance, can also produce high growth potential of intangible assets and environmentally friendly enterprises, greatly promoting carbon reduction and further strengthening the greenness, prosperity and development of the financial system. However, with the further development of the economy, other factors affecting carbon emission reduction are also emerging, or some original factors are gradually coming into play. In this case, the impact of green finance on carbon emission reduction will be relatively weakened, showing a marginal diminishing phenomenon.
Under the test of industrial structure as the threshold variable, the impact of green finance on carbon emission reduction shows an inverted N effect. In other words, when the proportion of industrial growth transitions from 0.42 to 0.45, the absolute value of the coefficient decreases from 1.32 to 1.04, but it rises to 1.23 after crossing this threshold. However, after the third threshold, it decreases to 1.03 again. Looking at the panel data of cities from 2003 to 2019, it can be clearly seen that at the beginning of the investigation period, the development level of green finance in China was low, the green capital investment of industrial enterprises was small, and green projects were difficult to implement. Therefore, when the proportion of secondary industry is also low, green finance has a greater impact on carbon emission reduction. With the increase in the proportion of secondary industry, the growth of the real economy can greatly increase carbon emissions. However, with the industrial transfer and optimization of industrial structure, although the proportion of secondary industry is declining, the increase in science and technology content is more obvious in promoting carbon emission reduction, thus forming an inverted N-shaped trend of the relationship between the two.
In this study, the following methods are used to test the robustness of the results. First, the lagging period of explanatory variables is included in the regression analysis table to replace the explanatory variables of the current period. The same method is used to replace the explained variables. Second, referring to the practices of relevant scholars (Liu et al., Citation2015; Sun et al., Citation2020), this paper estimated carbon emissions based on NPP-ViIRS nighttime light data within the administrative boundary and observed the fluctuations in coefficients by gradually introducing control variables. The comprehensive test results show that although the elastic coefficients of some variables fluctuate slightly, the signs and significance do not change much. Therefore, it is proven that the previous conclusions are relatively robust.
5. Conclusions and recommendations
From the perspective of green finance on carbon emissions, this paper analyzes the nonlinear development relationship between green finance and carbon emissions on the basis of national and regional economic growth and industrial structure. Based on the Hansen nondynamic panel threshold regression model, the impact of green finance on carbon emissions is empirically studied at the national level and in the eastern, central and western regions. Therefore, the following conclusions are drawn: Regardless of the threshold of economic growth or industrial structure, green finance has a significant impact on carbon emissions, but the impact trend is different in different regions. Eastern China has a high level of green finance and strong technological innovation capacity. Under the threshold variable, the promotion effect on carbon emission reduction will not weaken with the growth of the green finance scale, nor will the ‘marginal decline’ phenomenon occur. The level of scientific and technological innovation capacity in the central and western regions limits the promoting effect of green finance on carbon emission reduction. Under the threshold of economic growth and industrial structure, the weakening effect of green finance on carbon emissions decreases. Based on the empirical analysis, this paper holds that the ability of scientific and technological innovation is the key factor in achieving national and regional green development. The direction of scientific and technological innovation is always low-carbon, green and efficient. Of course, technological innovation has some insurmountable weaknesses, and it needs considerable capital to support it. How to use green finance to support scientific and technological innovation has become the key to achieving national and regional carbon emission reduction, which is related to the overall strategic situation of China in achieving a carbon peak and carbon neutrality. Therefore, based on the conclusion of this paper and the existing problems in national and regional development, we propose the following suggestions:
First, we should improve the traditional development model and foster a new one. By implementing the strategy of green development, the strengths of the eastern region in scientific research and human resources can be turned into a technology-driven booster to drive national development. At present, the volume of traditional production capacity accumulated for a long time in China is still very large. There are many risks, and a new mode of green and low-carbon development has not been formed; thus, the inertia of following the traditional development path is large. Therefore, we need to actively and steadily defuse old drivers of growth, completely abandon the old path of investment and input of factors of production, create conditions for new, green and low-carbon development, and eventually foster advanced production capacity. In the process of transforming the development model, it is necessary to raise the support of policy-based green finance and financial institutions by providing green financial products, lowering the financing threshold of high-tech industrial enterprises, increasing the participation of enterprises and social capital, and forming a long-term mechanism for energy conservation and emission reduction. Second, by giving full play to the financial resource allocation function through the green financial related government discount and preferential interest rates, capital markets, and the green channel, such as policies, we should guide and encourage more social funds into green industry and green technology fields such as technology innovation, thus raising the ability of fund raising in this field. Third, the carbon market system should be improved, gradually tightening the total amount of carbon emission quota, increasing the proportion of paid distribution, setting up a flexible mechanism and other measures to help the reasonable pricing of carbon quota, promoting green and low-carbon enterprises to obtain additional benefits of emission reduction, and promoting the healthy and high-quality development of carbon and market. Fourth, we should explore a green insurance system that matches green and low-carbon transformation. The accumulation of data related to green insurance should be improved by improving the coverage of green insurance products. We will formulate standards for risk assessment and risk control services in key industries and carry out differentiated pricing. Insurance solutions for adapting to green development should be provided, supporting environmental improvement, coping with climate change and promoting the efficient and economic use of resources. Fifth, scientific and technological innovation can empower the development of green finance and adjust regional differences. The development of technology can promote the improvement of total factor productivity and help to form the internal motivation of high-quality development, eventually realizing three goals—narrowing the economic gap between the eastern, central and western regions; adjusting the unbalanced development state; and finally realizing green and high-quality development at the national level.
Disclosure statement
No potential conflict of interest was reported by the authors.
Additional information
Funding
References
- Aizawa, M., & Yang, C. (2010). Green credit, green stimulus, green revolution? China’s mobilization of banks for environmental cleanup. The Journal of Environment & Development, 19(2), 119–144.
- Alfaro, L., Chanda, A., Kalemli-Ozcan, S., & Sayek, S. (2004). FDI and economic growth: The role of local financial markets. Journal of International Economics, 64(1), 89–112. https://doi.org/10.1016/S0022-1996(03)00081-3
- Arestis, P., & Demetriades, P. (1997). Financial development and economic growth: Assessing the evidence. The Economic Journal, 107(442), 783–799. https://doi.org/10.1111/j.1468-0297.1997.tb00043.x
- Barro, R. J., & Lee, J. W. (1993). International comparisons of educational attainment. Journal of Monetary Economics, 32(3), 363–394.
- Berensmann, K., & Lindenberg, N. (2019). Green finance: Across the Universe. In Corporate social responsibility, ethics and sustainable prosperity (pp. 305–332): World Scientific.
- Busch, T., Bauer, R., & Orlitzky, M. (2016). Sustainable development and financial markets: Old paths and new avenues. Business & Society, 55(3), 303–329. https://doi.org/10.1177/0007650315570701
- Chen, T., Dong, H., & Lin, C. (2020). Institutional shareholders and corporate social responsibility. Journal of Financial Economics, 135(2), 483–504. https://doi.org/10.1016/j.jfineco.2019.06.007
- Cheng, Z., Li, L., & Liu, J. (2018). Industrial structure, technical progress and carbon intensity in China's provinces. Renewable and Sustainable Energy Reviews, 81, 2935–2946. https://doi.org/10.1016/j.rser.2017.06.103
- Chen, X., & Lin, B. (2021). Towards carbon neutrality by implementing carbon emissions trading scheme: Policy evaluation in China. Energy Policy, 157, 112510. https://doi.org/10.1016/j.enpol.2021.112510
- Cowan, E. (1999). Topical issues in environmental finance. Research Paper Was Commissioned by the Asia Branch of the Canadian International Development Agency (CIDA), 1, 1–20.
- Dasgupta, P., & Stiglitz, J. (1980). Industrial structure and the nature of innovative activity. The Economic Journal, 90(358), 266–293. https://doi.org/10.2307/2231788
- Demena, B. A., & Afesorgbor, S. K. (2020). The effect of FDI on environmental emissions: Evidence from a meta-analysis. Energy Policy, 138, 111192. https://doi.org/10.1016/j.enpol.2019.111192
- Démurger, S., Sachs, J. D., Woo, W. T., Bao, S., Chang, G., & Mellinger, A. (2002). Geography, economic policy, and regional development in China. Asian Economic Papers, 1(1), 146–197. https://doi.org/10.1162/153535102320264512
- Dorfleitner, G., & Grebler, J. (2022). Corporate social responsibility and systematic risk: International evidence. The Journal of Risk Finance, 23(1), 85–120. https://doi.org/10.1108/JRF-07-2020-0162
- Dyllick, T., & Hockerts, K. (2002). Beyond the business case for corporate sustainability. Business Strategy and the Environment, 11(2), 130–141. https://doi.org/10.1002/bse.323
- Fatemi, A. M., & Fooladi, I. J. (2013). Sustainable finance: A new paradigm. Global Finance Journal, 24(2), 101–113. https://doi.org/10.1016/j.gfj.2013.07.006
- Hartzmark, S. M., & Sussman, A. B. (2019). Do investors value sustainability? A natural experiment examining ranking and fund flows. The Journal of Finance, 74(6), 2789–2837. https://doi.org/10.1111/jofi.12841
- Hasnaoui, J. A., Rizvi, S. K. A., Reddy, K., Mirza, N., & Naqvi, B. (2021). Human capital efficiency, performance, market, and volatility timing of Asian equity funds during COVID-19 outbreak. Journal of Asset Management, 22(5), 360–375. https://doi.org/10.1057/s41260-021-00228-y
- Heine, D., Semmler, W., Mazzucato, M., Braga, J. P., Gevorkyan, A., & Hayde, E. K. (2019). Financing low-carbon transitions through carbon pricing and green bonds. World Bank Policy Research Working Paper (8991).
- Ji, X., Chen, X., Mirza, N., & Umar, M. (2021). Sustainable energy goals and investment premium: Evidence from renewable and conventional equity mutual funds in the Euro zone. Resources Policy, 74, 102387. https://doi.org/10.1016/j.resourpol.2021.102387
- Kaiser, L., & Welters, J. (2019). Risk-mitigating effect of ESG on momentum portfolios. The Journal of Risk Finance, 20(5), 542–555. https://doi.org/10.1108/JRF-05-2019-0075
- Labatt, S., & White, R. R. (2002). Environmental finance: A guide to environmental risk assessment and financial products (Vol. 98). John Wiley & Sons.
- Li, Y., Liang, C., Ma, F., & Wang, J. (2020). The role of the IDEMV in predicting European stock market volatility during the COVID-19 pandemic. Finance Research Letters, 36, 101749.
- Liang, C., Wei, Y., Li, X., Zhang, X., & Zhang, Y. (2020). Uncertainty and crude oil market volatility: new evidence. Applied Economics, 52(27), 2945–2959. https://doi.org/10.1080/00036846.2019.1696943
- Liang, C., Wei, Y., & Zhang, Y. (2020). Is implied volatility more informative for forecasting realized volatility: An international perspective. Journal of Forecasting, 39(8), 1253–1276. https://doi.org/10.1002/for.2686
- Linnenluecke, M. K., Smith, T., & McKnight, B. (2016). Environmental finance: A research agenda for interdisciplinary finance research. Economic Modelling, 59, 124–130. https://doi.org/10.1016/j.econmod.2016.07.010
- Liu, Z., Guan, D., Wei, W., Davis, S., Ciais, P., Bai, J., Peng, S., Zhang, Q., Hubacek, K., Marland, G., Andres, R., Crawford-Brown, D., Lin, J., Zhao, H., Hong, C., Boden, T., Feng, K., Peters, G., Xi, F., … He, K. (2015). Reduced carbon emission estimates from fossil fuel combustion and cement production in China. Nature, 524(7565), 335–338.
- Liu, X., Wahab, S., Hussain, M., Sun, Y., & Kirikkaleli, D. (2021). China carbon neutrality target: Revisiting FDI-trade-innovation nexus with carbon emissions. Journal of Environmental Management, 294, 113043.
- Lobato, M., Rodríguez, J., & Romero, H. (2021). A volatility-match approach to measure performance: the case of socially responsible exchange traded funds (ETFs). The Journal of Risk Finance, 22(1), 34–43. https://doi.org/10.1108/JRF-04-2020-0066
- Lv, C., Bian, B., Lee, C., & He, Z. (2021). Regional gap and the trend of green finance development in China. Energy Economics, 102, 105476. https://doi.org/10.1016/j.eneco.2021.105476
- Mirza, N., Naqvi, B., Rahat, B., & Rizvi, S. K. A. (2020a). Price reaction, volatility timing and funds’ performance during Covid-19. Finance Research Letters, 36, 101657.
- Mirza, N., Rahat, B., Naqvi, B., & Rizvi, S. K. A. (2020b). Impact of Covid-19 on corporate solvency and possible policy responses in the EU. The Quarterly Review of Economics and Finance, https://doi.org/10.1016/j.qref.2020.09.002
- Mirza, N., Rizvi, S. K. A., Saba, I., Naqvi, B., & Yarovaya, L. (2022). The resilience of Islamic equity funds during COVID-19: Evidence from risk adjusted performance, investment styles and volatility timing. International Review of Economics & Finance, 77, 276–295. https://doi.org/10.1016/j.iref.2021.09.019
- Naqvi, B., Mirza, N., Rizvi, S. K. A., Porada-Rochoń, M., & Itani, R. (2021). Is there a green fund premium? Evidence from twenty seven emerging markets. Global Finance Journal, 50, 100656. https://doi.org/10.1016/j.gfj.2021.100656
- Park, S. K. (2018). Investors as regulators: Green bonds and the governance challenges of the sustainable finance revolution. Stanford Journal of International Law, 54, 1.
- Rizvi, S. K. A., Mirza, N., Naqvi, B., & Rahat, B. (2020a). Covid-19 and asset management in EU: A preliminary assessment of performance and investment styles. Journal of Asset Management, 21(4), 281–291. https://doi.org/10.1057/s41260-020-00172-3
- Rizvi, S. K. A., Yarovaya, L., Mirza, N., & Naqvi, B. (2020b). The impact of COVID-19 on valuations of non-financial European firms. Available at SSRN 3705462.
- Sachs, J. D., Woo, W. T., Yoshino, N., & Taghizadeh-Hesary, F. (2019). Why is green finance important? SSRN Electronic Journal. https://doi.org/10.2139/ssrn.3327149
- Salazar, J. (1998). Environmental finance: Linking two World [Paper presentation]. Paper Presented at the a Workshop on Financial Innovations for Biodiversity Bratislava.
- Sartzetakis, E. S. (2021). Green bonds as an instrument to finance low carbon transition. Economic Change and Restructuring, 54(3), 755–779. https://doi.org/10.1007/s10644-020-09266-9
- Scholtens, B. (2006). Finance as a driver of corporate social responsibility. Journal of Business Ethics, 68(1), 19–33. https://doi.org/10.1007/s10551-006-9037-1
- Song, L., & van Geenhuizen, M. (2014). Port infrastructure investment and regional economic growth in China: Panel evidence in port regions and provinces. Transport Policy, 36, 173–183. https://doi.org/10.1016/j.tranpol.2014.08.003
- Su, C., Song, Y., & Umar, M. (2021). Financial aspects of marine economic growth: From the perspective of coastal provinces and regions in China. Ocean & Coastal Management, 204, 105550. https://doi.org/10.1016/j.ocecoaman.2021.105550
- Sun, L., Qin, L., Taghizadeh-Hesary, F., Zhang, J., Mohsin, M., & Chaudhry, I. S. (2020). Analyzing carbon emission transfer network structure among provinces in China: new evidence from social network analysis. Environmental Science and Pollution Research International, 27(18), 23281–23300.
- Umar, M., Ji, X., Mirza, N., & Naqvi, B. (2021). Carbon neutrality, bank lending, and credit risk: Evidence from the Eurozone. Journal of Environmental Management, 296, 113156.
- Umar, M., Ji, X., Mirza, N., & Rahat, B. (2021). The impact of resource curse on banking efficiency: Evidence from twelve oil producing countries. Resources Policy, 72, 102080. https://doi.org/10.1016/j.resourpol.2021.102080
- Umar, M., Su, C., Rizvi, S. K. A., & Lobonţ, O. (2021). Driven by fundamentals or exploded by emotions: Detecting bubbles in oil prices. Energy, 231, 120873. https://doi.org/10.1016/j.energy.2021.120873
- Umar, M., Su, C., Rizvi, S. K. A., & Shao, X. (2021). Bitcoin: A safe haven asset and a winner amid political and economic uncertainties in the US? Technological Forecasting and Social Change, 167, 120680. https://doi.org/10.1016/j.techfore.2021.120680
- Wang, H., Chen, Z., Wu, X., & Nie, X. (2019). Can a carbon trading system promote the transformation of a low-carbon economy under the framework of the porter hypothesis?—Empirical analysis based on the PSM-DID method. Energy Policy, 129, 930–938. https://doi.org/10.1016/j.enpol.2019.03.007
- Weber, O. (2012). Environmental credit risk management in banks and financial service institutions. Business Strategy and the Environment, 21(4), 248–263. https://doi.org/10.1002/bse.737
- Weng, Q., & Xu, H. (2018). A review of China’s carbon trading market. Renewable and Sustainable Energy Reviews, 91, 613–619. https://doi.org/10.1016/j.rser.2018.04.026
- Yarovaya, L., Mirza, N., Abaidi, J., & Hasnaoui, A. (2021). Human capital efficiency and equity funds’ performance during the COVID-19 pandemic. International Review of Economics & Finance, 71, 584–591. https://doi.org/10.1016/j.iref.2020.09.017
- Yu, B., Li, C., Mirza, N., & Umar, M. (2022). Forecasting credit ratings of decarbonized firms: Comparative assessment of machine learning models. Technological Forecasting and Social Change, 174, 121255. https://doi.org/10.1016/j.techfore.2021.121255
- Yu, Y., & Zhang, N. (2021). Low-carbon city pilot and carbon emission efficiency: Quasi-experimental evidence from China. Energy Economics, 96, 105125. https://doi.org/10.1016/j.eneco.2021.105125
- Zerbib, O. D. (2019). The effect of pro-environmental preferences on bond prices: Evidence from green bonds. Journal of Banking & Finance, 98, 39–60. https://doi.org/10.1016/j.jbankfin.2018.10.012
- Zhang, Y. (2011). The impact of financial development on carbon emissions: An empirical analysis in China. Energy Policy, 39(4), 2197–2203. https://doi.org/10.1016/j.enpol.2011.02.026
- Zhang, L., Xiong, L., Cheng, B., & Yu, C. (2018). How does foreign trade influence China’s carbon productivity? Based on panel spatial lag model analysis. Structural Change and Economic Dynamics, 47, 171–179. https://doi.org/10.1016/j.strueco.2018.08.008