
 ?Mathematical formulae have been encoded as MathML and are displayed in this HTML version using MathJax in order to improve their display. Uncheck the box to turn MathJax off. This feature requires Javascript. Click on a formula to zoom.
Abstract
The relationship between environmental regulation and firm productivity has been widely debated but inconsistencies in findings across different studies. Using detailed firm-level micro-data from 2000 to 2007, this paper employs difference-in-difference combined with matching based on entropy balancing method to explore the effect of environmental regulation on firm total factor productivity (TFP) in pulp and paper industry in China. Our main findings are as following: Firstly, stricter environmental regulation, as represented by the Wastewater Discharge Standards for Pulp and Paper Industry in Shandong province, increases firm TFP significantly. Moreover, the coefficients of interest are robust to multiple robustness checks. Secondly, dynamic effects estimates reveal that when faced with this phase-in environmental regulation, firms take the foreseeably increasing strictness into account from the very beginning and prefer to take one-step adjustment to reach full compliance. Thirdly, potential mechanism analysis finds that the positive effect mainly comes from the improvement of resource allocation efficiency within firms. Fourthly, the heterogeneity test indicates that the effect of environmental regulation on firm TFP is heterogeneous across firms with different sizes, ages, ownerships, capital intensity, and export status. Finally, this paper provides convincing and insightful evidence that environmental regulation has the potential to achieve the dual goals of environmental sustainability and economic growth and is thus of broader significance for understanding the enforcement of environmental regulation in developing countries.
1. Introduction
Environmental regulation has become increasingly prevailing over time in both developed countries and developing countries. Benefits of environmental improvement are considerable, meanwhile the trade-off between strict environmental regulation and economic competitiveness has been widely debated (Okereke & McDaniels, Citation2012; Reinstaller, Citation2008; Requate & Unold, Citation2003; Ye et al., Citation2021; Zhao et al., Citation2020). There have been concerns about the cost of pollution abatement, and one of them is the negative effect on productivity (Christainsen & Haveman, Citation1981; Gray & Shadbegian, Citation2003; Greenstone et al., Citation2012), which is one of key determinants of income, living standards and long-term growth of output (Greenstone et al., Citation2012). The achievement of environmental sustainability and economic growth at the same time is a topic of global concern. Especially, China, one of the world’s greatest emerging economies, is emphasizing the necessity of environmental pollution management while maintaining rapid economic expansion.
In fact, China’s industrial wastewater emission has become one of the major challenges accompanying its rapid economic growth and the acceleration of industrialization. Industrial wastewater has drawn much concerns due to its large volume, complex composition, high pollutant concentrations, and difficulty to biodegrade (Malvis et al., Citation2019). Water pollution regulation has been put up for decades in China, such as Water Pollution Prevention and Control Law of the People’s Republic of China in 1984. However, the relatively lax environmental regulation failed to prevent continuous deterioration of the water environment (He et al., Citation2012; World Bank, Citation2006). The constantly deteriorating water environment does not announce a total failure of water pollution governance in China around that time. A rare success story meriting attention is Wastewater Discharge Standards for Pulp and Paper Industry (hereafter called WDSPPI) in Shandong province. To be specific, in 2003, Shandong province in China issued a regional wastewater discharge standard for pulp and paper industry (hereafter called PPI) to restrict the wastewater emission level, which was stricter than the contemporaneous national standard and successfully decreased Chemical Oxygen Demand (COD) discharges of PPI firms, contributing to improvement of water quality in Shandong province (Yang et al., Citation2020). The environmental benefits from the WDSPPI environmental regulation are undoubtedly enormous, while the policy potentially has ripple effects on firm’s economic performances. This paper attempts to explore the ripple effect from the perspective of firm total factor productivity (TFP), which is critical to firm’s survival and development. Since the coordination of environment and economy has always been difficult to maintain, can environmental sustainability and firm productivity growth be simultaneously achieved under this command-and-control environmental regulation in China? Certain answers to the question have yet to be investigated and to be concluded, which may hinder cumulative policy learning and development. Theoretically, environmental regulation has the potential to affect firm TFP through the shifts in resource allocation efficiency within firms and between firms. On the one hand, environmental regulation has the potential to renew firm’s production process by matching investment with appropriate investment opportunities, which is mainly manifested as the high sensitivity of investment to return on investment, and thus affects firm TFP. Therefore, the potential effect of environmental regulation on firm TFP is likely to be derived from the shift in resource allocation efficiency within firms. On the other hand, the potential effect of environmental regulation on firm TFP is also likely to be derived from the shift in resource allocation efficiency between firms, i.e., the reallocation of resource from inefficient firms to efficient ones via the entry of high-productivity firms or the exit of low-productivity firms. Concretely speaking, if environmental regulation induces high-productivity firms to enter the industry and weed out low-productivity firms, the reallocation of resource from inefficient firms to efficient ones contributes to the shift in firm TFP. Therefore, resource allocation efficiency between firms might play an important role in the potential effect of environmental regulation on firm TFP. However, the channels through which environmental regulation operates remain to be examined, and only precise examination can produce truth. In this paper, we firstly examine the economic impacts of the WDSPPI environmental regulation on productivity of PPI firms in Shandong province, and try to find out whether there is any evidence to support the existence of Porter Hypothesis. Secondly, we further explore the mechanisms through which the WDSPPI environmental regulation operates, i.e., resource allocation efficiency within firms and between firms. Thirdly, we further investigate the differential effects across firms with different characteristics. In general, our study has profound implication for the formulation and further enforcement of environmental regulation with more stringency in other regions of China, as well as in other countries.
This study contributes to the literature in three aspects. Firstly, it enriches the literature on the effect of environmental regulation on firm productivity and provides more evidence for literature supporting that the dual goals of promoting economic growth and reducing environmental pollution can be achieved by environmental regulation (Fan et al., Citation2016; Shapiro & Walker, Citation2018). Despite the negative effect of environmental regulation on firm productivity, including introducing extra production cost, distorting the profit-maximizing production decisions and crowding out other investments (Christainsen & Haveman, Citation1981; Jaffe et al., Citation1995), there are also possibilities that environmental regulation could affect firm productivity positively, which are mainly derived from the Porter Hypothesis (Ambec et al., Citation2013; Porter & Van der Linde, Citation1995), that is, properly designed environmental policies can trigger innovation that may partially or even fully offset the cost of complying with them, denominated as innovation offsets. Several studies have confirmed the positive effect of environmental regulation on innovation and competitiveness (Albrizio et al., Citation2017; Berman & Bui, Citation2001; Cai et al., Citation2020; Hamamoto, Citation2006; Hu et al., Citation2020; Jaffe & Palmer, Citation1997; Yi et al., Citation2019; Zhang & Qu, Citation2020). Our work provides new compelling evidence from China to support the existence of Porter Hypothesis in developing countries. Furthermore, to the best of our knowledge, this is the first paper to lend proof to the positive impact on firm productivity based on the sample of pulp and paper industry and the command-and-control regulation in Shandong province, China. Secondly, this paper supplements the literature concerning China’s environmental regulation. When it comes to environmental regulation in China, prior studies are mainly examining the effectiveness of environmental regulation from the central government, such as Two Control Zone (Chen & Cheng, Citation2017; Tang et al., Citation2020), Ambient Air Quality Standards (Wang et al., Citation2019), Tenth Five-Year Plan (Cai et al., Citation2016), Comprehensive Action Plan for Regional Air Pollution Control (Xu & Wu, Citation2020), etc. However, in reality, governments at central, provincial and local level are mutually responsible for environmental protection in China. Moreover, it is local governments, the front-line executives and managers of environmental protection, that put specific enforcement measures in practice (Ran, Citation2013). Local governments are able to design and implement local environmental policies out of their own development interests, which are permitted to be stricter than the central government’s environmental policies. Existing studies focusing on the impacts of environmental regulation from local governments are quite few (Liu et al., Citation2017; Wang & Song, Citation2020; Yang et al., Citation2020) and ignore the potential effect on firm productivity. Our work fills the gap to a certain extent by lending microscopic proof to the economic effects of environmental regulation on firm productivity from local governments and provides essential insights into the formulation and further enforcement of environmental regulation from local governments in China. Thirdly, our methodology strategy contributes to improving efficiency of identifying the causal relationship between environmental regulation and firm productivity, as well as to alleviate potential endogeneity problems. To be specific, we take Wastewater Discharge Standards for PPI in Shandong province happened in China as the exogenous shock, which is carried out because of sudden political pressure from South-North Water Transfer Project that is unrelated with factors influencing productivity performance of firms. This identification strategy could deal with the concern about endogeneity problems arising from reverse causality, i.e., firms with low productivity are more likely to do poorly in abatement control for various reasons, such as inefficient management system, and thus tend to weaken the effectiveness of environmental regulation. Moreover, we employ difference-in-difference combined with matching based on entropy balancing method, which is robust against selection on observables and selection on unobservables with time-invariant effects. The standard matching estimators are usually unsatisfactory due to the strong assumption of selection on observables, but in combination with difference-in-differences methodology can eliminate unobserved time-invariant differences between treated and non-treated firms that standard matching estimators fail to eliminate.
The paper is structured in the following way. Section 2 introduces the WDSPPI environmental regulation in Shandong province. Section 3 interprets data and empirical strategy. Section 4 shows empirical results and Section 5 presents mechanism analysis. Section 6 discusses heterogeneous effects with concluding remarks in Section 7.
2. Environmental regulation in Shandong province
2.1. Environmental protection in China and in Shandong province
Although Chinese government has achieved great progress in terms of economy development, people are increasingly dissatisfied with the governance performance of environment protection. In order to achieve ‘sustainable’ or ‘green’ growth, Chinese government has taken on a more proactive attitude towards addressing environmental problems. Nonetheless, specific environment protection measures and the implementation of related policies vary widely among different provinces in China, which comes from one important feature of Chinese environmental political structure, the discontinuities of ‘top-down’ style governance, that the central government tends to issue policies in the form of a series of vague goals that must be translated into concrete standards and then implemented by provincial-level governments. What’s more, the central government does not provide enough incentives for the implementation of environmental goals, failing to adequately fund environmental protection projects and to politically reward proper implementation by promoting officials or giving financial awards (Ran, Citation2013).
Among provinces in China, Shandong province put up an impressive performance in issuing more stringent environmental policies than other provinces, even than the central government. Shandong province, for example, distinguished itself by establishing the first provincial level water pollutant discharge standard for pulp and paper industry (Shandong Yearbook, Citation2004), which is highly praised by the Environmental Protection Bureau. As indicated in Appendix , the regulation policy set more stringent standards than the contemporaneous national standards. To be specific, since the year of 2003, waste-paper firms in Shandong province have been required to discharge no more than 100 mg/L COD, which is much lower than the contemporaneous national standard, i.e., 350 mg/L COD. When compared with local environmental regulations imposed by other provinces shown in Appendix , the relative standard of Shandong province is stricter than the majority of contemporaneous relative standards of other provinces. What’s more, Shandong was the first province in China to establish integrated watershed standards as early as the year of 2006, such as Shandong Province Wastewater Discharge Standards for South-North Water Project regions and Xiaoqing River Watershed Integrated Wastewater Discharge Standards. When looking back through the history of environmental protection in Shandong province, we find that the process has not been completely smooth and deliberate. Sometimes, it is urgent political pressure that leads to fluctuations in environmental protection policies in Shandong province. Concretely speaking, sudden pressure creates conditions that give the local government temporary flexibility in taking stricter measures to protect environment at the cost of economy growth. One representative example is Wastewater Discharge Standards for PPI in Shandong province, which provides a quasi-experiment for our study, wherein the implementation of the environmental regulation is determined by the sudden political event that is orthogonal to economy characteristics, so we have the opportunity to explore the causal link between environmental regulation and firm productivity.
Table A.1. Wastewater discharge standards for PPI in Shandong province.
Table A.2. Regulations involving pulp and paper industry in other provinces (by the end of 2007).
Table A.3. Effects of the environmental regulation on firm TFP: Placebo test about provinces.
Table A.4. Effects of the environmental regulation on firm TFP: Placebo test about industries.
2.2. Wastewater discharge standards for pulp and paper industry in Shandong province
Shandong province is highly industrialized and has been one of main areas specializing in pulp and paper industry for decades. Despite of the large scale, PPI in Shandong province was technologically outdated, poorly structured, and highly polluting (Eliasson & Lee, Citation2003). The impetus for change comes from South-North Water Transfer Project, an extremely ambitious national project in China that aims to redirect water from the water-plentiful south to the water-scarce north. Its eastern branch is designed to flow through several heavily polluted waterways in Shandong province. Therefore, whether water quality in Shandong province could be improved effectively became the crucial issue for the success of South-North Water Transfer Project. In other words, if the pollution situation could not be addressed properly in Shandong province, South-North Water Transfer Project, which has been invested substantially, would be totally in vain, only to find the unintended consequence, i.e., carrying wastewater into the north.
South-North Water Transfer Project generates such a strong and urgent political pressure that environment-based political incentives temporarily outweigh economic growth-based incentives, and thus local authorities are reluctantly receptive to the idea of meeting the demand of environmental protection at the cost of economic growth. The pulp and paper industry is an ideal choice for maximizing environmental improvement at the minimal economic cost for the fact that it’s one of the most largest sources of water pollution in Shandong province, accounting for 33.7% of total wastewater and 57.6% of COD emissions, while only contributing to about 3% of GDP in the year 2001 (Liu, Citation2015).The regulation targeted at pulp and paper industry, i.e., Wastewater Discharge Standards for PPI in Shandong province, was eventually issued on 4 April 2003, which introduced an eight-year increasingly strict standard. As shown in Appendix , during our sample period from 2000 to 2007, the contemporaneous national wastewater discharge standard is looser than that in Shandong province, indicating that it is the urgent political pressure that leads PPI firms in Shandong province to face higher wastewater discharge standard than national level.
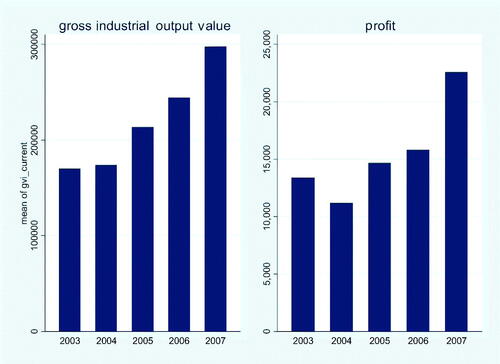
Tangible evidence suggests that the WDSPPI environmental regulation in Shandong province produces desired results. According to the statistical data from China’s Environmental Yearbook, both the absolute value and the intensity of COD emission of PPI firms in Shandong province show a downward trend, as shown in . In striking contrast, industrial output and profit of PPI firms show an upward trend at the same time, as shown in , indicating that the WDSPPI environmental regulation is unlikely to hinder the development of PPI firms in Shandong province. The WDSPPI environmental regulation appears to achieve a desired outcome, i.e., reducing pollution emission and promoting economic development simultaneously.
Figure 1. COD emission of PPI firms in Shandong province.
Notes: The left panel shows COD emission level in ton, measuring the absolute value. And the right panel shows the intensity of COD emission, measured by emission level divided by the gross industrial output value.
Source: China’s Environmental Yearbook.
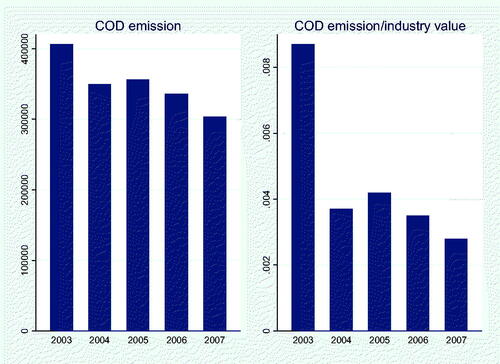
Figure 2. Industrial output and profit of PPI firms in Shandong province.
Source: China’s Environmental Yearbook.
3. Data and empirical strategy
3.1. Data
The firm-level data in this paper mainly comes from China’s Industrial Firm Database (CIFD), which is the product of annual surveys conducted by the National Bureau of Statistics in China, including all industrial firms that are either state-owned or non-state firms with sale above 5 million CNY ($760,000 USD). The total output of firms in the CIFD accounts for approximately 90% of China’s total industrial output. Some questionable firms are excluded from the sample, including firms whose operating status is non-operating, or whose sale scale is under 5 million CNY, or whose critical financial variables are missing, or whose financial indicators are obviously against accounting standards,Footnote1 or whose employees are less than 8.Footnote2 After deflation using deflators for gross output, material inputs, and capital investment provided by Brandt et al. (Citation2012), all nominal variables in the CIFD are comparable between years. Restricted by limited time interval covered by CIFD dataset, our sample includes PPI firmsFootnote3 in China from 2000 to 2007.Footnote4
As shown in , the number and industrial output of PPI firms show an increase in both Shandong province and other provinces. However, there are also differences between Shandong province and other provinces. For example, the number of PPI firms drops a bit from 2004 to 2005 in other provinces, while keeps going up in Shandong province at the same time. Furthermore, more evidence is shown in , which presents a brief description of each variable, main statistical indicators, as well as the number of observations for PPI firms in both Shandong province and other provinces. Mean values of most variables are larger in Shandong province than those in other provinces. Specifically speaking, compared with other provinces, PPI firms in Shandong province are likely to be larger-scale, older, more capital-intensity and have higher profit rate. Moreover, there seems to be more export firms and more state-owned ones in Shandong province. As for the key variable of our interest, i.e., productivity,Footnote5 firms in the Shandong province are also relatively larger than those in other provinces, with the specific value of 6.46 and 5.88, respectively. Therefore, PPI firms in Shandong province indeed differ from those in other provinces to some extent.
Figure 3. Industrial indicators of PPI firms in China.
Notes: Dashed lines and solid lines depict Shandong province and other provinces, respectively. The left panel shows the number of PPI firms. The right panel shows gross industrial output value of PPI firms, where the bar graph displays Shandong’s percentage.
Source: The authors.
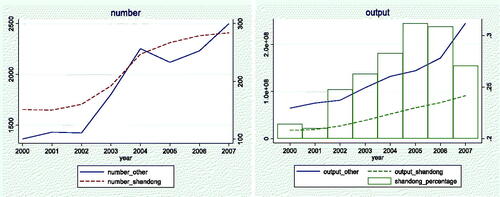
Table 1. Descriptive statistics of variables.
3.2. Empirical strategy
The WDSPPI environmental regulation in Shandong province provides a quasi-natural experiment for us to employ difference-in-differences (DID) strategy to explore the impact of environmental regulation on firm TFP. The baseline regression equation is specified as in EquationEq. (1)(1)
(1) :
(1)
(1)
where subscript
represents the firm, subscript
represents the year. The dependent variable ln(TFP)it is the natural logarithm of TFP of firm
in year
Two dummy variables are defined as follows. The first dummy variable
equals 1 if the firm is located in Shandong province, and 0 otherwise. The second dummy variable
equals 1 in and after 2003, which is the WDSPPI environmental regulation implementation period, and 0 otherwise.
is the interaction between dummy variable
and dummy variable
.
is the coefficient of interest, indicating the effect of the WDSPPI environmental regulation on firm TFP. If
>0, it means that the WDSPPI environmental regulation has a positive impact on firm TFP. Oppositely, if
<0, it means that the WDSPPI environmental regulation has a negative impact on firm TFP. To control for unobservable factors that may bias the accuracy of estimation, firm fixed effect,
and year fixed effect,
are controlled in the equation, which means we control for general macroeconomic factors that affect all firms over time as well as time-invariant firm-specific characteristics.
is a set of firm-level control variables that might account for the variation of firms’ productivity, including age, export status, ownership structure, size measured by the natural logarithm of employees, and capital intensity measured by total assets divided by the number of employees.
is a random disturbance term.
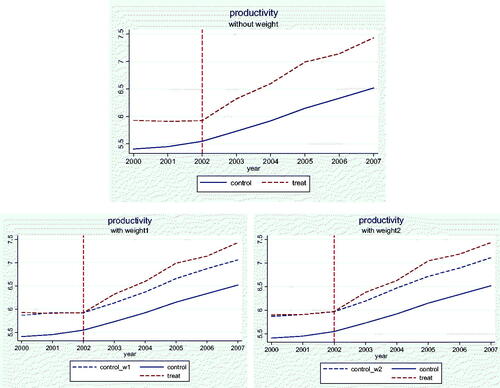
The DID estimator compares productivity differences for treated firms and control firms between pre- and after-policy to explore the causal effect of the WDSPPI environmental regulation on firm TFP. The key assumption of DID is treated firms and non-treated firms share the common productivity trend. In other words, theoretically, the trend of productivity for treated firms in Shandong province and non-treated firms in other provinces should be consistent before the policy implementation. However, intuitive findings from the upper panel of , which displays difference between productivity trend of treated firms in Shandong province and that of non-treated firms in other provinces before the regulation implementation, question the common trend assumption to some extent. To satisfy the comparability between the treatment group and the control group, entropy balancing method (Hainmueller, Citation2012) is employed to match treated observations and untreated ones. Compared with often applied propensity score methods, where the control group observations are reweighted either by weights that depend directly on propensity score values or by weights that depend on propensity score distances to treatment observations, entropy balancing method is more effective in reducing covariate imbalance. This is because entropy balancing method reweights the untreated sample in such a way that covariate distributions in the reweighted data satisfy a set of specified moment conditions, for example, the same mean and variance of covariate as those in the treatment group. Entropy balancing method directly incorporates covariate balance in the estimation procedure, so there is no need to check covariate balance repeatedly, making the burdensome procedure of propensity score methods unnecessary, where researchers manually iterate between propensity score modeling, matching, and balance checking until they attain a satisfactory balancing solution. Zhao and Percival (Citation2017) prove the theoretical properties of entropy balancing method and show it is doubly robust, i.e., if either the propensity score model or the outcome regression model is correctly specified, the mean causal effect estimator is statistically consistent.
Figure 4. Trends of productivity between treatment group and control group.
Notes: Red dashed lines, blue dashed lines and solid lines depict the treatment group, the weighted control group and the original control group, respectively. The bottom-left panel is adjusted by weight-one, while the bottom-right panel is adjusted by weight-two.
Source: The authors.
The first step in implementing difference-in-difference combined with matching based on entropy balancing method is to obtain weights using entropy balancing method. The second step is the regression step, where the basic DID estimation equation is regressed on the treatment indicator with weights obtained in the first step. The estimator is similar to the regression-adjusted semiparametric difference-in-difference matching strategy proposed by Heckman et al. (Citation1997). It only differs in the construction of weights, which are computed by propensity score methods in Heckman et al. (Citation1997).
The moment condition setting of entropy balancing method in our study is that the control group should have the same mean and variance as the treatment group for all conditioning variables after entropy balancing. Herein, conditioning variables include size, age, production unit, export status, ownership structure, labor share, capital intensity, input intensity, profit rate, debt structure, return on assets and productivity level (see for detailed definition). Two types of weights are constructed to check robustness of conclusion and obtain the most efficient weights. Specifically, weight-one utilizes firms’ characteristics and financial indicators lagged by one year, while weight-two uses two-year-lagged information, which increases accuracy but sacrifices sample size. Both weights are utilized in the following analysis and conclusions remain consistent with different weights.
As shown in ,Footnote6 mean, variance, and skewness of all conditioning variables are mostly the same between the treatment group and the weighted control group. Moreover, common trend assumption is tenable after constructing comparable control group. After adjustment using weight-one and weight-two, as shown in bottom panel of , trends of productivity are approximately common between treatment group and weighted control group in pre-treatment period (2000–2002) and shows a significant increase in treatment group after the policy implementation.
Table 2. Results of entropy balancing.
4. Empirical results
4.1. Baseline estimates
In this section, we report results of estimating the effect of the WDSPPI environmental regulation on firm TFP as shown in EquationEq. (1)(1)
(1) , which is presented in . Columns (1) to (6) employ different controls and weights. In particular, Column (1) only controls for firm fixed effect and year fixed effect, and Column (2) introduces relevant control variables on the basis of Column (1). Columns (3) and (4) extend Columns (1) and (2) with weight-one obtaining from entropy balancing method using one-year-lagged conditioning variables. Similarly, Columns (5) and (6) extend Columns (1) and (2) with weight-two obtaining from entropy balancing method using two-year-lagged conditioning variables, which leads to the decrease in the sample size as a result of dropping firms without two-year-lagged information. The coefficients of interest,
are invariably significantly positive in Columns (1)–(6), indicating that the WDSPPI environmental regulation in Shandong province significantly increases firm TFP. The baseline estimation results provide initial evidence that the WDSPPI environmental regulation has potential to improve firm performance in terms of TFP effectively. We now comment on the magnitude of these effects, the point estimates from our preferred specifications, i.e., Columns (4) and (6), suggesting that productivity level of PPI firms in Shandong province, on average, increase by 27.5%–28.4% relative to the control group.
Table 3. Effects of the environmental regulation on firm TFP.
4.2. Dynamic effects and parallel trend hypothesis test
Environmental regulation may take time to come to fruition for the fact that firms take time to respond to it by adjusting productive process or installing abasement equipment. What’s more, the WDSPPI environmental regulation in Shandong province consists of phase-in plans, including the first stage from 2003 to 2006, the second stage from 2007 to 2009, and the third stage after 2009.Footnote7 While only the first year in the second stage is included in the dataset, it is possible to investigate whether or not firms make adjustments by stages under this phase-in environmental regulation. To investigate dynamic effects of the WDSPPI environmental regulation on firm TFP over time and to confirm whether there is a leaping productivity growth along with stricter standards implementation in the second stage, the benchmark specification is expanded as follows:
(2)
(2)
where
is the annual dummy variable,
=2000, 2001, … 2007, whose value is taken as 1 in the
th year and 0 otherwise. The coefficient of interaction between dummy variable
and dummy variable
,
, indicates the effect of the WDSPPI environmental regulation on firm TFP in the
th year. Statistically, if
is statistically significant, it indicates that the marginal effect of the WDSPPI environmental regulation on firm TFP in the
th year is statistically significant.
reports the estimation results, and plots the estimates of the coefficient corresponding to EquationEq. (2)
(2)
(2) with a 90% confidence interval. The premise of the DID identification strategy is parallel trend hypothesis test, i.e., theoretically, the time trend of outcome variable in both treatment group and control group should be consistent before the policy implementation. As shown in column (1) of , as well as in the upper panel of , the coefficient,
is significantly different from zero, which invalidates the parallel trend hypothesis and makes it necessary to employ entropy balancing method to match firms between treatment group and control group. According to columns (2) and (3) of , as well as the bottom panel of , the coefficients,
and
are near to zero after reweighting the control group, which reassures us that treated firms and weighted non-treated firms have followed the same time trend before the implementation of regulation, and thus passes parallel trend hypothesis test.
Figure 5. Time trend of the environmental regulation on firm TFP.
Notes: The year before implementation of environmental regulation is omitted as base group to avoid perfect collinearity problem.
Source: The authors.
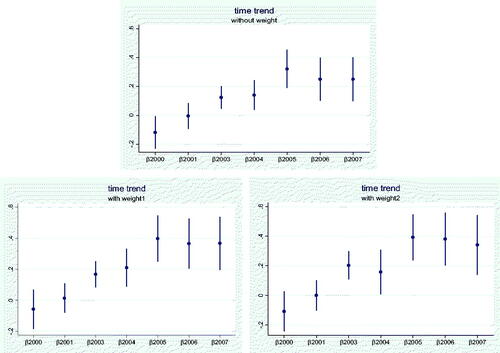
Table 4. Dynamic effects of the environmental regulation on firm TFP.
As shown in columns (2) and (3) of , as well as in the bottom panel of , the coefficient, is positive and statistically significant, indicating that there is no lag effect for the WDSPPI environmental regulation, i.e., the positive effect of the WDSPPI environmental regulation on firm TFP appears immediately in the first regulation year. According to coefficients from
to
corresponding to policy effect from the first year to the fifth year, there is no leaping productivity growth in 2007, which is the first year for stricter regulation in the second stage. From dynamic effects discussed above, we can draw a conclusion that when faced with this phase-in environmental regulation, firms have taken the foreseeably increasing strictness into account from the very beginning and prefer to take one-step adjustment aimed at the final goal.
4.3. Robustness test
In this section, we conduct lots of robustness tests to further confirm basic conclusion that the WDSPPI environmental regulation in Shandong province significantly increases firm TFP. The details of robustness tests are as follows.
4.3.1. Placebo test
As a placebo test, large papermaking provincesFootnote8 in China are firstly chosen and assumed to carry out the same environmental regulation as what Shandong province did in 2003, i.e., falsified implementation provinces. Secondly, similar to the placebo test of changing the policy’s implementation provinces, representative industriesFootnote9 are selected as falsified implementation industries. Thirdly, according to the methodology of Topalova (Citation2010), we suppose that the same environmental regulation was carried out in specific years of the pre-treatment period (i.e., the sample period from 2000 to 2002 in our study), and we preserve pre-treatment observations to examine the effect of the falsified policy’s implementation years, which suppose that the same environmental regulation was carried out in the year of 2001 and in the year of 2002 respectively. Actually, there’s no corresponding environmental regulations enacted simultaneously for these falsified provinces, industries and years. Therefore, empirical designs employing one of these falsified conditions to define the new treatment variable in sequence are supposed to find no significant effect in theory. Due to width limits on this page, we only report part of results concerning the three kinds of placebo tests in . The estimated results of placebo test about all representative provinces and all representative industries are shown in Appendix and . As shown in , compared with column (1) setting PPI firms in Shandong province as the treatment group since the year of 2003, the corresponding estimates for other falsified conditions from columns (2) to (7) are insignificant and close to zero, indicating that the falsified treatment groups fail to verify the positive impact of the environmental regulation on firm TFP, and thus on the flip side, suggesting the real and significant effect from the real treatment of the environmental regulation implemented in Shandong province since the year of 2003.
Table 5. Effects of the environmental regulation on firm TFP: Placebo test.
4.3.2. Expectation effect
One concern for DID methodology is expectation effect, i.e., if PPI firms in Shandong province could anticipate the implementation of the WDSPPI environmental regulation and take action in advance, the regulation policy would be non-randomized and our estimates would be biased. To examine the expectation effect, we introduce an additional control variable, i.e., to the benchmark specification (1), which is as following:
(3)
(3)
where
is the interaction between dummy variable
, whose value is taken as 1 in Shandong province, and 0 otherwise, and dummy variable
, whose value is taken as 1 in the year of 2002, one year before the implementation of the WDSPPI environmental regulation, and 0 otherwise. According to estimation results shown in , the coefficient of
is statistically insignificant, excluding the possibility of expectation effect. Moreover, the coefficient of interest,
remains positive and statistically significant, which is consistent with basic conclusion.
Table 6. Effects of the environmental regulation on firm TFP: Expectation effect.
4.3.3. Difference-in-difference-in-difference estimation
Our conclusion could be undermined by potential unknown factors affecting all industries in Shandong province, such as sudden technical advance along with productivity improvement since the year of 2003, which is unrelated to the WDSPPI environmental regulation. To address this concern, we employ difference-in-difference-in-difference (DDD) identification strategy by adding firms from other industries to control the common shock to all industries in Shandong province. We introduce an additional control variable, i.e., , to the benchmark specification (1) as follows:
(4)
(4)
where
is the interaction between dummy variable
, whose value is taken as 1 in Shandong province, and 0 otherwise, dummy variable
, whose value is taken as 1 in and after 2003, and 0 otherwise, and dummy variable
, whose value is taken as 1 for PPI firms, and 0 otherwise. Five representative industries are chosen based on their similarities to the PPI of Shandong province in terms of pollution intensity or industrial output value. To be specific, we choose three industries that produce severe water pollution, which are similar to the pollution intensity of PPI in Shandong province, and two industries with high industrial output value, which are similar to the industrial output value of PPI in Shandong province, i.e., textile industry, leather industry, ferrous metal industry, chemical industry, and special equipment industry. As shown in , the WDSPPI environmental regulation significantly increases productivity level of PPI firms in Shandong province, which is consistent with basic conclusion.
Table 7. Effects of the environmental regulation on firm TFP: DDD model.
4.3.4. Regulations in other provinces
Except for Wastewater Discharge Standards for PPI in Shandong province, there are also environmental regulations stipulating wastewater discharge standard for PPI firms in other provinces during our study period from 2000 to 2007, which are not appropriate control group any more. Herein, we totally collect six environmental regulations concerning wastewater discharge standard for PPI firms from five provinces and then compare them with the environmental regulation in Shandong province. As shown in Appendix , environmental regulations in other province are either aimed at certain portion of the industry, such as waste-paper firms, or carried out in certain regions of provinces.Footnote10 Because of lack of detailed address and product directory, it’s impossible to only exclude targeted firms by these environmental regulations, we have no choice but to eliminate all PPI firms from related five provinces.Footnote11 Estimation results are reported in , indicating the exclusion of these questionable provinces does not challenge the basic conclusion, i.e., the WDSPPI environmental regulation in Shandong province significantly increase the productivity level of PPI firms.
Table 8. Effects of the environmental regulation on firm TFP: Drop questionable provinces.
5. Mechanisms
So far, we have explored the effect of the WDSPPI environmental regulation on firm TFP, but the channels through which the WDSPPI environmental regulation operates remain to be examined. In this section we explore effects that the WDSPPI environmental regulation has on firm TFP through resource allocation efficiency within firms and between firms.
5.1. Resource allocation efficiency within firms
Theoretically, the positive effect that the WDSPPI environmental regulation has on firm TFP is likely to be derived from the improvement in resource allocation efficiency within firms, which is commonly measured by the sensitivity of investment to return on investment, mirroring firm’s relevant capacity to match investment with appropriate investment opportunities. To explore whether the WDSPPI environmental regulation significantly improves the resource allocation efficiency within firms, based on the work of Wurgler (Citation2000), Chen et al. (Citation2011), and Tang et al. (Citation2020), our specification is as following:
(5)
(5)
where
it is the investment levelFootnote12 of firm
in year
is the return on investment of firm
in year
which is measured by return on assets (ROA, calculated by net profit divided by total assets). The coefficient of interest,
reflects the extent of investment response. To be specific, if
>0, it indicates that the WDSPPI environmental regulation increases the sensitivity of investment to ROA, and vice versa. As reported in , the coefficients of interest are positive and statistically significant, suggesting that the resource allocation efficiency within firms of PPI in Shandong province has increased significantly after the enforcement of the WDSPPI environmental regulation compared with that of PPI in other provinces. This finding supports the Porter Hypothesis, that is environmental regulations have the potential to optimize firms’ production process and then positively affects their productivity levels.
Table 9. Effects of the environmental regulation on resource allocation efficiency within firms.
5.2. Resource allocation efficiency between firms
Apart from the improvement in resource allocation efficiency within firms, the positive effect that the WDSPPI environmental regulation has on firm TFP is also likely to be derived from the improvement in resource allocation efficiency between firms, that is, the reallocation of resource from inefficient firms to efficient ones via the entry of high-productivity firms or exit of low-productivity firms. To explore the impact of the WDSPPI environmental regulation on firm entry behavior, and to corroborate whether the WDSPPI environmental regulation induces firms with higher productivity to enter pulp and paper industry in Shandong province, indicating the barriers to entry are raised, our specification is the following:
(6)
(6)
where the dummy variable
equals 1 if firm
enters the market in year
The coefficient
captures the difference between the impact of the WDSPPI environmental regulation on entrants TFP and that on incumbents TFP. Specifically speaking, if
> 0, it means that after the implementation of the WDSPPI environmental regulation, the productivity levels of entrants in Shandong province are, on average, higher than that of incumbents, and vice versa. finds no difference between the impact of the WDSPPI environmental regulation on entrants TFP and that on incumbents TFP. Therefore, the reallocation of resource between firms via the entry of high-productivity firms turns out not to be the channel through which the WDSPPI environmental regulation affects firm TFP positively.
Table 10. Effects of the environmental regulation on firm TFP: Entrants and incumbents.
Moreover, to explore the impact of the WDSPPI environmental regulation on firm exit behavior, and to examine whether the WDSPPI environmental regulation effectively weeds out low-productivity PPI firms in Shandong province, our specification is the following:
(7)
(7)
where the dummy variable
equals 1 if the firm
exits the market in year
The coefficient
indicates that the difference between the impact of the WDSPPI environmental regulation on drop-outs TFP and that on incumbents TFP. Concretely speaking, if
<0, it means that after the implementation of the WDSPPI environmental regulation, it’s more possible for inefficient firms to exit the industry in Shandong province, and vice versa. finds no difference in the effect of the WDSPPI environmental regulation on the exit probability among firms with various productivity levels. Consequently, the reallocation of resource between firms via the exit of low-productivity firms turns out not to be the channel through which the WDSPPI environmental regulation affects firm TFP positively, which is similar to the finding of firm entry behavior discussed above.
Table 11. Effects of the environmental regulation on firm TFP: Drop-outs and incumbents.
6. Heterogeneity effects
Our aforementioned analyses estimate the average effect of the WDSPPI environmental regulation on firm TFP. In this subsection, we investigate the heterogeneous effects of the WDSPPI environmental regulation on firm TFP, to further shed light on how firm TFP is affected by the WDSPPI environmental regulation across firms with different characteristics.
6.1. Firms with different sizes
Firms of various sizes may react differently to the same environmental regulation as they have significant differences in market power, pursuit of technology and management efficiency. Therefore, we’d like to explore the differential impacts of the WDSPPI environmental regulation on firm TFP by firm size. Specifically speaking, we divide firms into three groups according to their numbers of employees, i.e., small, medium and large-sized firms, the cutoff values of which are the upper and lower quartiles. Regression results using full sample and subsamples of small, medium and large-sized firms are reported in columns (1)–(4) of , respectively. As indicated in , the positive effect of the WDSPPI environmental regulation on firm TFP is only statistically significant for large-sized firms, suggesting that compared with small and medium-sized firms, large-sized firms have the capacity to introduce new production technologies or processes, and prefer to upgrade the outdated devices that consume much more energy and produce more pollution than the newer ones that do the same things, and thus are more likely to obtain innovation offsets.
Table 12. Heterogeneity analysis: Small, medium and large-sized firms.
6.2. Firms with different ages
Firms with different ages may also react differently to the same environmental regulation as they suffered from various growing pains early on and may be at very different stages during the firm lifecycle. To further explore the differential effect of the WDSPPI environmental regulation on firm TFP by firm age, we divide firms into three groups according to their ages, i.e., start-up, growing and mature firms, the cutoff values of which are the upper and lower quartiles. Regression results using full sample and subsamples of start-up, growing and mature firms are reported in columns (1)–(4) of , respectively. As shown in , the estimates are statistically significant for growing and mature firms except for start-up firms, indicating that compared with start-up firms, relatively mature firms that have piled up experience of operation and fostered great corporate culture, are more likely to plan further ahead to introduce new technologies, improve production processes, and renew outdated facilities when faced with stricter environmental regulation.
Table 13. Heterogeneity analysis: Start-up, growing and mature firms.
6.3. Firms of different ownerships
Firms of different ownerships probably have different reactions to the same environmental regulation for the fact that they have different political connections with local governments, indicating that they have different negotiation and bargaining powers faced with stricter environmental regulations. To further explore the differential effect of the WDSPPI environmental regulation on firm TFP by different ownerships, we divide firms into two groups according to their ownerships, i.e., state-owned and non-state-owned firms. Regression results using full sample and subsamples of state-owned and non-state-owned firms are reported in columns (1)–(4) of , respectively. As reported in , compared with non-state-owned firms, the coefficient of interest is smaller and less statistically significant for state-owned firms, suggesting that compared with non-state-owned firms, state-owned firms are relatively less environmentally regulated due to their closer political connections with local governments, as well as stronger negotiation and bargaining powers, both of which give them more flexibility in introducing technologies or improving production processes, and thus impede the improvement of firm productivity.
Table 14. Heterogeneity analysis: State-owned and non-state-owned firms.
6.4. Firms with different capital intensity
Theoretically speaking, firm would reach a point of diminishing marginal returns on investment when its capital is relatively abundant compared with other essential production factors. Therefore, firms with different capital intensity may receive different productivity gains when they increase investment in the form of introducing new production technologies or upgrading the outdated devices faced with stricter environmental regulations. To further explore the differential effect of the WDSPPI environmental regulation on firm TFP by firm capital intensity, we divide firms into three groups according to their ratios of capital to labor, i.e., low, medium and high capital-intensity firms, the cutoff values of which are the upper and lower quartiles. Regression results using full sample and subsamples of low, medium and high capital-intensity firms are reported in columns (1)–(4) of , respectively. As shown in , the coefficient of interest for low capital-intensity firms is nearly double the estimates for medium and high capital-intensity firms, suggesting that the effect of the WDSPPI environmental regulation is larger for firms of relatively scarce capital, whose productivity returns on investment are relatively higher.
Table 15. Heterogeneity analysis: Low, medium and high capital-intensity firms.
6.5. Export firms versus non-export firms
To further examine the difference in impacts of the WDSPPI environmental regulation on firm TFP between export firms and non-export firms, we divide firms into two groups according to their export status, i.e., export firms and non-export firms. Regression results using full sample and subsamples of export and non-export firms are presented in columns (1)–(3) of , respectively. As indicated in , the coefficient of interest for non-export firms is a bit larger than the estimate for export firms. One possible explanation is that, compared with firms with high productivity, the productivity gains from increasing investment in the form of introducing new production technologies or upgrading the outdated devices are relatively larger for firms with low productivity. Moreover, based on heterogeneous productivity firm trade theory, firms with high productivity tend to export as they are able to afford fixed costs, and vice versa, indicating that export firms generally have higher productivity than non-export firms. Therefore, non-export firms with low productivity would receive relatively larger productivity gains from increasing investment in the form of introducing new production technologies or upgrading the outdated devices faced with stricter environmental regulation.
Table 16. Heterogeneity analysis: Export and non-export firms.
7. Conclusions
The potential negative impact of environmental regulation on economics competitiveness in many developing countries, such as China, has become an important economic and political issue that looms large in environmental policy debates. Policymakers want to understand to what extent stricter environmental regulations will impact firm productivity and economic growth. Using firm-level dataset from 2000 to 2007 in China, we estimate the effect of the WDSPPI environmental regulation in Shandong province on firm TFP and examine the channels through which the WDSPPI environmental regulation operates, i.e., resource allocation efficiency within firms and between firms, and further analyze heterogeneous effects of the WDSPPI environmental regulation on firm TFP across firms with different characteristics.
Our main findings are as follows: (1) The stricter environmental regulation effectively leads to an increase in firm TFP, which indicates environmental regulation has the potential to achieve a ‘win-win’ goal on both sides, i.e., between environmentally sustainable development and economic growth; (2) According to dynamic effects analysis, the positive effect of the WDSPPI environmental regulation on firm TFP appears immediately in the first regulation year of 2003, indicating that there is no lag effect, and shows no leaping productivity growth in 2007, suggesting that when faced with this phase-in environmental regulation, PPI firms in Shandong province prefer to take one-step adjustment aimed at the final goal; (3) The positive effect of the WDSPPI environmental regulation on firm TFP mainly comes from the improvement of resource allocation efficiency within firms, rather than between firms; (4) The heterogeneity test indicates that the positive effect of the WDSPPI environmental regulation on firm TFP is heterogeneous across firms with different characteristics, with greater positive effects for large-sized firms, growing and mature firms, non-stated-owned firms, low capital-intensity firms, and non-export firms.
We propose corresponding policy implications based on our empirical findings, which may contribute to implementation of necessary and proper environmental protection policies for governments. Firstly, proving the possibility of achieving the dual goals of environmental sustainability and economic benefits simultaneously, as what we have done in this paper, gives governments of many regions and countries great courage to implement necessary environmental regulation policies. Actually, in many regions and countries, especially developing countries, governments are hesitant to implement environmental regulation for fear that they will be blamed for the potential loss of economic benefits. Our study provides new evidence from China supporting the existence of Porter Hypothesis in developing countries, i.e., well-designed environmental regulation has the potential to optimize production process and positively affect firm productivity. The positive impact of the WDSPPI environmental regulation on firm TFP suggests that the government should not be too cautious to implement necessary environmental regulation policies just because of the possibility of being blamed for the potential loss of economic benefits, and policy makers should have more courage to make necessary environmental regulation and act decisively. Actually, many countries, such as the European Union (EU), are implementing the concept of the circular economy system, which emphasizes ideas of environmental protection and sustainable development (Stankevičius et al., Citation2020). Moreover, adopting a ‘proceed in the light of local conditions’ strategy is of great importance when making environmental regulation policy. As proved in our study, for instance, the command-and-control environmental regulation of pulp and paper industry in Shandong province succeeds in promoting cleaner production, as well as improving firm TFP, indicating that compared with the market-based environmental regulation policy, the command-and-control environmental regulation policy, which sets pollution emission at a certain level and makes it mandatory to achieve emission reduction targets, is not a bad environmental regulation tool for pulp and paper industry in Shandong province. Therefore, policy makers should choose proper environmental regulation policy according to local conditions and should not apply it mechanically.
Secondly, although the overall effectiveness of environmental regulation on productivity has been proved in the case of the environmental regulation of pulp and paper industry in Shandong province, there are still concerns that firms with different characteristics may react differently to the enforcement of the environmental regulation, and thus the environmental regulation could not work on all firms through the improvement of resource allocation efficiency within firms, which has been proved to be the main channel in the mechanism test. To be more specific, the heterogeneity test reveals that large-sized firms and non-stated-owned firms benefit more from the regulation, indicating that small-sized firms and state-owned firms are relatively lack of flexibility to cope with the environmental regulation. Therefore, making proper policies to help small businesses grow into big ones, such as establishing a fund for small lenders to help small businesses, and continuing the reform of state-owned firms to unlock market vitality, are two valid paths to increase the gains from the regulation.
This paper has a few limitations that future research may address. Firstly, our evidence supporting the existence of Porter Hypothesis in China is based on pulp and paper industry, which is one of the most serious industries producing environmental pollution. In addition, due to the limited access, the period of this study is from 2000 to 2007. A more precise relationship between the environmental regulation and firm productivity may be obtained with more recent data from more industries in the future. Secondly, besides firm productivity, more firm economic performance, such as firm technology upgrading, firm financing constraint, and firm internationalization level, etc., could be explored to provide a more complete picture of the ripple effects of environmental regulation on firm economic performance. Therefore, in future work we expect to further examine the causal effect of environmental regulation on various aspects of firm economic performance.
Correction Statement
This article has been republished with minor changes. These changes do not impact the academic content of the article.
Additional information
Funding
Notes
1 Accounting standards include that total asset is less than net fixed asset, accumulated depreciation is less than current depreciation, accumulated depreciation is more than original price of fixed asset, and paid-up capital is equal to 0.
2 The financial system of firms with employees less than 8 is not reliable.
3 Wastewater Discharge Standards for PPI in Shandong province is aimed at pulp-making firms, paper-making firms and pulp-paper joint-making firms. So, our analysis excludes paper-product-making firms which are also classified as pulp and paper industry in China.
4 CIFD consists of manufacturing firms from 1998 to 2007. Firms in 1998 and 1999 are excluded from our analysis in consideration of these two years without two-lagged-year data to calculate matching weights.
5 In this work, productivity is estimated using the methodology developed by Levinsohn and Petrin (Citation2003) (LP), supplemented with the methodology pioneered by Ackerberg et al. (Citation2006) to solve collinearity problem in the first stage of the LP method. We use industrial added value to measure output, the number of employees to measure labor, the financially reported intermediate input to measure intermediate input, the net fixed capital to measure capital and calculate investment using perpetual inventory method. The detailed explanation to the measurement of productivity is reported in the Appendix B.
6 For parsimony, results using another weight are not reported, the results are available upon request.
7 Specific reduction targets are reported in the Appendix Table A.1.
8 We chose five provinces based on their PPI scale, including Zhejiang province, Guangdong province, Hebei province, Jiangsu province and Fujian province.
9 The representative industries are chosen based on their similarities to the PPI of Shandong province in terms of pollution intensity or industrial output value. To be specific, we choose three industries that produce severe water pollution, which are similar to the pollution intensity of PPI in Shandong province, and two industries with high industrial output value, which are similar to the industrial output value of PPI in Shandong province, as falsified implementation industries, i.e., textile industry, leather industry, ferrous metal industry, chemical industry, and special equipment industry.
10 The only one aimed at all PPI firms in Henan province is still looser than contemporaneous standard in Shandong province.
11 Almost half of the sample are lost, that’s why we don’t do the same deletion in the baseline analysis.
12 We use the net fixed capital to measure capital () and calculate investment (
) using perpetual inventory method:
where the depreciation rate
is assumed as 15%.
13 The estimate of survival probability can be obtained by running a Probit model, where the dependent variable is a survival dummy and the left-hand variables are the polynomial terms of investment (or intermediate input in LP) and capital.
14 we use the net fixed capital to measure capital () and calculate investment (
) using perpetual inventory method:
where the depreciation rate
is assumed as 15%.
References
- Ackerberg, D., Caves, K., & Frazer, G. (2006). Structural identification of production functions. MPRA Working Paper No. 38349 Issued in December 2006. https://mpra.ub.uni-muenchen.de/38349/1/MPRA_paper_38349.pdf
- Albrizio, S., Kozluk, T., & Zipperer, V. (2017). Environmental policies and productivity growth: Evidence across industries and firms. Journal of Environmental Economics and Management, 81, 209–226. https://doi.org/10.1016/j.jeem.2016.06.002
- Ambec, S., Cohen, M. A., Elgie, S., & Lanoie, P. (2013). The Porter hypothesis at 20: Can environmental regulation enhance innovation and competitiveness? Review of Environmental Economics and Policy, 7(1), 2–22. https://doi.org/10.1093/reep/res016
- Berman, E., & Bui, L. T. M. (2001). Environmental regulation and productivity: Evidence from oil refineries. Review of Economics and Statistics, 83(3), 498–510. https://doi.org/10.1162/00346530152480144
- Brandt, L., Van Biesebroeck, J., & Zhang, Y. (2012). Creative accounting or creative destruction? Firm-level productivity growth in Chinese manufacturing. Journal of Development Economics, 97(2), 339–351. https://doi.org/10.1016/j.jdeveco.2011.02.002
- Cai, H., Chen, Y., & Gong, Q. (2016). Polluting thy neighbor: Unintended consequences of China’s pollution reduction mandates. Journal of Environmental Economics and Management, 76, 86–104. https://doi.org/10.1016/j.jeem.2015.01.002
- Cai, X., Zhu, B., Zhang, H., Li, L., & Xie, M. (2020). Can direct environmental regulation promote green technology innovation in heavily polluting industries? Evidence from Chinese listed companies. The Science of the Total Environment, 746, 140810.
- Chen, B., & Cheng, Y. S. (2017). The impacts of environmental regulation on industrial activities: Evidence from a quasi-natural experiment in Chinese prefectures. Sustainability, 9(4), 571. https://doi.org/10.3390/su9040571
- Chen, S., Sun, Z., Tang, S., & Wu, D. (2011). Government intervention and investment efficiency: Evidence from China. Journal of Corporate Finance, 17(2), 259–271. https://doi.org/10.1016/j.jcorpfin.2010.08.004
- Christainsen, G. B., & Haveman, R. H. (1981). The contribution of environmental regulations to the slowdown in productivity growth. Journal of Environmental Economics and Management, 8(4), 381–390. https://doi.org/10.1016/0095-0696(81)90048-6
- Eliasson, B., & Lee, Y. Y. (2003). Integrated assessment of sustainable energy systems in China. The China energy technology program: A framework for decision support in the electric sector of Shandong province. Springer Press.
- Fan, Q., Zhou, X., & Zhang, T. (2016). Externalities of dynamic environmental taxation, paths of accumulative pollution and long-term economic growth. Economic Research Journal, 8, 116–128.
- Gray, W. B., & Shadbegian, R. J. (2003). Plant vintage, technology, and environmental regulation. Journal of Environmental Economics and Management, 46(3), 384–402. https://doi.org/10.1016/S0095-0696(03)00031-7
- Greenstone, M., List, J. A., & Syverson, C. (2012). The effects of environmental regulation on the competitiveness of US manufacturing. NBER Working Paper No. 18392 Issued in September 2012. https://www.nber.org/papers/w18392
- Hamamoto, M. (2006). Environmental regulation and the productivity of Japanese manufacturing industries. Resource and Energy Economics, 28(4), 299–312. https://doi.org/10.1016/j.reseneeco.2005.11.001
- Hainmueller, J. (2012). Entropy balancing for causal effects: A multivariate reweighting method to produce balanced samples in observational studies. Political Analysis, 20(1), 25–46. https://doi.org/10.1093/pan/mpr025
- He, G., Lu, Y., Mol, A. P. J., & Beckers, T. (2012). Changes and challenges: China's environmental management in transition. Environmental Development, 3, 25–38. https://doi.org/10.1016/j.envdev.2012.05.005
- Heckman, J. J., Ichimura, H., & Todd, P. E. (1997). Matching as an econometric evaluation estimator: Evidence from evaluating a job training programme. The Review of Economic Studies, 64(4), 605–654. https://doi.org/10.2307/2971733
- Hu, J., Huang, Q., & Chen, X. (2020). Environmental regulation, innovation quality and firms' competitivity-Quasi-natural experiment based on China's carbon emissions trading pilot. Economic Research-Ekonomska Istraživanja, 33(1), 3307–3333. https://doi.org/10.1080/1331677X.2020.1771745
- Jaffe, A. B., & Palmer, K. (1997). Environmental regulation and innovation: A panel data study. Review of Economics and Statistics, 79(4), 610–619. https://doi.org/10.1162/003465397557196
- Jaffe, A. B., Peterson, S. R., Portney, P. R., & Stavins, R. N. (1995). Environmental regulation and the competitiveness of US manufacturing: What does the evidence tell us? Journal of Economic Literature, 33(1), 132–163.
- Levinsohn, J., & Petrin, A. (2003). Estimating production functions using inputs to control for unobservables. Review of Economic Studies, 70(2), 317–341. https://doi.org/10.1111/1467-937X.00246
- Liu, C. (2015). Once one paper firm polluting one river, now paper industry in Shandong rebirths from the fire. http://sd.ifeng.com/zbc/detail_2015_08/01/4177531_0.shtml
- Liu, M., Shadbegian, R., & Zhang, B. (2017). Does environmental regulation affect labor demand in China? Evidence from the textile printing and dyeing industry. Journal of Environmental Economics and Management, 86, 277–294. https://doi.org/10.1016/j.jeem.2017.05.008
- Malvis, A., Hodaifa, G., Halioui, M., Seyedsalehi, M., & Sánchez, S. (2019). Integrated process for olive oil mill wastewater treatment and its revalorization through the generation of high added value algal biomass. Water Research, 151, 332–342. https://doi.org/10.1016/j.watres.2018.12.026
- Okereke, C., & McDaniels, D. (2012). To what extent are EU steel companies susceptible to competitive loss due to climate policy? Energy Policy, 46, 203–215. https://doi.org/10.1016/j.enpol.2012.03.052
- Olley, G. S., & Pakes, A. (1996). The dynamics of productivity in the telecommunications equipment industry. Econometrica, 64(6), 1263–1297. https://doi.org/10.2307/2171831
- Porter, M. E., & Van der Linde, C. (1995). Toward a new conception of the environment-competitiveness relationship. Journal of Economic Perspectives, 9(4), 97–118. https://doi.org/10.1257/jep.9.4.97
- Ran, R. (2013). Perverse incentive structure and policy implementation gap in China's local environmental politics. Journal of Environmental Policy & Planning, 15(1), 17–39. https://doi.org/10.1080/1523908X.2012.752186
- Reinstaller, A. (2008). The technological transition to chlorine free pulp bleaching technologies: Lessons for transition policies. Journal of Cleaner Production, 16(1), S133–S147. https://doi.org/10.1016/j.jclepro.2007.10.020
- Requate, T., & Unold, W. (2003). Environmental policy incentives to adopt advanced abatement technology:: Will the true ranking please stand up? European Economic Review, 47(1), 125–146. https://doi.org/10.1016/S0014-2921(02)00188-5
- Shandong Yearbook. (2004, August). Construction and environmental protection. Retrieved October 20, 2021, from https://data.cnki.net/yearbook/Single/N2006042092.
- Shapiro, J. S., & Walker, R. (2018). Why is pollution from US manufacturing declining? The roles of environmental regulation, productivity, and trade. American Economic Review, 108(12), 3814–3854. https://doi.org/10.1257/aer.20151272
- Stankevičius, A., Novikovas, A., Bakaveckas, A., & Petryshyn, O. (2020). EU waste regulation in the context of the circular economy: Peculiarities of interaction. Entrepreneurship and Sustainability Issues, 8(2), 533–545. https://doi.org/10.9770/jesi.2020.8.2(32)
- Topalova, P. (2010). Factor immobility and regional impacts of trade liberalization: Evidence on poverty from India. American Economic Journal: Applied Economics, 2(4), 1–41.
- Tang, H. L., Liu, J. M., & Wu, J. G. (2020). The impact of command-and-control environmental regulation on enterprise total factor productivity: A quasi-natural experiment based on China’s Two Control Zone policy. Journal of Cleaner Production, 254, 120011. https://doi.org/10.1016/j.jclepro.2020.120011
- Van Beveren, I. (2012). Total factor productivity estimation: A practical review. Journal of Economic Surveys, 26(1), 98–128. https://doi.org/10.1111/j.1467-6419.2010.00631.x
- Wang, J., & Song, Y. (2020). Effect of water pollution control on provincial boundaries of River-Director System: Based on the study of the Yangtze River valley in China. Environmental Science and Pollution Research, 27(28), 35217–35227. https://doi.org/10.1007/s11356-020-09684-2
- Wang, K., Yin, H., & Chen, Y. (2019). The effect of environmental regulation on air quality: A study of new ambient air quality standards in China. Journal of Cleaner Production, 215, 268–279. https://doi.org/10.1016/j.jclepro.2019.01.061
- World Bank. (2006). China water quality management: Policy and institutional considerations. World Bank. https://documents.worldbank.org/en/publication/documents-reports/documentdetail/644721468025218243/china-water-quality-management-policy-and-institutional-considerations
- Wurgler, J. (2000). Financial markets and the allocation of capital. Journal of Financial Economics, 58(1–2), 187–214. https://doi.org/10.1016/S0304-405X(00)00070-2
- Xu, M., & Wu, J. (2020). Can Chinese-style environmental collaboration improve the air quality? A quasi-natural experimental study across Chinese cities. Environmental Impact Assessment Review, 85, 106466. https://doi.org/10.1016/j.eiar.2020.106466
- Yang, M., Yang, L., Sun, M., & Wang, Y. (2020). Economic impact of more stringent environmental standard in China: Evidence from a regional policy experimentation in pulp and paper industry. Resources, Conservation and Recycling, 158, 104831. https://doi.org/10.1016/j.resconrec.2020.104831
- Ye, F., Quan, Y., He, Y., & Lin, X. (2021). The impact of government preferences and environmental regulations on green development of China's marine economy. Environmental Impact Assessment Review, 87, 106522. https://doi.org/10.1016/j.eiar.2020.106522
- Yi, M., Fang, X., Wen, L., Guang, F., & Zhang, Y. (2019). The heterogeneous effects of different environmental policy instruments on green technology innovation. International Journal of Environmental Research and Public Health, 16(23), 4660. https://doi.org/10.3390/ijerph16234660
- Zhang, X., & Qu, M. (2020). Impact of environmental regulation on scientific and technological competitiveness of resource-based cities in China based on panel data of 33 resource-based cities. International Journal of Environmental Research and Public Health, 17(24), 9187. https://doi.org/10.3390/ijerph17249187
- Zhao, M., Liu, F., Sun, W., & Tao, X. (2020). The relationship between environmental regulation and green total factor productivity in China: An empirical study based on the panel data of 177 cities. International Journal of Environmental Research and Public Health, 17(15), 5287. https://doi.org/10.3390/ijerph17155287
- Zhao, Q., & Percival, D. (2017). Entropy balancing is doubly robust. Journal of Causal Inference, 5(1), 20160010. https://doi.org/10.1515/jci-2016-0010
Appendix A
Appendix B:
Measurement of main variable TFP
In this section we briefly introduce our measurement of firm-level productivity. Referring to Van Beveren (Citation2012) model specification, we start from a Cobb-Douglas production function:
where
are the physical output of firm
in period
usually measured by deflated sales or value added,
and
represents capital, labor and materials respectively and
represents Hicksian neutral efficiency level. Taking natural logs of the equation results in a linear functional relationship:
where lower case letters refer to natural logarithms and
While measures the mean efficiency level across firms and over time and
is the time and firm specific deviation from that mean, which can then be further decomposed into an observable or predictable and unobservable component:
where
represents firm-level productivity and
is an i.i.d. unexpected deviations. Estimated productivity can then be calculated as follows:
And productivity in levels can be obtained as the exponential of
There will be several methodological problems when we estimate the TFP using traditional methods liking Ordinary Least Squares method (hereafter, OLS). However, the endogeneity or simultaneity problem, that firms are likely to choose input level depending on their productivity, will lead to inconsistent coefficient estimation by OLS. Moreover, there will be selection bias considering the fact that the entry and exit of firms are probably correlated to their productivity level. Both Olley and Pakes (Citation1996) (hereafter OP) and Levinsohn and Petrin (Citation2003) (hereafter LP) have developed a semiparametric estimator that addresses the simultaneity bias by using a proxy variable for unobserved productivity shocks. OP’s proxy variable is firm’s investment decision. However, only firms with positive investment can be included in the OP analysis, as implied by the invertibility condition assumption, LP thus uses intermediate input to control for unobserved productivity to manage the fact that investment is often zero in applied work.
Besides the simultaneity problem, there is also selection bias due to the non-randomness in plants dropping out the sample, which speaks to the fact that less productive firms are more likely to leave the market, thus leaving only the most productive firm in the sample. This will bias the coefficient estimation by correlating the unobserved productivity and fixed input capital, which has its origin in the fact that firms with a higher capital supply are more likely to withstand lower productivity without exiting. This could be resolved by estimating a survival function and then adding the probability of remaining active in the next year to the production estimation procedures.Footnote13
There are other methodological issues unsolved by the OP and LP approaches. As shown by Ackerberg et al. (Citation2006) (hereafter ACF), there will be collinearity between the labor and the non-parametric terms in the first stage which leads the labor coefficient to be unidentified. ACF improves OP and LP by estimating all input coefficients in the second stage and leaving the first stage only to net out the error component in the production function.
In this paper, we use industrial added value to measure output, the number of employees to measure labor, the financially reported intermediate input to measure intermediate input, the net fixed capital to measure capital and calculate investment using perpetual inventory method.Footnote14 We report our primary results based on productivity estimates obtained by LP method with ACF correction and attrition correction. Results applying OP method with ACF correction and attrition correction are consistent. For parsimony, results are not reported and are available upon request.