
 ?Mathematical formulae have been encoded as MathML and are displayed in this HTML version using MathJax in order to improve their display. Uncheck the box to turn MathJax off. This feature requires Javascript. Click on a formula to zoom.
Abstract
This study examined renewable energy, energy efficiency which is very essential to boost up environmental quality. This research also takes other factors which has impact on greenhouse gas emissions in the BRICS nations between 2000 and 2019. On the other hand, this research differs from previous research in that it considers the impact of Energy Efficiency and Renewable Energy Electricity on greenhouse gas emissions in BRICS economies, despite the fact that Energy Efficiency and Renewable Energy Electricity have the greatest impact on greenhouse gas emissions in BRICS economies. The influence of GDP and political risk index on energy-related greenhouse gas emissions also comes under the scope of this study. Further, the order of unit root was determined using cross-sectional dependency and slope heterogeneity. The results were achieved utilising moment quantile regression (MMQ). The analysis shows that GDP causes an increase in Energy-Related Greenhouse Gases (ERGHG) at the 25th, 50th, 75th and 90th quantiles. At the 25th, 50th, 75th and 90th quantiles, however, Energy Efficiency and Renewable Energy Electricity reduce Energy-Related Greenhouse Gases. Furthermore, political risk index reduces Energy-Related Greenhouse Gas emissions. Moreover, policymakers should investigate the asymmetric behaviour of Energy Efficiency, Electricity from Renewable Energy and GDP when adopting BRICS economies energy, environment and growth policies based on empirical data.
JEL CODES:
1. Introduction
Over the last few years, anthropogenic Greenhouse Gas (GHG) emissions have continuouslygrown. As per the United Nations, global total GHG emissions have touched a new high level of 53 Gt CO2 closest approximation around the second half of 2017 (United Nations Environment Programme (UNEP), Citation2018). This is more than double what it was in the year 1970. CO2 is the most prevalent GHG, and it has long been considered that emissions from fossil fuel burning are the most important factor in influencing atmospheric carbon levels. The second most major GHG is methane (CH4), mostly produced by energy and agricultural activities (Montzka et al., Citation2011). China reported nearly a quarter of worldwide overall emissions in 2017, as the world's major emitter of GHG. The majority of its emissions come from the energy sector (BP, Citation2018). Additionally, fuel-burning accounted for 89.5 per cent of CO2 emissions in 2014, whereas energy activities accounted for 48.0 per cent of CH4 emissions (World Bank, Citation2019). As a consequence of industrialisation and growing energy consumption, China's GHG emissions are predicted to continue to climb in the coming years. It is necessary to take strong actions to cut energy-related GHG emissions and bring carbon emissions to a standstill by 2030. The most important consideration in setting environmental goals is to maintain the developing world's EG. The BRICS economies, in particular, are projected as a driving influence in the EG (Shao et al., Citation2019). The GDP of the BRICS economies increased by 6.5 per cent annually from US$1626 billion in 2016 to US$2187 billion in 2018 (World Bank, Citation2018). Despite this, the BRICS economies' rise has resulted in a number of environmental issues, notably more CO2 emissions. CO2 emissions in the BRICS economies increased thrice between 1985 and 2018, from 4901 Mt to 13,768 Mt (World Bank, Citation2018). The BRICS economies have contributed significantly to global economic progress, but they have also contributed to global GHG emissions. China, for example, is the world's second-largest economy, accounting for more than 20% of global GDP, yet it pollutes the environment, producing more than 40% of global CO2 emissions in 2016 (Dong et al., Citation2017). These findings have major implications for reducing greenhouse gas emissions and air pollution (Reilly, Citation2015). As major and emerging countries, the BRICS’ top aim is to work together to meet global carbon-reduction targets (Liu et al., Citation2017). The BRICS economies should prioritise Energy Efficiency (EE) and Renewable Energy (RE) supplies, as well as solutions for reducing emissions without jeopardising EG (de Castro Camioto et al., Citation2016). As a result, RE & ENEF initiatives are crucial for the BRICS economies in reducing GHG emissions and mitigating climate change.
The ENEF is an essential policy instrument for decreasing environmental harm and isolating the ecosystem from GHG emissions. The term ‘energy efficiency factor’ refers to the use of less energy to create the same quantity of output (Özcan & Özkan, Citation2018). Rising ENEF investment has a number of advantages. For example, ENEF projects can improve ecosystem resilience, decrease environmental burdens by reducing emissions, ease reliance on FFs, enhance energy security, mitigate power outages, and boost competition in the industrial sector by cutting expenditures (European Commission, Citation2016). ENEF is also a key component of the BRICS economies' green development programs, aiming to cut CO2 emissions by improving EE (Bayar & Gavriletea, Citation2019). Additionally, fulfilling the Sustainable Development Goals (SDGs) needs the increased usage of ENEF (Shahbaz et al., Citation2019). As a result, ENEF is a critical issue for the BRICS economies to sustain rapid industrialisation, close the energy deficit gap, and limit the consequences of GHG emissions.
In a variety of ways, the study adds to the current body of literature. To begin with, previous research has placed a greater emphasis on EE and RE sources than on carbon emissions. Instead, this article looks at the impact of EE, RE Electricity, and Energy-Related Greenhouse Gases. Second, this is the first research to look at how EE, RE Electricity, and Energy-Related Greenhouse Gases affect the BRICS countries. Third, the study provides critical information for the BRICS nations on the causative link between EE, RE electricity, and ERGHG emissions. These data will aid policymakers in creating effective GHG emission reduction measures. Fourth, the study sheds light on the relationship between income, power generation, and pollution. Fifth, most previous research investigating environmental contamination has employed the EKC hypothesis and the STIRPAT model, ARDL, and CS-ARDL. Safi et al. (Citation2021). The relationship between hydropower output, renewable electricity generation, and CO2 emissions is explored using a novel method that involves the development of both a conceptual and empirical model. The following section is formatted as per, Section 2 delves deeper into prior empirical and theoretical studies. Section 3 delves into the variables and their data sources, the hypothetical framework, specification of the model, and related methodology. Section 4 examines the pragmatic findings. Section 5 concludes the report by outlining key policy suggestions based on the findings.
2. Literature
Numerous studies on different economies and regions over EE, Electricity from RE and ERGHG. In the research that was looked into, various methodologies and various regions were used for the results. Some of the literature is as under.
Akram et al. (Citation2020) investigated EE and RE over carbon emission for BRICS countries utilising Panel data analysis-NPARDL from 1990 till 2014 and their finding shows Asymmetric impacts (SR and LR). Furthermore, Yuan et al. (Citation2011), Shao et al. (Citation2014). Zhou et al. (Citation2018), Wu et al. (Citation2012) examined china for EE and carbon emission, all of them have the same result, and the authors find a negative relation of EE with carbon emission. Moreover, the same negative relationship of EE and carbon emission found by Özbuğday and Erbas (Citation2015) Abban et al. (Citation2020), Iftikhar et al. (Citation2016), Pardo and Moya (Citation2013) by investigating 36 DEE countries, 43 countries; part of Belt and Road Initiative and 26 major economies, respectively.
Many scholars have looked at the relationship between economic development and environmental deterioration, according to Grossman and Krueger (Citation1991) study. Even yet, the majority of previous studies are ambiguous and debatable. Previous studies on the hypothesised linkages among energy usage and environmental degradation have also failed to agree on the causality trend. Destek (Citation2016) utilised asymmetric causation to find the association between RE use and economic growth in recently industrialised countries for the period of 1971 to 2011. According to the statistics, the utilisation of RE has an optimistic influence on actual GDP in South Africa and Mexico. In Turkey, Pata (Citation2018) looked at the dynamic connection between RE, income, and CO2 emissions. According to research, EG has a favourable effect on Carbon emission emissions. Because the effect of RE is modest, Turkey did not achieve the appropriate amount of RE required to reduce emissions. According to Azevedo et al. (Citation2018) CO2 emissions in Russia and Brazil (group 1) are influenced by GDP, but emissions in China, South Africa, and India (group 2) are unaffected by income levels. Increased economic activity has a mixed environmental impact as a result. Balsalobre-Lorente et al. (Citation2019) used panel data from the BRICS economies to assess the influence of AGRs on CO2 emissions. According to the findings, AGR operations had a detrimental impact on the environment.
Furthermore, EC and trading encouraged environmental vulnerabilities. According to Baloch et al. (2019), the presence of NRs aids in the decrease environmental pollution in BRICS economies. Furthermore, except for South Africa, the environmental impact of RE is positive. According to Cheng et al. (Citation2019), environmental factors have varying implications based on present CO2 emissions levels. The authors investigated how CO2 emissions received effect from RE, environmental patent applications, and EG in BRICS nations and discovered that renewable energy reduces CO2 emissions while EG raises them. Pao and Tsai (Citation2011) utilised the panel cointegration approach to analyse environmental quality while changes in FDI and EG in BRIC economies. According to the report, EG is the leading reason for environmental pollution. Lin and Moubarak (Citation2014) looked at RE use's short-run and long-term effects on pollutant emissions. According to the study, China's current level of RE is much below what is required to improve environmental quality. In Pakistan, Zhang et al. (Citation2017) investigated the impact of renewable and nonrenewable energy (NRE) consumption on CO2 emissions. NRE is the leading cause of environmental harm, according to the statistics, but RE helps to reduce it. Dong et al. (Citation2017) examined the link between CO2 emissions and RE in BRICS countries after accounting for natural gas (NG). The study found that using RE and NG increased environmental quality. According to the research, although RE and EG enhanced environmental quality in BRICS nations, NRE and AGRs degraded it.
Wahab et al. (Citation2021) investigated energy productivity with carbon emission for G-7 economies from 1996 to 2017 using CS-ARDL, which is one of the most famous researches in this field. According to S. Wahab's research, energy production has an inverse connection with carbon emissions, just as technical innovation and export have a contrary association amid carbon emissions. Whereas, EG and trade have a favourable relationship with carbon emissions. Furthermore, Wahab et al. (Citation2022) used a spatial Durbin model to analyse RE and financial stability in relation to carbon emissions for BRICS nations from 1995 to 2018. According to S. Wahab's results, RE has counter connection to carbon emissions, and export has an opposite connection with carbon emissions as well. Carbon emissions have a positive relationship with GDP and imports. Furthermore, Ang (Citation2007) examined the vigorous causality between EG, EC, and pollutions using French data between 1960 and 2000 using cointegration approach and ECM. The researcher discovers a long-term association between these three factors. EC and economic development also have a short-run unidirectional causal analysis. Ang uses the DOLS approach to study the dynamic connection in China. According to his research, energy efficiency and trade openness cut carbon emissions. carbon emissions elasticity in association with EC is anticipated to be 1.101–1.175 per cent, whereas CO2 emissions elasticity in relation to trade openness is expected to be 0.144–0.160 per cent.
Moreover, between 1995 and 2008, Robaina-Alves and Moutinho (Citation2014) investigate the decomposition of energy-related GHG emissions in European countries' agriculture. Their findings show that when labour productivity grows (LVA falls), emissions intensity rises as well. The EKC theory, which depicts the relationship between environment and development, is commonly used to investigate the association between economic growth and GHG emissions at the sectoral and regional levels, always in conjunction with panel data and regression analysis (Chang, Citation2015; Li et al., Citation2016; Riti et al., Citation2017). The EKC model is commonly used to explore the impact of different variables on GHG emissions. Decomposition methods may be used to break down changes in energy-related GHG emissions into components, with LMDI being the most desired and commonly used (Wang et al., Citation2017). Energy intensity, energy mix, and industry structure are proven to be the most important influencing factors. The structure of the GDP, the GDP itself, and so on (Jiang et al., Citation2017; Zhang et al., Citation2016). The IPAT has been used in certain research to examine driving variables (Shuai et al., Citation2017; Wang et al., Citation2016) and anticipate future GHG emissions (Shuai et al., Citation2017; Wang et al., Citation2016; Xu et al., Citation2017; Yuan et al., Citation2014; Yue et al., Citation2013). The list has been updated to incorporate population density, technology, and urbanisation.
The research enhances the current scope of literature in many ways. For example, a previous study by Akram et al. (Citation2020), Hassan et al. (Citation2022b), Wahab’s et al. (Citation2022) and Wahab (Citation2021) Yuan et al. (Citation2011), Shao et al. (Citation2014), Wahab et al. (Citation2021) Hassan et al. (Citation2022a) mostly focused on EE and RE rather than carbon emissions. Wu et al. (Citation2012), Özbuğday and Erbas (Citation2015), Zhou et al. (Citation2018), Iftikhar et al. (Citation2016) and Abban et al. (Citation2020). Instead, the influence of EE, RE Electricity, and ERGHG is examined in this article. Second, this is the first research to look at how EE, RE Electricity, and ERGHG affect the BRICS countries. Third, the report provides crucial information on the causal link between EE, RE Electricity, and ERGHG the BRICS countries. This data can assist policymakers in identifying successful approaches for reducing GHG emissions. Fourth, the EKC theory was applied in the majority of previous investigations (Khan et al., Citation2019; Liddle, Citation2017; Rahman et al., Citation2019; Rahman & Ahmad, Citation2019; Zhang & Cheng, Citation2009) and the STIRPAT model (Koçak & Ulucak, Citation2019; Liddle, Citation2011, Citation2013a, Citation2015; Liddle & Lung, Citation2010). The rest of the research is organised in the following manner. This work takes an innovative method to investigate the link between EE, RE Electricity, and ERGHG by constructing a theoretical and empirical model.
3. Methodology
3.1. Data sources and theoretical framework
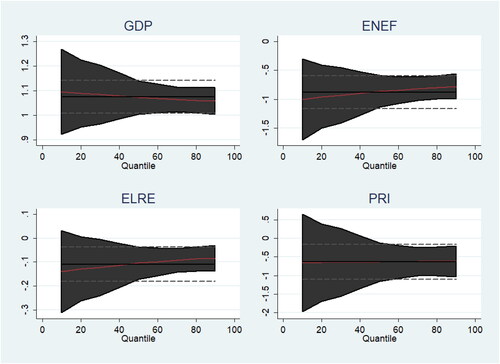
The influence of ERGHG in the presence of EE and RE Electricity is investigated in this study. This study takes a unique approach in that it uses ERGHG and RE Electricity as novel exogenous variables. To obtain the results, this study also employs one of the recently established econometric methodologies. Furthermore, the preferred region as a sample for this is the list of BRICS countries, denoted by I from 2000 to 2019, denoted by ‘t’. The current data are taken for BRICS countries.Footnote1 The present study considered the time period from 2000 to 2019, because of the availability of most recent data for all countries. All the data sets are taken from different web pages for chosen variables. This paper measured our dependent variable ERGHG from OECDFootnote2 denoted by ‘ERGHG’. GDP data are collected from World Bank in US dollars, 2015 and denoted by GDP. EE data is collected from World Bank GDP per unit of energy use (PPP $per kg of oil equivalent) and is denoted ENEF. Production of electricity from sources such as renewable, excluding hydroelectric (% of total) data, is also collected from World Bank and is denoted by ELRE. While Political Risk Index data is collected from PRS data and denoted by PRI.Footnote3 Moreover, for boosting GDP a country starts investments for production to generate more income, during production, they consume more energy and fossils fuel which leads to carbon emissions. Energy-related greenhouse gases are often measured in a region's carbon emission equivalent. In , you can see GDP has a positive relation with ERGHG while ENEF, ELRE and political risk index have a negative relation with ERGHG. The following is the model description:
(1)
(1)
Figure 1. MMQR graph.
Source: Author's own calculations.
The essential econometric equation for this study is given by:
(2)
(2)
The justification for adopting the variables listed in EquationEquation (2)(2)
(2) is based mostly on current and previous literature with a strong theoretical motivation. To boost a country's GDP, they start investing for production to generate more income; during production, they consume more energy and fossils fuel, which leads to carbon emissions. ERGHG are often measured in a region's carbon emission equivalent. When the economy of developing nations grows, the GHG emissions in the economy rise as an outcome of economic activity in the form of a large number of firms that emit GHG emisisons it is expected to have positive relation of GDP with ERGHG as you can see in
All sources of power generation have an influence on our air, water, and land, but the extent of that impact varies. Producing and utilising energy more effectively minimises the quantity of fuel used to create power, as well as the amount of greenhouse gases and other air pollutants generated. Energy efficiency has a variety of environmental advantages. It cuts GHG emissions significantly, both directly from fossil fuel burning or consumption and indirectly through power generation. it is expected to have negative relation of ENEF with ERGHG as you can see in
Furthermore, In any debate regarding climate change, renewable energy is frequently near the top of the priority list of improvements that the globe can make to mitigate the worst effects of rising temperatures. This is because renewable energy sources like solar and wind produce no carbon dioxide or other greenhouse gases, which contribute to global warming. Renewables produce more energy than they consume and release less emissions during their lifespan than other power sources. Renewable energy sources create much lower GHGs than fossil-fuel-fired power plants during their lifetimes. ELRE have also negative relation with ERGHG
Similarly, The political risk index, which has 12 elements, analyses the stability of an economy's political system. The greater the political risk, the weaker or more unstable the government, the lower the education rate, poverty, imbalances in access to resources, a risky investment background, and more corrupt politicians and weak institutions. In general, developing nations with significant political risk face a slew of challenges. More corrupt officials, for example, could weaken environmental rules, resulting in illicit manufacturing and increased emissions (Hassan et al., Citation2022b). While an anti-corruption campaign can serve to reduce corruption and, as a result, environmental degradation (Zhou et al., Citation2020). So the estimated results of our research show that political risk index has also negative relation with ERGHG
3.2. Econometric strategies
3.2.1. Diagnostic check tests
This test's null hypothesis states that the data are normally distributed, whereas the alternative shows that they are not. Furthermore, the Pesaran and Yamagata (Citation2008) test for heterogeneous slope coefficients and the Pesaran (Citation2004) test for cross-sectional dependency should be used. The use of suitable stationary tests is the next step after these problems have been established. This test's null hypothesis states that cross-sections are independent and have no spill-over effects. To put it another way, the countries are self-sufficient and immune to local and global economic shocks. Before employing unit root, cointegration, or long-run estimation, it is crucial to discover these difficulties using the econometric tools outlined above. Otherwise, the results (while disregarding these issues) may consequence in biased results.
3.3. Unit root and cointegration check
Examine this paper for stationarity using the Im, Pesaran, cross-sectional augmented, and Shin (CIPS) approach (Pesaran, Citation2007). The above test may be applied both to cross-sectional dependency and heterogeneous slope coefficients. As a result, this method is preferred over typical panel unit root tests, which solve only one of the two issues mentioned above. The standard equational form for the CIPS test is as follows:
(3) (CADF stands for cross-sectionally augmented dickey fuller)
(3) (CADF stands for cross-sectionally augmented dickey fuller)
Similarly, Westerlund (Citation2007) uses the (ECM) cointegration technique. As previously stated, this test is effective for obtaining efficient findings even when slope coefficients are diverse and cross-sections are dependent. This test employs four statistics: two panel statistics and two mean group statistics. The following are the equational formulations of each mean group and panel group statistic:
(4)
(4)
(5)
(5)
(6)
(6)
(7)
(7)
The method of moments quantile regression (MMQR) is described in detail in the next section.
3.4. Method of moments quantile regression (MMQR)
The data in this study is non-normally distributed, according to the normality check. As a result, Machado and Silva's (Citation2019) Moments Quantile Regression (MMQR) technique may be applied. The fundamental quantile regression method is non-normality resistant, but still it avoids the problem of unobserved variability within the individual panel. In addition, when paired with the Political Risk Index and GDP, this method can be used to quantify the conditionally heterogeneous covariance effect of EE and RE electricity on Energy-Related Greenhouse Gases. Individual effects can now have an effect on the overall distribution (Ike et al., Citation2020). This strategy is equally useful when the model comprises endogenous independent variables (Anwar et al., Citation2021). The generic equational version of the MMQR method is as follows:
(8)
(8)
where,
Contains all independent variables such as EE, Electricity from RE, political risk index and GDP.
) is the quantile distribution of conditional distribution of Energy-Related Greenhouse Gases on
is scalar coefficient indicating quantile fixed effect
for each cross-sections
Moreover,
is for the quantile calculated via
optimisation problem as follows:
(9)
(9)
Here, is check function denoted as,
(A) = (
Furthermore, the robustness tests in this work are carried out using a basic quantile regression technique. In addition, the panel causality test (Dumitrescu & Hurlin, Citation2012) is used to examine the causal impact of EE and RE Electricity on Energy-Related Greenhouse Gases when combined with the Political Risk Index and GDP.
4. Results and discussion
In this section, Stata-13 and Eviews-1 were used to achieve the results. The empirical results acquired using various economic and statistical tests are presented.
empirical results show the average values, volatility, and range for each variable, as well as a normality check. The findings show that Energy-Related Greenhouse Gases, followed by EE, Electricity from RE and GDP are volatile. Moreover, Jarque-Bera (JB) results show that the data is not normally distributed, refuting the null hypothesis of normal distribution for ERGHG, EE, Electricity from RE, and GDP. The results are statistically significant at many levels, notably 1%, 5% and 10% with each variable.
Table 1. Descriptive statistics.
Furthermore, the lower part of with values of 4.764*** and 5.694*** correspondingly shows the empirical outcomes of BRICS economies has heterogeneous slope coefficients as directed by Δ ∼ and Δ ∼ Adjusted. This shows that these countries are not homogenous and there is heterogeneity in the EE, Electricity from RE, GDP, political risk index and ERGHG. Similarly, the cross-section dependence test results are shown in the lower area of the Table. The findings support the BRICS economies' cross-sectional reliance. This implies that in the present day, independence is unusual, and the bulk of economies are interdependent. The results of this study's unit root test are shown in in the following step.
Table 2. Unit root test.
shows the empirical findings of the cross-sectionally augmented Im, Pesaran and Shin (CIPS) test. According to the results of these unit root tests, both unit root tests were performed in two different forms, such as first difference and second difference. Furthermore, case I demonstrates the use of unit root tests with intercept, whereas case 2 includes both intercept and trend. This test's results are unaffected by heterogeneity or cross-sectional dependence. All variables are non-stationary at the level, according to the findings. This suggests that these variables' means aren't returning to zero. Furthermore, the variation in EE, RE Electricity, Energy-Related Greenhouse Gases, GDP and political risk index is not constant. This suggests that these factors vary depending on the cross-section. As a result, all variables are stationary at I(1). A cointegration test is then carried out.
The outcome of a cointegration test based on an error correction mechanism (ECM) is shown in . Gt, Ga, Pt and Pa are the outcomes of the group and pane statistics. shows the results of VECM, which were exclusively used to find long-run causality between the variables. The variable exhibits a long run causal relationship with all other variables, as evidenced by a negative and significant coefficient of ECM. The results show that EE, RE Electricity GDP, political risk index, and Energy-Related Greenhouse Gases have a long-run cointegrating relationship. The results are consistent with those of (Khan et al., Citation2020). On the other hand, this study's output included RE Electricity and Energy-Related Greenhouse Gases in the model. The study then continues to determine the findings of the method of moments quantile regression (MMQR).
Table 3. Cointegration testing.
The findings of the MMQR technique for the 25th, 50th, 75th, and 90th quantiles are shown in . The data show that at the 25th quantile, a 1% increase in GDP results in a 1.085% upsurge in ERGHG. The GDP and environmental pollution relationship is similar with Wahab (Citation2021) and Hassan et al. (Citation2022b), the effect of Energy efficiency increases in all quantiles. The link between ERGHG emissions and Energy efficiency, on the other hand, is negative and meaningful only for higher quantiles (25th to the 90th). This demonstrates that Energy efficiency has a positive impact on lowering energy-related greenhouse gas emissions. As mentioned in % increase in ENEF at the 25th quantile can result in a −0.940 per cent decrease in ERGHG. Alike Wahab et al. (Citation2022), Similar with Wahab et al. (Citation2021) and Chen et al (2018) Similarly, As shown in , the effect of renewable energy increases in all quantiles. The link between energy-related greenhouse gas emissions and renewable energy, on the other hand, is negative and meaningful only for higher quantiles (25th to the 90th). This demonstrates that renewable energy has a positive impact on lowering energy-related greenhouse gas emissions. moreover, a 1% increase in Electricity from ELRE can result in a −0.124 per cent reduction in Energy-Related Greenhouse Gases. Similarly, at the 25th quantile, the average decline in ERGHG due to increasing political risk index is −0.649 per cent.
Table 4. Method of moments quantile regression (MMQR).
Similarly, the output reveals that EE, RE Electricity, and political risk index cause ERGHG to fall at the 50th, 75th, and 90th quantiles. The average rise induced by GDP in the 90th quantile is 1.057 per cent. On the other side, EE resulted in a −0.778 per cent decline in ERGHG. Furthermore, at the 90th quantile, Electricity from RE reduces Energy-Related Greenhouse Gases by −0.083 per cent. Furthermore, the political risk index reduces energy-related greenhouse gas emissions by −0.617% (Hassan et al. 2022). Following the theoretical framework, the total outcome for the 25th, 50th, 75th and 90th quantiles suggests that EE, Electricity from RE, and political risk index cause ERGHG to drop. Furthermore, rising GDP leads to an increase in ERGHG. Furthermore, the results for the 25th, 50th, 75th, and 90th quantiles are statistically significant at the levels of 1%, 5%, and 10%, respectively. further confirms these findings. Furthermore, the findings support the theory of a negative influence of EE, RE Electricity and political risk index on Energy-Related Greenhouse Gases.
displays the quantile regression results, which was used to assess the robustness of the MMQR findings. The empirical results of quantile regression demonstrate a negative link between EE, RE Electricity and political risk index with Energy-Related Greenhouse Gases at the 25th, 50th, 75th and 90th quantiles. Similarly, the robustness output verifies the positive relationship between GDP and ERGHG at the 25th, 50th, 75th, and 90th quantiles. Furthermore, the results are robust and statistically significant at traditional 1%, 5%, and 10%.
Table 5. Robustness check using mean group (MG) test.
The outcome of the Dumitrescu-Hurlin panel causality technique is shown in . In the same way, any policy that focuses on EE, RE, GDP and political risk index will impact ERGHG. Furthermore, there is a bidirectional causal link between ERGHG and EE, RE Electricity, GDP, and political risk index. Similarly, the results are strong and statistically significant at traditional 1%, 5%, and 10%.
Table 6. Dumitrescu-Hurlin panel causality test.
5. Conclusion and policy implication
Many of the researchers have discussed the environmental problems extremely, However, the role Energy efficiency and Electricity production from renewable sources has been overlook in term of Energy-related greenhouse gases. Therefore, the present study examined the impact of EE and RE on energy-related greenhouse gas emissions in the BRICS countries between 2000 and 2019. The influence of GDP and political risk index on energy-related greenhouse gas emissions are also examined in this study. Moment Quantile Regression (MMQR), Pesaran slope heterogeneity, panel unit root and cross-section dependency tests, as well as the Westerlund error correction mechanism (WECM) test and Dumitrescu Hurlin panel causality test, were all employed in the study.
The empirical findings began with the Jarque-Bera (JB) normality test, which revealed that the data is non-normally distributed and that utilising parametric results will result in biased results, recommending the use of the moment quantile regression approach (MMQR). Furthermore, the findings revealed that cross-sections had varied slopes and dependencies. The panel unit root test also confirmed the non-stationarity of data at the level for all variables. The long-run cointegrating relationship between EE, RE Electricity, GDP and PRI with ERGHG has also been proven.
The method of moment quantile regression (MMQR) test confirmed a negative relationship for EE, Electricity from RE and PRI with ERGHG is also confirmed. However, GDP has a positive relationship with ERGHG. The results further show that the magnitude of each coefficient increases with each quantile, i.e., 25th, 50th, 75th, and 90th, respectively. The causality test shows that any policy targeting GDP, EE, Electricity from RE and PRI will affect ERGHG.
In terms of policy implications, the study suggests that the BRICS economies should reduce regulatory hurdles to the use of EE technology to benefit the RE industry in the BRICS countries. Finally, the BRICS countries should expand their RE research and development investment. To meet industrialisation's energy demands while simultaneously lowering energy-related greenhouse gas emissions, they need to invest more in RE. Additionally, policymakers should reconsider the asymmetric behaviour of EE, RE and GDP when establishing energy, environmental, and economic growth policies.
Last, Because the consequences of the study are limited to the BRICS nations, the outcome of this study cannot be applied to other countries. A study like this could be done for a number of other nations. Based on the study's asymmetric findings, future research might delve into the nonlinear behaviour of the energy, growth, and environment nexus. The asymmetric NPARDL may be used in a single framework with quantile regression to integrate regional asymmetries. Furthermore, for each country, we used a short sampling period (2004–2019) in this analysis. This was due to the fact that only annual data was available. A possible extension of this paper would be to look for less readily available quarterly data, which could provide more dependable results with more precision and power.
| Nomenclature | ||
| = | Energy Efficiency | |
| ENEF | = | Energy-Related Greenhouse Gases |
| ERGHG | = | Political Risk Index |
| PRI | = | South Africa, Russia, India, Brazil, China |
| BRICS | = | Electricity from Renewable |
| ELRE | = | Gross Domestic Product |
| GDP | = | Mean Group |
| MG | = | Method of Moments Quantile Regression |
| MMQR | = | |
Disclosure statement
No potential conflict of interest was reported by the authors.
Notes
1 BRICS countries list includes Brazil, Russia, India, China and South Africa.
References
- Abban, O. J., Wu, J., & Mensah, I. A. (2020). Analysis on the nexus amid CO2 emissions, energy intensity, economic growth, and foreign direct investment in Belt and Road economies: Does the level of income matter? Environmental Science and Pollution Research International, 27(10), 11387–11402.
- Akram, R., Majeed, M. T., Fareed, Z., Khalid, F., & Ye, C. (2020). Asymmetric effects of energy efficiency and renewable energy on carbon emissions of BRICS economies: Evidence from nonlinear panel autoregressive distributed lag model. Environmental Science & Pollution Research, 27(15).
- Ang, J. B. (2007). CO2 emissions, energy consumption, and output in France. Energy policy, 35(10), 4772–4778. https://doi.org/10.1016/j.enpol.2007.03.032
- Anwar, A., Siddique, M., Dogan, E., & Sharif, A. (2021). The moderating role of renewable and non-renewable energy in environment-income nexus for ASEAN countries: Evidence from Method of Moments Quantile Regression. Renewable Energy, 164, 956–967. https://doi.org/10.1016/j.renene.2020.09.128
- Azevedo, V. G., Sartori, S., & Campos, L. M. (2018). CO2 emissions: A quantitative analysis among the BRICS nations. Renewable and Sustainable Energy Reviews, 81, 107–115. https://doi.org/10.1016/j.rser.2017.07.027
- Balsalobre-Lorente, D., Gokmenoglu, K. K., Taspinar, N., & Cantos-Cantos, J. M. (2019). An approach to the pollution haven and pollution halo hypotheses in MINT countries. Environmental Science and Pollution Research, 26(22), 23010–23026. https://doi.org/10.1007/s11356-019-05446-x
- Bayar, Y., & Gavriletea, M. D. (2019). Energy efficiency, renewable energy, economic growth: Evidence from emerging market economies. Quality & Quantity, 53(4), 2221–2234. https://doi.org/10.1007/s11135-019-00867-9
- BP. (2018). Statistical review of world energy. https://www.bp.com/en/global/corporate/energy-economics/statistical-review-of-world-energy.html
- Chang, M. C. (2015). Room for improvement in low carbon economies of G7 and BRICS countries based on the analysis of energy efficiency and environmental Kuznets curves. Journal of Cleaner Production, 99, 140–151. https://doi.org/10.1016/j.jclepro.2015.03.002
- Cheng, C., Ren, X., Wang, Z., & Yan, C. (2019). Heterogeneous impacts of renewable energy and environmental patents on CO2 emission – Evidence from the BRIICS. Science of the total environment, 668, 1328–1338.
- de Castro Camioto, F., Moralles, H. F., Mariano, E. B., & do Nascimento Rebelatto, D. A. (2016). Energy efficiency analysis of G7 and BRICS considering total-factor structure. Journal of Cleaner Production, 122, 67–77.
- Destek, M. A. (2016). Renewable energy consumption and economic growth in newly industrialized countries: Evidence from asymmetric causality test. Renewable Energy, 95, 478–484. https://doi.org/10.1016/j.renene.2016.04.049
- Dong, K., Sun, R., & Hochman, G. (2017). Do natural gas and renewable energy consumption lead to less CO2 emission? Empirical evidence from a panel of BRICS countries. Energy, 141, 1466–1478. https://doi.org/10.1016/j.energy.2017.11.092
- Dumitrescu, E. I., & Hurlin, C. (2012). Testing for Granger non-causality in heterogeneous panels. Economic modelling, 29(4), 1450–1460.
- European Commission. (2016). The macroeconomic and other benefits of energy efficiency. European Commission.
- Grossman, G. M., & Krueger, A. B. (1991). Environmental impacts of a North American free trade agreement.
- Hassan, T., Song, H., Khan, Y., & Kirikkaleli, D. (2022a). Energy efficiency a source of low carbon energy sources? Evidence from 16 high-income OECD economies. Energy, 243, 123063. https://doi.org/10.1016/j.energy.2021.123063
- Hassan, T., Song, H., & Kirikkaleli, D. (2022b). International trade and consumption-based carbon emissions: Evaluating the role of composite risk for RCEP economies. Environmental Science and Pollution Research, 29(3), 3417–3437. https://doi.org/10.1007/s11356-021-15617-4
- Iftikhar, Y., He, W., & Wang, Z. (2016). Energy and CO2 emissions efficiency of major economies: A non-parametric analysis. Journal of Cleaner Production, 139, 779–787.
- Ike, G. N., Usman, O., & Sarkodie, S. A. (2020). Testing the role of oil production in the environmental Kuznets curve of oil producing countries: New insights from method of moments quantile regression. Science of the Total Environment, 711, 135208.
- Jiang, J., Ye, B., Xie, D., & Tang, J. (2017). Provincial-level carbon emission drivers and emission reduction strategies in China: Combining multi-layer LMDI decomposition with hierarchical clustering. Journal of Cleaner Production, 169, 178–190.
- Khan, Z., Hussain, M., Shahbaz, M., Yang, S., & Jiao, Z. (2020). Natural resource abundance, technological innovation, and human capital nexus with financial development: A case study of China. Resources Policy, 65, 101585. https://doi.org/10.1016/j.resourpol.2020.101585
- Khan, Z., Sisi, Z., & Siqun, Y. (2019). Environmental regulations an option: Asymmetry effect of environmental regulations on carbon emissions using non-linear ARDL. Energy Sources, Part A: Recovery, Utilization, and Environmental Effects, 41(2), 137–155.
- Koçak, E., & Ulucak, Z. Ş. (2019). The effect of energy R&D expenditures on CO2 emission reduction: Estimation of the STIRPAT model for OECD countries. Environmental Science and Pollution Research, 26(14), 14328–14338.
- Li, T., Wang, Y., & Zhao, D. (2016). Environmental Kuznets curve in China: New evidence from dynamic panel analysis. Energy Policy, 91, 138–147.
- Liddle, B. (2011). Consumption-driven environmental impact and age structure change in OECD countries: A cointegration-STIRPAT analysis. Demographic Research, 24, 749–770. https://doi.org/10.4054/DemRes.2011.24.30
- Liddle, B. (2013a). Population, affluence, and environmental impact across development: Evidence from panel cointegration modeling. Environmental Modelling & Software, 40, 255–266.
- Liddle, B. (2015). What are the carbon emissions elasticities for income and population? Bridging STIRPAT and EKC via robust heterogeneous panel estimates. Global Environmental Change, 31, 62–73. https://doi.org/10.1016/j.gloenvcha.2014.10.016
- Liddle, B. (2017). The urbanization, development, environment, and inequality nexus: Stylized facts and empirical relationships. think-asia.org.
- Liddle, B., & Lung, S. (2010). Age-structure, urbanization, and climate change in developed countries: revisiting STIRPAT for disaggregated population and consumption-related environmental impacts. Population and Environment, 31(5), 317–343. https://doi.org/10.1007/s11111-010-0101-5
- Lin, B., & Moubarak, M. (2014). Renewable energy consumption–economic growth nexus for China. Renewable and Sustainable Energy Reviews, 40, 111–117.
- Liu, X., Zhang, S., & Bae, J. (2017). The nexus of renewable energy-agriculture-environment in BRICS. Applied energy, 204, 489–496.
- Machado, J. A., & Silva, J. S. (2019). Quantiles via moments. Journal of Econometrics, 213(1), 145–173.
- Montzka, S. A., Dlugokencky, E. J., & Butler, J. H. (2011). Non-CO2 greenhouse gases and climate change. Nature, 476(7358), 43–50. https://doi.org/10.1038/nature10322
- Özbuğday, F. C., & Erbas, B. C. (2015). How effective are energy efficiency and renewable energy in curbing CO2 emissions in the long run? A heterogeneous panel data analysis. Energy, 82, 734–745. https://doi.org/10.1016/j.energy.2015.01.084
- Özcan, K. M., & Özkan, A. U. (2018). The relationship between energy efficiency and economic performance in G20 countries. Topics in Middle Eastern and African Economies Proceedings of Middle East Economic Association, 20(1), 1–20.
- Pao, H. T., & Tsai, C. M. (2011). Modeling and forecasting the CO2 emissions, energy consumption, and economic growth in Brazil. Energy, 36(5), 2450–2458.
- Pardo, N., & Moya, J. A. (2013). Prospective scenarios on energy efficiency and CO2 emissions in the European Iron & Steel industry. Energy, 54, 113–128. https://doi.org/10.1016/j.energy.2013.03.015
- Pata, U. K. (2018). Renewable energy consumption, urbanization, financial development, income and CO2 emissions in Turkey: Testing EKC hypothesis with structural breaks. Journal of Cleaner Production, 187, 770–779. https://doi.org/10.1016/j.jclepro.2018.03.236
- Pesaran, M. H. 2004. General diagnostic tests for cross section dependence in panels. University of Cambridge, Faculty of Economics, Cambridge Working Papers in Economics No. 0435.
- Pesaran, M. H. (2007). A simple panel unit root test in the presence of cross‐section dependence. Journal of applied econometrics, 22(2), 265–312. https://doi.org/10.1002/jae.951
- Pesaran, M. H., & Yamagata, T. (2008). Testing slope homogeneity in large panels. Journal of Econometrics, 142(1), 50–93.
- Rahman, Z. U., & Ahmad, M. (2019). Modeling the relationship between gross capital formation and CO2 (a)symmetrically in the case of Pakistan: An empirical analysis through NARDL approach. Environmental Science and Pollution Research, 26(8), 8111–8124.
- Rahman, Z. U., Cai, H., & Ahmad, M. (2019). A new look at the remittances-FDI-energy-environment nexus in the case of selected Asian nations. The Singapore Economic Review, 1–19.
- Reilly, J. (2015). Energy and development in emerging countries. Revue d'economie du developpement, 23(HS), 19–38.
- Riti, J. S., Song, D., Shu, Y., & Kamah, M. (2017). Decoupling CO2 emission and economic growth in China: Is there consistency in estimation results in analyzing environmental Kuznets curve? Journal of Cleaner Production, 166, 1448–1461.
- Robaina-Alves, M., & Moutinho, V. (2014). Decomposition of energy-related GHG emissions in agriculture over 1995–2008 for European countries. Applied energy, 114, 949–957. https://doi.org/10.1016/j.apenergy.2013.06.059
- Safi, A., Chen, Y., Wahab, S., Ali, S., Yi, X., & Imran, M. (2021). Financial instability and consumption-based carbon emission in E-7 countries: The role of trade and economic growth. Sustainable Production and Consumption, 27, 383–391.
- Shahbaz, M., Balsalobre-Lorente, D., & Sinha, A. (2019). Foreign direct Investment–CO2 emissions nexus in Middle East and North African countries: Importance of biomass energy consumption. Journal of cleaner production, 217, 603–614.
- Shao, C., Guan, Y., Wan, Z., Chu, C., & Ju, M. (2014). Performance analysis of CO2 emissions and energy efficiency of metal industries in China. Journal of environmental management, 134, 30–38.
- Shao, Q., Wang, X., Zhou, Q., & Balogh, L. (2019). Pollution haven hypothesis revisited: A comparison of the BRICS and MINT countries based on VECM approach. Journal of Cleaner Production, 227, 724–738.
- Shuai, C., Shen, L., Jiao, L., Wu, Y., & Tan, Y. (2017). Identifying key impact factors on carbon emission: Evidences from panel and time-series data of 125 countries from 1990 to 2011. Applied energy, 187, 310–325. https://doi.org/10.1016/j.apenergy.2016.11.029
- United Nations Environment Programme (UNEP). 2018. Emissions gap report 2018. https://www.unenvironment.org/resources/emissions-gap-report-2018
- Wahab, S. (2021). Does technological innovation limit trade-adjusted carbon emissions? Environmental Science and Pollution Research, 1–11.
- Wahab, S., Imran, M., Safi, A., Wahab, Z., & Kirikkaleli, D. (2022). Role of financial stability, technological innovation, and renewable energy in achieving sustainable development goals in BRICS countries. Environmental Science and Pollution Research, 1–12.
- Wahab, S., Zhang, X., Safi, A., Wahab, Z., & Amin, M. (2021). Does energy productivity and technological innovation limit trade-adjusted carbon emissions? Economic Research-Ekonomska Istraživanja, 34(1), 1896–1912. https://doi.org/10.1080/1331677X.2020.1860111
- Wang, S., Fang, C., & Wang, Y. (2016). Spatiotemporal variations of energy-related CO2 emissions in China and its influencing factors: An empirical analysis based on provincial panel data. Renewable and Sustainable Energy Reviews, 55, 505–515. https://doi.org/10.1016/j.rser.2015.10.140
- Wang, W., Li, M., & Zhang, M. (2017). Study on the changes of the decoupling indicator between energy-related CO2 emission and GDP in China. Energy, 128, 11–18. https://doi.org/10.1016/j.energy.2017.04.004
- Westerlund, J. (2007). Testing for error correction in panel data. Oxford Bulletin of Economics and statistics, 69(6), 709–748. https://doi.org/10.1111/j.1468-0084.2007.00477.x
- World Bank. (2017). World development report 2018: Learning to realize education's promise. The World Bank. https://doi.org/10.1596/978-1-4648-1096-1
- World Bank. (2019). World Bank database: Indicators, climate change. https://data.worldbank.org/
- Wu, F., Fan, L. W., Zhou, P., & Zhou, D. Q. (2012). Industrial energy efficiency with CO2 emissions in China: A nonparametric analysis. Energy Policy, 49, 164–172. https://doi.org/10.1016/j.enpol.2012.05.035
- Xu, L., Chen, N., & Chen, Z. (2017). Will China make a difference in its carbon intensity reduction targets by 2020 and 2030? Applied Energy, 203, 874–882. https://doi.org/10.1016/j.apenergy.2017.06.087
- Yuan, J., Kang, J., Yu, C., & Hu, Z. (2011). Energy conservation and emissions reduction in China – Progress and prospective. Renewable and Sustainable Energy Reviews, 15(9), 4334–4347. https://doi.org/10.1016/j.rser.2011.07.117
- Yuan, J., Xu, Y., Hu, Z., Zhao, C., Xiong, M., & Guo, J. (2014). Peak energy consumption and CO2 emissions in China. Energy Policy, 68, 508–523. https://doi.org/10.1016/j.enpol.2014.01.019
- Yue, T., Long, R., Chen, H., & Zhao, X. (2013). The optimal CO2 emissions reduction path in Jiangsu province: An expanded IPAT approach. Applied Energy, 112, 1510–1517. https://doi.org/10.1016/j.apenergy.2013.02.046
- Zhang, B., Wang, B., & Wang, Z. (2017). Role of renewable energy and non-renewable energy consumption on EKC: Evidence from Pakistan. Journal of Cleaner Production, 156, 855–864.
- Zhang, W., Li, K., Zhou, D., Zhang, W., & Gao, H. (2016). Decomposition of intensity of energy-related CO2 emission in Chinese provinces using the LMDI method. Energy Policy, 92, 369–381. https://doi.org/10.1016/j.enpol.2016.02.026
- Zhang, X. P., & Cheng, X. M. (2009). Energy consumption, carbon emissions, and economic growth in China. Ecological Economics, 68(10), 2706–2712. https://doi.org/10.1016/j.ecolecon.2009.05.011
- Zhou, M., Wang, B., & Chen, Z. (2020). Has the anti-corruption campaign decreased air pollution in China?. Energy Economics, 91, 104878. https://doi.org/10.1016/j.eneco.2020.104878
- Zhou, N., Khanna, N., Feng, W., Ke, J., & Levine, M. (2018). Scenarios of energy efficiency and CO2 emissions reduction potential in the buildings sector in China to year 2050. Nature Energy, 3(11), 978–984. https://doi.org/10.1038/s41560-018-0253-6