
Abstract
Climate change impact on sovereign debt management has become an issue of great concern. The aim of this paper is to analyse the changes in the traditional approach of sovereign debt managers in the face of the pursued climate policy and different scenarios of climate liabilities for 2050. We follow a novel three-fold research approach: 1) assessment of the estimated level of current climate liabilities based on the Fiscal Risk Matrix; 2) performing forward-looking climate debt projections over the timeframe 2025-2050 for the EU countries; 3) conducting case study research on EU countries, to identify the sovereign climate debt management activities undertaken so far and to define a series of good-practice guidelines. Findings indicate a growing role of the climate financial mechanisms in sovereign debt management. In particular, our climate scenario approach reveals those scenarios in which a country’s fiscal position indicators are more vulnerable from the standpoint of rising public expenditure due to the country’s inability to manage CO2 gas emissions. Each country is responsible for its climate pathway by 2050 and this will be mainly determined by the timeliness, efficacy and appropriateness of the public policies and measures implemented to mitigate climate change.
1. Introduction
Sovereign debt management is a key area of public finance, linking the public budget needs with the financial sector in terms of external (market) financing. Thus, the main goal of debt managers is to cover the borrowing requirements of public authorities, taking into account cost minimisation and prudent management of risks associated with incurring debt (Missale, Citation1999). These standards are also introduced as international practical guidelines recommended by the World Bank and the International Monetary Fund, providing a basis for assessing the effectiveness of public debt management in countries around the world (World Bank and IMF, 2002; 2019).
In sovereign debt management, there are generally two approaches, depending on the scope of tasks to be performed and the type of dominant debt instruments, i.e. the portfolio approach and the balance sheet approach (Allen et al., Citation2002; Bloomestein, Citation2006). The portfolio approach relates mainly to decision making in the scope of managing a portfolio of treasury securities (bills and bonds) with particular emphasis on limiting market risk. The balance sheet approach, on the other hand, is used by debt managers, who in their decisions also consider the broad items of assets and liabilities (Cassard and Folkerts-Landau, Citation2000).
However, regardless of the approach used, the cost and risk trade-off is the most important basis for funding decisions by debt managers.
In this context, views have recently emerged that sovereign debt managers should increasingly incorporate climate change financing, including climate risk, into their strategies as an important determinant of investment decisions by many investors, including banks. These views are based on several considerations. One is the adoption of new international strategies to combat climate change (including those agreed at international Climate SummitsFootnote1 and in the European Union within the European Green Deal). Another driver is the introduction of regulatory obligations for financial institutions in the area of environmental risk management and Environment-Social-Governance (ESG) reporting. Moreover, within the framework of the Action Plan: Financing Sustainable Growth, the European Commission adopted important objectives, in which it postulates redirecting a part of budget resources to support sustainable development and including sustainable development in risk management based on the so-called "green taxonomy". All these regulatory solutions will have a significant impact on the new requirements for sovereign asset and debt management.
The major contribution of our paper is to identify a suitable approach to be followed by sovereign debt managers in terms of strategies, tasks, instruments, institutional and communication solutions in the face of the pursued climate policy and different scenarios of climate liabilities for 2050. Specific research questions to be addressed in this paper are: i) how should climate debt be incorporated into the current, globally-accepted classification of government liabilities?; ii) what will the climate debt path look like by 2050, conditioned by the occurrence of various climate scenarios?; iii) how should sovereign debt management change in order to address the climate debt challenges?
We develop a complementary three-fold analytical framework that relies on three pillars: 1) assessment of the estimated level of current climate liabilities, based on the Fiscal Risk Matrix methodology; 2) performing forward-looking climate debt projections over the timeframe 2025-2050 for the EU member countries; 3) conducting case study research related to the sovereign climate debt management activities undertaken so far by debt managers in the 27 European Union member states. The first issue of novelty brought by our paper is the integration of climate debt into the range of direct and explicit liabilities. In this regard, our analytical approach has the benefit of relying on the internationally agreed and implemented Fiscal Risk Matrix methodology, to increase decision makers’ understanding and acceptance on the positioning of climate liabilities in the broader context of traditional forms of liabilities.
The second novel feature resides in computing the future climate debt (as a share of national GDP) to be borne by each EU country until 2050, by following the climate path hypotheses considered by the Network for Greening the Financial System’s climate scenarios. This is the only forward-looking approach of its kind in existing literature. We substantiate our approach in the consensus that the world is witnessing nowadays a critical juncture in terms of climate mitigation action policies and strategies. Specifically, it is globally acknowledged that climate pathways are surrounded by uncertainty and could move in materially different directions: from a successful transition to net-zero emissions by 2050, to a Hot House World scenario with a global warming trend of 3 °C or even more by 2100. The findings obtained under the various climate scenarios allow the ranking of EU countries in terms of their climate change mitigation performance, enhance the comparability of results across countries and may provide an awareness raising signal for decision makers, to better understand future risks and exposures to climatic challenges.
The case study approach provides new insights to expanding the scope of traditional sovereign debt management by including climate debt in the regular country-level debt sustainability analyses. Our arguments are substantiated in the lack of common, harmonised guidelines at the European level regarding the sovereign climate debt management in both broad and narrow terms. Thus, our contribution to existing literature is the development of a series of proposals for the management of the sovereign debt that accounts for the inclusion of climate debt.
Another original feature of this paper is that we gathered qualitative and quantitative data from manifold sources. Apart from using Eurostat and OECD data, we performed ample desk research of official documents available on the websites of sovereign debt management institutions (ministries, agencies, central banks) from 2019-2021 and counted the frequency of occurrence of climate change-related words. Additionally, this is the first paper that comprehensively employs all the six climate scenarios developed by the Network for Greening the Financial System (NGFS).
The paper is structured as follows. In section two we classify and estimate the current level of climate liabilities based on two methodologies: the Fiscal Risk Matrix and the proposed methodology for calculating climate debt including the maturity term (as the accepted climate goal). In the third section we perform a forward-looking analysis, by relying on the newest set of climate scenarios developed by the Network for Greening the Financial System. A series of climate debt projections are conducted over the timeframe 2025-2050 for the EU member countries, by using the NGFS’s projected carbon price and the projected CO2 emissions/year which are specific to each of the six scenarios. In the fourth section we present the results of the research conducted on a group of European Union member states in which, due to the EU regulatory changes (European Green Deal), the motivation to correct their approach to sovereign debt management is expected to be relatively high. The last section concludes.
2. Sovereign climate debt in the face of the Fiscal Risk Matrix – the case of EU member states
There is currently no clear definition of climate debt in monetary terms. However, climate debt can already be identified as one of the important government liabilities, which have and will have in the future an impact on the fiscal risk of the public budget in all countries across the world. To determine the scale of fiscal risk generated by climate debt, it is worth indicating its position in the classification of total government liabilities. For this purpose, we use the methodology of the Fiscal Risk Matrix developed at the World Bank in 1989 (Polackova, Citation1998), which distinguishes four basic groups of total government liabilities according to their characteristics based on the legal (contractual) basis and the probability of occurrence of a given event.Footnote2
According to the above methodology, climate debt (interchangeably regarded as climate liabilities) is classified as contingent and implicit (called as the traditional approach). This is the result of the original approach in assessing fiscal risk, due to the fact that environmental events are unpredictable in their nature and therefore also difficult to plan for in the public budget on an annual basis ().
Table 1. The Fiscal Risk Matrix – major instruments of total government liabilities.
However, we take a critical approach to the above division, particularly in the context of European Union analyses. This position stems from two important developments in the estimation of fiscal risks. First, according to international scientific research (IPCC Citation2021), climate change will be permanent and probably worsening, with differences in scale depending on the region of the world, which means that the observed effects of environmental change cannot be regarded only as incidental anymore. Secondly, at present, the fight against climate change forms the basis for the formulation of many strategic documents and legal acts at both the EU and Member State levels, which obliges public authorities to finance climate liabilities. Moreover, the adopted European Green Deal (EC Citation2019) sets a deadline of 2050 for reaching the climate target of net zero emissions. In this way, the European climate goal can be treated as the maturity term. This assessment therefore implies a change in the nature of climate debt to direct and explicit (proposed approach in ).
These assumptions also influenced the methodology adopted in the paper for calculating climate debt. The climate liabilities are proxied as the amount of the carbon emissions expressed in millions of US dollars, illustrating the value of the pollution generated through CO2 emissions that the originating country has to pay for. For the computation of the climate debt, we rely on the carbon price, expressed as US$/t CO2, and on the level of current CO2 emissions/year as published by Eurostat. Our analytical approach has the lower end estimate of the carbon costs in 2020 as a reference, which is of US$40/tCO2 as established by the High-Level Commission on Carbon Prices report (Citation2017). This threshold level is in line with the average estimate adopted by international organisationsFootnote3 and is used in our computations to measure the current EU country-level climate debtFootnote4.
Based on the adopted methodological assumptions, it is possible to assess the scale and share of climate debt in the total structure of total government liabilities for individual EU member states. Although, from the accounting point of view, such presentation may raise doubts, it offers the possibility to assess the financial impact on the public budget and enables the estimation of the total level of fiscal risk. As can be seen from the presented data (), climate debt is estimated for all member states, and depending on the country it ranks third or fourth in the hierarchy of total liabilities.
Figure 1. Total sovereign liabilities in EU member states (amount and structure)* in 2018.
* Note: data access restrictions set out in a footnote 2
Source: own computations based on Eurostat data and (Boitan and Marchewka-Bartkowiak, Citation2021)
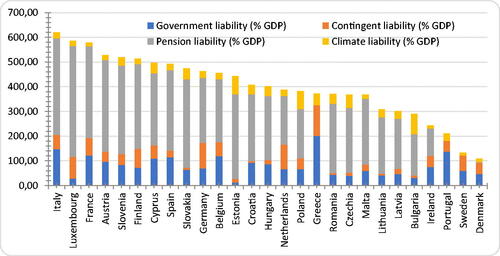
The highest level most often concerns pension liabilities calculated using the “accrued-to-date liabilities” methodology. For example, in 2018, the average level of climate debt was 34% of GDP, with government debt at 79% of GDP, contingent liabilities at 45% of GDP and pension liabilities at 271% of GDP.
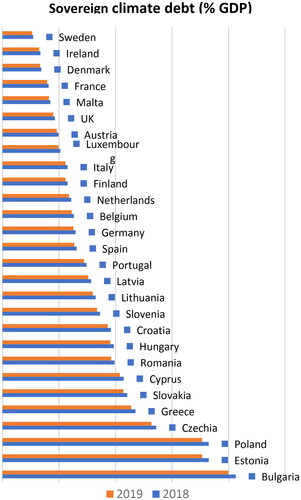
From the sovereign debt management perspective, however, it is worth pointing out the relationship between government (market-based) debt and climate debt ( and ). As can be seen from the presented data, climate debt for 2018 and 2019 was on average about a half of the value of government debt calculated in relation to GDP for the EU member states. It should be made clear at this point that climate debt is calculated as a liability for the public authorities of a country, but with possible diversification of financing, i.e. public and private financing. However, the reduction of carbon emissions in terms of the private sector, which leads to the fulfilment of the state's commitments, should be supported, motivated, and monitored by the government.
Figure 2. Sovereign market-based debt.
Source: own computations based on Eurostat data
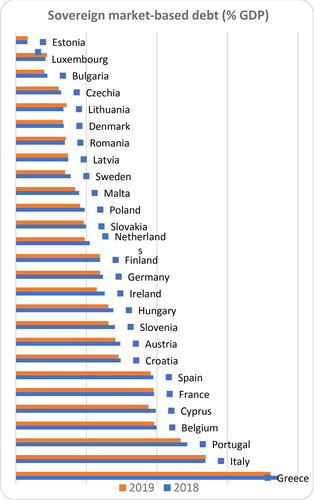
Figure 3. Sovereign climate debt.
Source: own computations based on Eurostat data
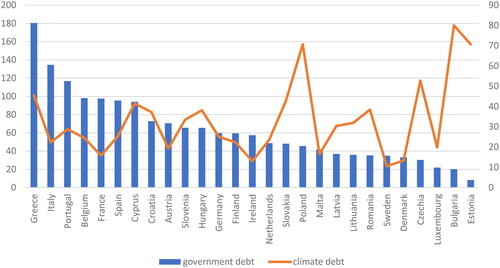
From the perspective of individual Member States, it is also worth noting that euro area member states are often characterised by a relatively higher ratio of marked-based debt as a % of GDP to climate burdens (e.g. Greece, Italy, Portugal, Belgium, France, Spain). In contrast, as for countries outside the Eurozone, particularly in Central and Eastern Europe, the relationship is in many cases reversed (e.g. Bulgaria, the Czech Republic, Poland, Romania, Slovakia) ().
Figure 4. The relation between sovereign debt (left axis) and climate debt (right axis) as % GDP in 2019.
Source: own computations based on Eurostat data
Thus, as the analysis shows, climate commitments are an important part of total government liabilities. Moreover, due to their new features, these liabilities should require greater attention from public debt managers and possibly undergo some changes at the strategic, instrumental, and institutional levels, as will be discussed later in this article.
3. Projections of the sovereign climate debt path till 2050 – the case of EU member states
To increase decision maker awareness on the subsequent potential costs to be supported by the national economy (represented by a climate debt), in case of failure in meeting the carbon-neutral economy till 2050 as stated by the European Green Deal, we performed a scenario-based forward-looking analysis.
We started from the premise that the transition process towards a carbon-neutral economy can take different paths, with different climate costs, depending on the strength and timeliness of the national policies adopted for mitigating climate change. The most suitable analytical tool is to conduct a scenario analysis due to its manifold advantages, such as: flexible methodological framework, forward-looking nature in making assumptions about the future trends, and hypothetical but plausible scenario design (ECB, Citation2021a).
In conducting our analysis, we rely on the climate scenarios introduced in June 2020 and updated in 2021 by the Network for Greening the Financial System (NGFS – Bertram et al. Citation2021). They are already referred to in recent policy reports and analyses published by the European Central Bank (ECB, Citation2021a; ECB, Citation2021b) or research centres (Robins et al., Citation2021), so they are relevant and provide a common basis for interested authorities (such as central banks, governments, etc.) in integrating climate risks into their decision-making process related to the monitoring of the financial and macro-economic fundamentals.
The NGFS reference scenarios consist of 6 climate scenarios which are classified in 3 main categories (orderly, disorderly, and Hot House World) based on a different set of assumptions for how climate policies, gas emissions, and temperatures will evolve. Their purpose is to estimate how different levels of climate change mitigation could be achieved among given countries, under specific climate outcomes and socio-economic background assumptions. Importantly, the outcomes of the 6 scenarios (in terms of carbon emissions and carbon price) vary according to how the design of climate mitigation policy measure and implementation might evolve on both the short and long term, in close connection with technological progress, such as the availability of carbon dioxide removal technologies. These policies can be introduced either immediately, later, or remain insufficient in meeting the European Green Deal temperature target.
The main source of our data is the NGFS database. For the computation of the estimated climate debt, we relied on the projected carbon price, expressed as US$/t CO2, and on the projected CO2 emissions/year, data being reported for every 5 years. The levels of both indicators are estimated distinctly in each NGFS climate scenario, in a cross-country manner. The long-term forecast of the real GDP until 2050 is extracted from the OECD database (OECD, Citation2018). It is estimated by relying on a combination of model-based analyses and expert judgement, to assess the future path of the economic climate in individual countries.
The final output of our computations, represented by the share of climate debt in national GDP for EU member states in each of the six climate scenarios, is presented in more details in Appendix 4. Our approach is to discuss the prospects for this climate debt under various climate scenarios developed for a timeframe ranging between 2025–2050, by estimating the future climate debt levels for different carbon prices and CO2 emissions, with a focus on EU member states.
In the following part, to gain an illustrative overview of the climate debt size (as % of GDP) to be potentially borne by EU countries in the next decades, in direct connection with their efforts for achieving carbon neutrality, in we show a graphical ranking of countries in terms of the cumulative climate debt they will face till 2050. When a country achieves a status of negative CO2 emitter, it means that it is a best performer as it succeeds in absorbing more CO2 that it emits. Consequently, its climate debt will be zero. If it is still emitting more CO2 that it absorbs, then it qualifies for paying a carbon cost for each ton emitted. This reasoning is exhibited also through the codes of colour used in every figure: the missing colour for a given country indicates that, for the particular year the colour is assigned to, the country has achieved carbon neutrality.
and correspond to a climate debt projection (as % of GDP) computed for the orderly scenarios, which assume that climate policies are introduced early by each country and become gradually more stringent. Consequently, the process of transition to a low carbon economy takes place in an orderly manner and appropriate policies are implemented immediately. In this scenario, the carbon emissions prices increase gradually, allowing companies to adapt their business models and develop green technologies, and households to change their consumption behaviours into one that is environmental-friendly (ECB, Citation2021a).
Figure 5. Estimations of the climate debt-to-GDP ratio for the Below 2 °C scenario.
Note: Bulgaria, Cyprus, Croatia, and Malta were not considered, due to the lack of available data for each benchmark year under analysis
Source: own elaboration
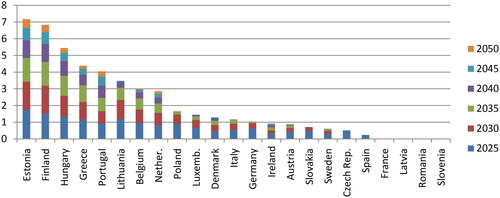
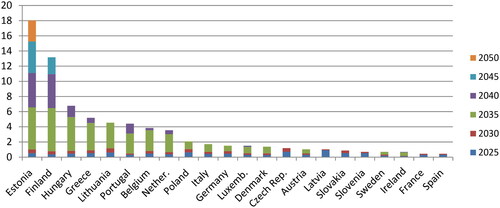
Figure 6. Estimations of the climate debt-to-GDP ratio for the Net Zero 2050 scenario.
Note: Bulgaria, Cyprus, Croatia, and Malta were not considered, due to the lack of available data for each benchmark year under analysis
Source: own elaboration
In the Below 2 °C scenario (see ) the stringency of climate policies increases gradually, giving a 67% chance of limiting global warming to below 2 °C until 2050 (Bertram et al., Citation2021).
The figures indicate both the cumulative value and the annual value to be recorded by the climate debt-to-GDP ratio. In the Below 2 °C scenario, most countries are expected to witness larger values of the climate debt in GDP in 2025 and 2030, while Estonia, Finland, Hungary, Greece, and Portugal will face a climate debt burden in every benchmark-year considered.
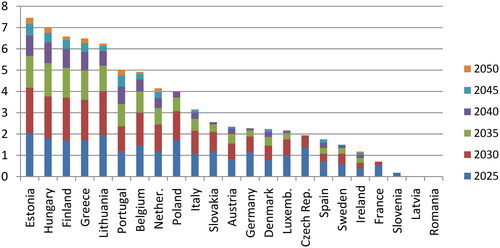
The Net Zero 2050 scenario () envisages limiting global warming to 1.5 °C through the adoption of stringent climate policies and technological innovation, in order to reach global net zero CO2 emissions by 2050. According to European Central Bank (Citation2021a), this scenario is the most compatible with the long-term temperature goal established by the European Green Deal.
The projections for the Net Zero 2050 scenario are similar with the preceding one regarding the EU countries exposed to the highest cumulative values of the climate debt in GDP (Estonia, Finland, Hungary, Greece, and Portugal). In terms of annual climate debt levels, the year 2025 will be the costliest for the majority of EU countries considered.
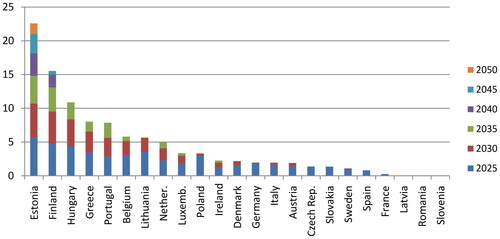
and correspond to a climate debt projection (as % of GDP) computed for the disorderly scenarios, which are characterised by higher transition risks due to delays in the implementation of climate public policies or divergences across countries and economic sectors. Hence, the prospects for carbon dioxide removal are slow. A direct effect of this delay period is the need for implementing more stringent policies and measures from 2030 onwards, triggering a sharp increase of the carbon prices till 2050. The report published by the European Central Bank (Citation2021a) explains that the late and abrupt implementation of policy measures for fighting climate change will still allow for the 2 °C target envisaged by the Paris Agreement to be met, but with a sharper upward revision of the carbon emissions price.
Figure 7. Estimations of the climate debt-to-GDP ratio for the Divergent Net Zero scenario.
Note: Bulgaria, Cyprus, Croatia, and Malta were not considered, due to the lack of available data for each benchmark year under analysis
Source: own elaboration
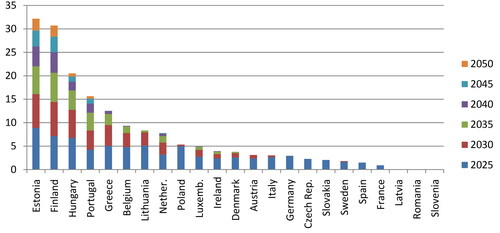
Figure 8. Estimations of the climate debt-to-GDP ratio for the Delayed Transition scenario.
Note: Bulgaria, Cyprus, Croatia, Malta, and Romania were not considered, due to the lack of available data for each benchmark year under analysis
Source: own elaboration
In the Divergent Net Zero scenario (see ) countries are expected to reach net-zero CO2 emissions around 2050, but at the expense of higher costs due to divergent policies introduced across polluting sectors, leading to a quicker phase out of oil use (Bertram et al., Citation2021). To meet the climate targets, carbon prices may jump up to 528 US$/tonne of CO2 by 2050 leading to higher transition risk faced by EU countries.
The ranking of the most exposed EU countries at larger values of the climate debt/GDP is dominated by the same countries as in the orderly scenarios: Estonia, Finland, Hungary, Greece, and Portugal. In terms of climate debt annual levels, the year 2025 will be the costliest for most EU countries considered, while few countries will face similar costs also in 2030 and 2035.
The Delayed Transition scenario () assumes that the annual CO2 emissions do not decrease until 2030. On the contrary, during 2020–2030 countries will experience a "fossil recovery” and will follow the trajectory of the current policies scenario until 2030. Starting with 2030 countries will begin to implement stronger policies for limiting global warming to below 2 °C. To meet the climate targets, carbon prices are expected to increase up to 1,058 US$/tonne of CO2 by 2050.
Under this scenario, the highest costs incurred by meeting the climate target will be borne by most EU countries in 2035. Estonia will be the only country failing to meet the target by 2050. A common finding is that in both orderly and disorderly scenarios Estonia and Finland persistently occupy the first two positions in the highest climate debt/GDP cumulative values by 2050.
and illustrate the climate debt projection (as % of GDP) computed for the Hot House World scenarios. These scenarios start from the premise that some climate policies and measures are partially implemented in some economic sectors and countries, but at the global level these efforts are insufficient to determine significant reversal of global warming. The main result of the occurrence of these scenarios relies in the manifestation of severe physical risks, some of them irreversible such as sea-level rise (Bertram et al., Citation2021).
Figure 9. Estimations of the climate debt-to-GDP ratio for the Current Policies scenario.
Note: Bulgaria, Cyprus, Croatia, Malta, and Romania were not considered, due to the lack of available data for each benchmark year under analysis
Source: own elaboration
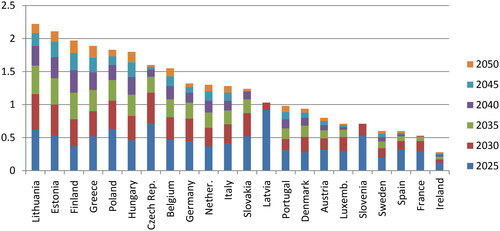
Figure 10. Estimations of the climate debt-to-GDP ratio for the Nationally Determined Contributions (NDCs) scenario.
Note: Bulgaria, Cyprus, Croatia, and Malta were not considered, due to the lack of available data for each benchmark year under analysis
Source: own elaboration
The European Central Bank report (2021a) associates the Hot House World scenario with the failure to meet the European Green Deal temperature target. The policy reaction is slow as only current climate policies are implemented, while CO2 emissions “continue to increase steadily leading to a rise in estimated median temperature of about 3.5 °C by 2100”. The carbon price records low values and hence do not create any coercive stimulus for economic actors to change their polluting behaviours and lower their environmental footprint.
In a Current Policies scenario () only the currently implemented climate policies remain in place, the policy reaction is slow and unevenly represented across different economic sectors. Technological investments are small and the capabilities for carbon dioxide removal from the atmosphere are low.
According to the projections computed for this scenario, the costs incurred by meeting the climate target will be staggered annually for most EU countries. Each of the six benchmark years is represented in the above figure, thus the majority of EU countries will bear a climate debt till 2050. Only three countries succeed to become zero-CO2 emitters in 2050.
The Nationally Determined Contributions (NDCs) scenario () is more comprehensive than the Current Policies one, because it considers all promised policies, even if currently they are not yet implemented.
Under this last scenario, the highest costs to be incurred in order to meet the 2050 climate target will be borne by most EU countries in 2025, 2030, and 2035.
To sum up the informational content of each abovementioned figure, the divergent net zero scenario seems to be the costliest for several EU countries (it exhibits the highest share of climate debt in national GDP – see the maximum values of the descriptive statistics in the Appendix 4), followed by the net zero 2050 scenario and the delayed transition scenario. The years 2025, 2030, and 2035 are expected to be the costliest in the first two scenarios, while in the delayed transition scenario the higher costs for the state budget will be borne in 2035, 2040, and 2045. Therefore, a first outcome of our analysis is meant to reveal those climate scenarios in which a country’s fiscal position indicators are more vulnerable from the standpoint of rising public expenditure due to the country’s inability to manage the CO2 gas emissions from carbon-intensive industries. Our findings suggest that EU countries will face the lowest level of climate debt in the current policies scenario; however, this strategy is the least beneficial from the standpoint of achieving the carbon neutrality till 2050 because only three EU countries will have become zero-CO2 emitters. The current policies scenario assumes that countries will continue to implement only current policies, in a slow pace, which is susceptible to lead to a global warming by up to 3 °C by 2100 and is highly associated with adverse climate impacts on the economy (due to increased incidence of extreme weather events).
By comparing the maximum values recorded by the climate debt/GDP ratio across the EU countries, for each of the six scenarios, we uncover that Estonia will persistently face the highest costs due to its CO2 emissions. Therefore, decision makers in this country have to implement strong policies and strategies for limiting CO2 emissions and complying with the global warming target till 2050.
On average, the divergent Net Zero scenario is the costliest among all, both for the entire timespan 2025-2050 and on an annual basis (a cumulative EU country average of 1.25). The standard deviation statistic exhibits the largest values among all scenarios, confirming the presence of extreme values, both large and small in the climate debt/GDP time series.
The number of EU countries that will become net zero-CO2 emitters in 2050, and hence will not be exposed to any climate debt payment (as a share in national GDP) is different for each scenario analysed:
only 3 out of the 27 countries considered will record a null climate debt/GDP in the Current Policies scenario. The majority of EU countries will persist in emitting CO2 and therefore will face a persistent climate debt burden for their public budget;
10 countries will record a null climate debt/GDP in the NDCs scenario;
15 countries will record a null climate debt/GDP in the Below 2 °C scenario;
20 countries will record a null climate debt/GDP in the Divergent Net Zero scenario;
26 countries will record a null climate debt/GDP in the Net Zero 2050 scenario and the Delayed Transition scenario.
By correlating this finding with the carbon price estimated to be paid in 2050 by each EU country on its CO2 emissions, an interesting conclusion arises. The Net Zero 2050 scenario and the Delayed Transition scenario exhibit the highest carbon price projected to be paid for each tonne of CO2 (of 889.28 US$and respectively of 1058.68 US$). Therefore, these scenarios penalise the most those EU countries that are still CO2 emitters by the end of 2050, and thus countries are more inclined to comply with the climate target. At the opposite is the current policies scenarios, which uses the lowest carbon cost estimate of only 20.76 US$/tonne of CO2 emissions in 2050. This may explain the countries’ lack of efficiency in implementing climate change policies for decreasing the CO2 emission level till the net zero target.
Among the sample of EU countries considered, Latvia and Slovenia are assumed by all the 6 scenarios to become net zero-CO2 emitters starting with 2035. This situation may be the result of the implementation of immediate, timely and strong climate policies, complemented by investments in new technologies meant to increase the carbon dioxide removal through various processes, such as afforestation, geological sequestration, and exploration of bioenergy resources.
Our conclusion highlights that each country is responsible for its climate pathway by 2050 (that may fall under one of the six abovementioned climate scenarios) and this will be mainly determined by the timeliness, efficacy, and appropriateness of the public policies and measures implemented to mitigate climate change. Decision makers are encouraged to perform a screening of the climate policies currently in place and of the next steps in this regard, with particular focus on the investments in alternative sources of energy to fossil fuels, to alleviate or counteract the negative effects of the polluting economic sectors and significantly impact the future downward path of CO2 emissions. The scale of the carbon cost they may bear in the next decades, and hence the climate debt-to-GDP ratio as an additional component of the public debt, will directly depend on the conduct of current policies (including sovereign debt management).
4. Sovereign debt management in the face of climate change – the case of EU member states
As indicated above, at present and in the future, fiscal risk will be additionally determined by the public authorities' implementation of climate commitments indicated in the new regulations. Consequently, actions taken under sovereign climate debt management will translate into sovereign ratings ().
Figure 11. The relation between fiscal risk and sovereign risk in the context of sovereign debt management role.
Source: own elaboration
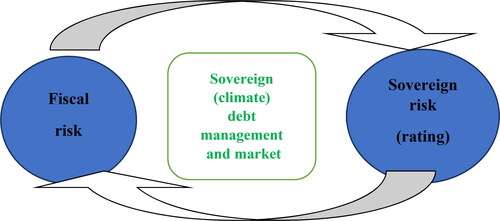
Already, the world's largest rating agencies include climate risk in their methodology for assessing a country's creditworthiness. As the rating agency Standard & Poor's (2014) points out, climate change can be treated as a “global mega-trend for sovereign risk” and it will have an impact on creditworthiness probably through various channels, including economic growth, external performance, and public finance. Moody's (2019), in turn, identifies four main transmission channels through which climate change will affect sovereign risk: impacts on economic activity, damage to infrastructure, social costs, and population shifts.
We can therefore talk about “sovereign climate debt management” in broad and narrow terms. In the former case, the concept will refer to the various actions and financial initiatives taken by public authorities in the fight against climate change and the implementation of carbon liabilities in terms of CO2 emissions. In the narrow sense, it will refer to actions taken in sovereign debt management as part of the implementation of long-term strategies, using a new approach that takes climate risk into account. This article will focus on the latter approach.
As already pointed out in the literature, “climate risk should be integrated in the public sector funding and in the debt management strategies” (Centre for Sustainable Finance, Citation2021, p. 93). A survey of debt managers from 19 countries around the world conducted by the Climate Bond Initiative (Citation2021) found that the flagship solution is now issuing bonds (Sovereign Green, Social and Sustainability Bonds - SSE Bonds) dedicated to financing green investments. Respondents indicated that the main purpose of the issuance was to support the development of local green market bonds, attract new investors and gain reputational benefits. Interestingly, the least motivation for issuing GSS bonds was the cost of their servicing. Some countries have also adapted their SSE bond issuance procedures to taxonomy requirements (EU Taxonomy, Climate Bonds Taxonomy, other taxonomy).
Another heterogeneous strand of literature examines the various socially responsible or green typologies of investments in terms of carbon neutrality, risk-adjusted performance or short and long-term effects: sustainable, ESG stocks (Kaiser and Welters, Citation2019; Ferrat et al., Citation2022), green energy-based investment funds (Naqvi et al., Citation2021), socially responsible exchange traded funds (Lobato et al., Citation2021), green or sustainability-themed mutual funds (Ielasi et al., Citation2018; Ji et al., Citation2021a; Ji et al., Citation2021b), carbon-neutral lending (Umar et al., Citation2021; Yu et al., Citation2022). This topic has gained interest particularly during the various stages of the COVID-19 pandemic. For instance, asset managers have shifted from high-risk option to low risk in terms of size and investment strategy, from countries with higher number of cases to those with lower numbers (Rizvi et al., Citation2020). Social investment funds enjoyed stable volatility during the various stages of the pandemic (Mirza et al., Citation2020), as well as Islamic equity funds (Yarovaya et al., Citation2020).
However, scientific studies as well as many new practice reports are increasingly proposing new solutions dedicated to climate debt managers. One of the most recent is the guideline for issuing sustainability-linked bonds, hurricane and natural disaster clauses or green certificates (ICMA Citation2020, IMF Citation2020, Bongaerts and Schoenmaker, Citation2020). Another type of specialised financial operations is the debt-for-climate swaps designed for debtors from underdeveloped countries and generally involving the conversion of traditional external government debt (loans) into investments in climate-smart fixed assets (Sommer, Restivo and Shandra, Citation2020).
To identify the activities undertaken by debt managers in the 27 European Union member states (excluding the UK) in the above regard, the documentation available on the websites of sovereign debt management institutions, including strategies, reports, and investor presentations from 2019-2021, was first reviewed. The use of the words "climate", "carbon", and "green" in these documents and the content that related to them was verified.
As (details in the Appendix) shows, in 14, or about a half of the member states studied, references to climate issues were found in the documentation analysed.
Figure 12. Climate change references in sovereign debt management documents of EU member states.
Source: own elaboration based on documents of EU government debt management institutions (websites)
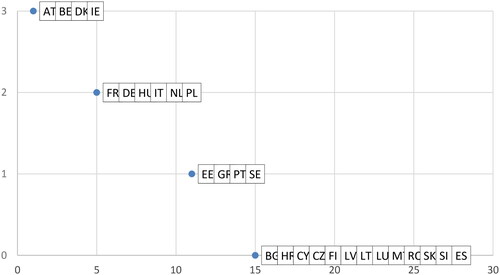
In contrast, 13 countries lacked any reference to the issue under study. In four countries, all three words could be found, most often involving information on both the country's climate strategy ("climate"), the issuance of green bonds in the country ("green"), and the climate targets set or the organisation of a carbon market ("carbon"). This means that in some EU countries, debt managers provide narrower or broader information aimed primarily at market investors and a wider range of users.
In the next part, the analysis concerns possible changes related to the narrow approach to sovereign climate debt management in terms of the adopted strategy objectives, tasks, risk management, institutional foundations, debt instruments and markets as well as Investor Relations reporting and presenting. The results of the study we carried out are summarised in the Appendices 1 and 2.
The present analysis has led to the following conclusions about current experience across EU member states:
no country has yet changed its debt management objectives, focusing mainly on financial objectives,
the remit of debt managers is beginning to shift towards the carbon market and carbon fund management,
some debt managers are introducing climate risk into their sovereign risk management,
the predominant instrument of climate debt management is green bonds, whose issuing procedures (Appendix 3) (at present, ten EU member states are issuing this type of bonds) and financing of climate needs are slowly being adapted by member states to EU taxonomy,
one of the new tasks in climate debt management are being transferred to sovereign debt management agencies,
the new tasks entail the participation of debt managers in new procedures, including the auctioning of CO2 emission rights,
some debt managers include information on climate policy and climate liabilities in official documents published on websites and in presentations given directly to investors.
In the last column of the Table enclosed in Appendix 1, we propose several directions of change, which can be the basis for the formulation of a new, complementary approach to sovereign debt management in view of the inclusion of climate debt in the tasks of debt managers. This direction should be considered legitimate in reference to previously presented climate liabilities scenarios. A comprehensive approach to the tasks related to total government liabilities and ensuring their financing and refinancing should be taken as a necessary change. The market nature of many instruments for financing carbon liabilities directly by sovereigns requires a professional approach, which can be guaranteed by market-based debt portfolio managers.
5. Conclusions
Reducing CO2 emissions and climate debt will play an increasingly important role in determining the future activities, strategies and policies of various market players and institutions, ranging from public authorities to financial institutions and businesses. The analytical framework we develop in this paper focuses on the interplay between climate change and the process of sovereign debt management. However, the broader picture towards achieving a zero-carbon economy is very complex, multifaceted and it intertwines the responsibilities and implications of all major parts: governments, the financial industry, and the business sector. For instance, Umar et al. (Citation2021) explain that the development of a green financial intermediation channel is imperative to achieve the status of carbon neutral economies, while Wang et al. (Citation2020) have empirically found out that financial development, in its traditional form, fuels the carbon emissions and hence causes adverse climatic consequences.
A number of legislative changes in this field, both at the European and national level, will be a major criterion for scrutiny. However, the increasing accumulation of climate change effects will additionally determine not only the assessment of financial, but also social and economic, consequences of the climate policy implemented by the government.
In the European Green Deal, the European Commission estimated that additional investments of €260 billion per year, or about 1.5% of 2018 GDP (EC, Citation2019) will be required to meet the set climate targets by 2030. During the conference COP26 in Glasgow the public financial priority is to achieve and surpass the $100bn a year goal by developed countries (COP26 Presidency, Citation2021). A part of these funds will have to be provided from the public finance. Therefore, it will be of utmost importance to diversify the internal (public budget) and external (financial market) funding sources dedicated to green and sustainable investments.
As the article points out, investors themselves, lenders, and rating agencies are also increasingly concerned about climate risk and its consequences for borrowers (including the Treasury). In view of the above research, undertaking strategic changes in individual EU member states in sovereign debt and climate debt management seems to be a necessity and a matter of the nearest future.
Because of the lack of common guidelines, we propose to expand the scope of debt management objectives to include a broader goal of minimising the costs associated with CO2 emissions, to include climate risk in the assessment of risks of the entire public debt portfolio, to introduce new tasks associated with the service of carbon funds, which involves the use of the balance sheet approach, to introduce new climate financial instruments, to concentrate management tasks in the scope of established Treasury debt management agencies, which will ensure professionalism and transparency. The additional focus should be also put on the communication within Investor Relations regarding sovereign climate debt management and the tasks performed by public authorities in this field.
Acknowledgment
Authors thanks for all comments to the first version of the article received from reviewers and participants of the Public Debt Management Conference organized in May 26–27th 2022 in Rome by the PDM Network, the MEF, the OECD and the World Bank.
Disclosure statement
No potential conflict of interest was reported by the author.
Additional information
Funding
Notes
1 Including mainly after the international climate summit in Copenhagen in 2009 and Paris in 2015.
2 Direct, explicit liabilities are defined as liabilities classified according to applicable national regulations and budgeting methods. This is the primary category of government liabilities, comprising liabilities that are foreseeable in terms of value and future realisation or maturity. Contingent, explicit liabilities are defined as liabilities based on regulations or legal agreements that may or may not have a future funding date. Funding often occurs as a result of an underwritten operation with prior credit risk. Direct, implicit liabilities are defined as liabilities required for future implementation, the amounts and timing of which are not directly derived from current regulations. However, their implementation will be directly funded by the government due to such public expectations. Contingent, implicit liabilities are defined as liabilities derived from an informal government pledge based on expected government responses in emergency situations; failure to fulfil these commitments may result in a crisis or moral hazard phenomenon affecting the public or specific groups of actors. Based on: (Polackova, Citation1998; Marchewka-Bartkowiak, Citation2007)
3 For example, the report issued by the OECD is pricing CO2 emissions at EUR 30/t CO2, the low-end estimate of the cost of carbon (OECD, Citation2016), the Report of the High-Level Commission on Carbon Prices estimates an explicit carbon-price level that is consistent with achieving the Paris Climate Agreement temperature target, namely a cost of US $40–80/t CO2 by 2020 and US $50–100/t CO2 by 2030 for each tonne of carbon emissions (High-Level Commission on Carbon Prices, Citation2017). The Climate Leadership Council calls for the introduction in 2021 of an economy-wide fee on CO2 emissions starting at US $40/t CO2 and increasing every year by 5% above the inflation rate (Climate Leadership Council, Citation2019). Similarly, the IMF relies on a US $35 carbon price per tonne of CO2 in 2030 to compute the burden to be witnessed by various economic sectors that are CO2 emitters (IMF, Citation2019).
4 More in: (Boitan and Marchewka-Bartkowiak, Citation2021)
References
- Allen, M., Rosenberg, C., Keller, C., Setser, B., & Roubini, N. (2002). () A balance sheet approach to financial crisis. IMF Working Paper No 210
- Bertram, C., Hilaire, J., Kriegler, E., Beck, T., Bresch, D., Clarke, L., Cui, R., Edmonds, J., Charles, M., Zhao, A., Kropf, C., Sauer, I., Lejeune, Q., Pfleiderer, P., Min, J., Piontek, F., Rogelj, J., Schleussner, C. F., Sferra, F., … Hurst, I. (2021). NGFS Climate Scenario Database: Technical Documentation. V2.2.
- Bloomestein, H. (2006). Government balance sheet risk management in: Government debt management: new trends and challenges, red. M. Williams, Central Banking Publications.
- Boitan, I. A., & Marchewka-Bartkowiak, K. (2021). The EU Fiscal Risk Matrix – From a government debt to climate liabilities. Studia BAS, 3(67), 45–69. https://doi.org/10.31268/StudiaBAS.2021.26
- Bongaerts, D., & Schoenmaker, D. (2020). Green certificates: a better version of green bonds. Policy Contribution 2020/20, Bruegel
- Cassard, M., & Folkerts-Landau, D. (2000). Management of sovereign assets and liabilities. In M. Cassard, D. Folkerts-Landau (Eds.), Sovereign assets and liabilities management. IMF.
- Centre for Sustainable Finance. (2021). Climate change and sovereign risk.
- Climate Bond Initiative. (2021). Sovereign green, social, and sustainability bond survey.
- Climate Leadership Council. (2019). The four pillars of our carbon dividends plan.
- COP26 Presidency. (2021). COP26 priorities for public climate finance.
- European Central Bank. (2021a). Climate-related risk and financial stability. ECB/ESRB Project Team on climate risk monitoring, July 2021
- European Central Bank. (2021b). Climate risk stress test – SSM stress test 2022, October 2021, https://www.bankingsupervision.europa.eu/ecb/pub/pdf/ssm.climateriskstresstest2021∼a4de107198.en.pdf?cf1f54486edba0da0ad0d9df9271ed97
- European Commission. (2019). The European Green Deal. Communication from the Commission to the European Parliament, the European Council, the Council, the European Economic and Social Committee and the Committee of the Regions, COM(2019) 640 final.
- Ferrat, Y., Daty, F., & Burlacu, R. (2022). Short- and long-term effects of responsible investment growth on equity returns. The Journal of Risk Finance, 23(1), 1–13(13. https://doi.org/10.1108/JRF-07-2021-0107
- High-Level Commission on Carbon Prices. (2017). Report of the high-level commission on carbon prices. The World Bank
- ICMA (2020). Sustainability-linked bond principles.
- Ielasi, F., Rossolini, M., & Limberti, S. (2018). Sustainability-themed mutual funds: an empirical examination of risk and performance. The Journal of Risk Finance, 19(3), 247–261. https://doi.org/10.1108/JRF-12-2016-0159
- International Monetary Fund and the World Bank. (2019). Fiscal policies for paris climate strategies—From principle to practice. Policy Paper No. 19/010
- International Monetary Fund, (2020). The international architecture for resolving sovereign debt involving private-sector creditors-recent developments, challenges, and reform points.
- IPCC. (2021). Climate Change 2021. The Physical Science Basis.
- Ji, X., Zhang, Y., Mirza, N., Umar, M., & Rizvi, S. K. A. (2021a). The impact of carbon neutrality on the investment performance: Evidence from the equity mutual funds in BRICS. Journal of Environmental Management, 297, 113228. https://doi.org/10.1016/j.jenvman.2021.113228
- Ji, X., Chen, X., Mirza, N., & Umar, M. (2021b). Sustainable energy goals and investment premium: Evidence from renewable and conventional equity mutual funds in the Euro zone. Resources Policy, 74, 102387. https://doi.org/10.1016/j.resourpol.2021.102387
- Kaiser, L., & Welters, J. (2019). Risk-mitigating effect of ESG on momentum portfolios. The Journal of Risk Finance, 20(5), 542–555. https://doi.org/10.1108/JRF-05-2019-0075
- Lobato, M., Rodríguez, J., & Romero, H. (2021). A volatility-match approach to measure performance: the case of socially responsible exchange traded funds (ETFs). The Journal of Risk Finance, 22(1), 34–43. https://doi.org/10.1108/JRF-04-2020-0066
- Marchewka-Bartkowiak, K. (2007). Dług potencjalny w świetle macierzy ryzyka fiskalnego. Ekonomista, No 6
- Mirza, N., Naqvi, B., Rahat, B., & Rizvi, S. K. A. (2020). Price reaction, volatility timing and funds' performance during Covid-19. Finance Research Letters, 36, 101657. https://doi.org/10.1016/j.frl.2020.101657
- Missale, A. (1999). Public debt management. Oxford University Press.
- Naqvi, B., Mirza, N., Rizvi, S. K. A., Porada-Rochoń, M., & Itani, R. (2021). Is there a green fund premium? Evidence from twenty seven emerging markets. Global Finance Journal, 50, 100656. https://doi.org/10.1016/j.gfj.2021.100656
- OECD. (2016). Effective carbon rates: Pricing CO2 through taxes and emissions trading systems. Paris.
- OECD. (2018). GDP long-term forecast. (indicator) https://doi.org/10.1787/d927bc18
- Polackova, H. (1998). Contingent government liabilities. A hidden risk for fiscal stability. Policy Research Working Paper, The World Bank No 1989
- Rizvi, S. K. A., Mirza, N., Naqvi, B., & Rahat, B. (2020). Covid-19 and asset management in EU: A preliminary assessment of performance and investment styles. Journal of Asset Management, 21(4), 281–291. https://doi.org/10.1057/s41260-020-00172-3
- Robins, N., Dikau, S., & Volz, U. (2021). Net-zero central banking: A new phase in greening the financial system. Grantham Research Institute on Climate Change and the Environment Policy report.
- Sommer, J. M., Restivo, M., & Shandra, J. M. (2020). The United States, bilateral debt-for-nature swaps, and forest loss: A cross-national Analysis. Journal of Development Studies. 56(4).
- Umar, M., Ji, X., Mirza, N., & Naqvi, B. (2021). Carbon neutrality, bank lending, and credit risk: Evidence from the Eurozone. Journal of Environmental Management, 296, 113156. https://doi.org/10.1016/j.jenvman.2021.113156
- Wang, R., Mirza, N., Vasbieva, D. G., Abbas, Q., & Xiong, D. (2020). The nexus of carbon emissions, financial development, renewable energy consumption, and technological innovation: What should be the priorities in light of COP 21 Agreements? Journal of Environmental Management, 271, 111027. https://doi.org/10.1016/j.jenvman.2020.111027
- Yarovaya, L., Mirza, N., Rizvi, S. K. A., Saba, I., & Naqvi, B. (2020). The resilience of Islamic equity funds during COVID-19: evidence from risk adjusted performance. Investment styles and volatility timing. https://doi.org/10.2139/ssrn.3737689
- Yu, B., Li, C., Mirza, N., & Umar, M. (2022). Forecasting credit ratings of decarbonized firms: Comparative assessment of machine learning models. Technological Forecasting and Social Change, 174, 121255. https://doi.org/10.1016/j.techfore.2021.121255
Appendix 1.
Sovereign debt management – actual and proposed approaches
Appendix 2.
Climate change references in sovereign debt management documents – detailed information
Appendix 3.
Examples of green bonds issued by sovereign debt management institution in EU member states
Appendix 4.
Climate debt-to-GDP ratio (%) – computation based on the NGFS’ scenario-based projections