
 ?Mathematical formulae have been encoded as MathML and are displayed in this HTML version using MathJax in order to improve their display. Uncheck the box to turn MathJax off. This feature requires Javascript. Click on a formula to zoom.
Abstract
Although prior studies investigated the influence of partner diversity on focal firms’ innovation performance, they failed to consider partners’ ecosystem positions and the roles of regional innovation environment and partnership heterogeneity. To fill these gaps, this study examines the relationship between supplier diversity, customer diversity, regional innovation environment, partnership heterogeneity and innovation performance to provide a comprehensive and throughout understanding of the influence of partner diversity on innovation performance. Based on data of 188 Chinese manufacturing firms, this article finds that both diversities of upstream suppliers and that of downstream customers contribute to innovation performance. Regional innovation environment and partnership heterogeneity moderate the influences of supplier diversity and customer diversity on innovation performance. In a favourable regional innovation environment, the benefits of diverse upstream suppliers for innovation are eroded, while the benefits of diverse downstream customers for innovation are enhanced. Partnership heterogeneity with suppliers can mitigate the moderating effect of regional innovation environment on the relationship between supplier diversity and innovation performance. These findings advance the literature on partner diversity and innovation performance, thus providing fine-grained managerial implications to firms to orchestrate diverse inter-organizational partners for innovation.
1. Introduction
Due to the increased speed and sophistication of technological change and product development, firms tend to collaborate with other firms rather than stand alone, so that they can obtain more resources and knowledge for innovation and sustainable development (Hagedoorn et al., Citation2018; Huang et al., Citation2018). Partner diversity is a relevant concept that reflects the variance of focal firms’ partner portfolios, usually involving the number and characteristics of partners (e.g., customers, suppliers, research institutions) with which they interact (Hagedoorn et al., Citation2018; Lee et al., Citation2017).
Although partner diversity is well studied in the field of alliance portfolio, some mixed and inconsistent conclusions have been drawn about the relationship between partner diversity and firm innovation performance: positive (Huang et al., Citation2018; Lucena & Roper, Citation2016), negative (Yoon et al., Citation2015), U-shaped (Wuyts & Dutta, Citation2014), and inverted U-shaped (Hagedoorn et al., Citation2018; Martinez et al., Citation2017). This implies that a closer look at partner diversity and its influence on innovation performance is necessary. To address this issue, we considered the different positions (upstream and downstream) of partners in the ecosystem as suggested by Adner and Kapoor (Citation2010) and Adner (Citation2017), and identifies the partner diversity into two different types, i.e., customer diversity and supplier diversity. Furthermore, we examined the influences of customer diversity and supplier diversity on innovation performance respectively, to reconcile the inconsistent findings in the literature.
In addition, the association between partner diversity (supplier diversity and customer diversity) and innovation performance may have boundary conditions. This argument is based on the prior finding that diversity of alliance portfolios cannot predict the innovation performance of biotechnology firms without considering the moderating effects of firms’ capabilities to manage alliance partners (Degener et al., Citation2018). Although a few studies examined potential boundary conditions, such as internal and external sources of finance (Cuervo-Cazurra et al., Citation2018), modularity and scope of external knowledge (Hagedoorn et al., Citation2018), and density of partnership strengths with suppliers (Delbufalo, Citation2015), less attention has been paid to regional innovation environment. Besides, a focal firm’s innovative outcomes may depend on its configuration of partnership strengths with its major partners (Cho et al., Citation2018; Delbufalo, Citation2015), which has been ignored by scholars. To fill these gaps, this article considers them as potential boundary factors, and examines their influences on the relationship between partner diversity and innovation performance.
This research aims to investigate the relationship between partner diversity (i.e., supplier diversity and customer diversity), regional innovation environment, partner heterogeneity and innovation performance. It contributes to the literature as follows. First, it goes beyond the focus of alliance portfolio diversity by emphasizing partners’ ecosystem positions, and extends ecosystem studies by investigating partner diversity, thus it contributes to the literature on both alliance portfolio diversity and innovation ecosystem. Second, it investigated the neglected roles of regional innovation environment, thus revealing how partner diversity influences innovation performance depending on the innovation resources in the regional environment. Third, to supplement previous studies, it considered partnership heterogeneity as a moderator and examined how the configuration of partnership strengths between a focal firm and its suppliers and customers may help the focal firm to handle the effects of external environments. In sum, this study provides a comprehensive and throughout understanding of the influence of partner diversity on innovation performance, and useful implications for practitioners to leverage the benefits of diverse suppliers and customers in an ecosystem to achieve a high level of innovation performance.
Following this section, the theoretical underpinnings and research hypotheses are presented in Section 2. After Section 3 describes the research methods, Section 4 shows the empirical results. Finally, Section 5 discusses the findings and concludes this research.
2. Theory and hypotheses
2.1. Diversity of ecosystem partners and innovation performance
Partner diversity describes the variance of partner portfolios (Hagedoorn et al., Citation2018; Lee et al., Citation2017). This research considers the ecosystem positions of partners and focuses on upstream supplier diversity and downstream customer diversity. Diverse suppliers provide the focal firm with heterogeneous technological resources and solutions (Dyer & Hatch, Citation2006), and enhance novel innovation knowledge spillover to the focal firm (Gao et al., Citation2015). These benefits facilitate the focal firm’s innovation learning and ability improvement, which helps the focal firm to leverage the diverse upstream innovation resources and technological solutions for more innovation outcomes. Meanwhile, diverse customers improve focal firms’ understanding of diverse product demands and market fit in dynamic market environments (Piening et al., Citation2016). This brings more opportunities and directions for focal firms to learn and innovate with lower market risk and higher flexibility against dynamic market environments, leading to more innovation outcomes. As found in past empirical studies, partnerships with upstream suppliers and downstream customers improve the performance of innovation projects (Jaklic et al., Citation2014; von Raesfeld et al., Citation2012). Consistent with these findings, this study proposes:
Hypothesis 1a. Supplier diversity in a firm’s ecosystem positively relates to innovation performance.
Hypothesis 1b. Customer diversity in a firm’s ecosystem positively relates to innovation performance.
2.2. Regional innovation environment
Regional innovation environment plays a pivotal role in shaping a firm’s innovation performance (Wang et al., Citation2019). Past research found that a favourable regional innovation environment contributes to firms’ innovation performance (Wang et al., Citation2019). Furthermore, environmental factors may also change the association of partner diversity with innovation performance. As demonstrated by Hagedoorn et al. (Citation2018), higher modularity of knowledge in external environments increases the benefits of partner diversity to firm innovation. Thus, whether the regional innovation environment could change the association of ecosystem partner diversity with innovation performance comes to the concern of this study.
We believe that a better regional innovation environment may decrease the benefits of supplier diversity to innovation performance since focal firms in this circumstance are more likely to face a lower pressure to engage in technological explorations. In a better regional innovation environment, partnering with diverse suppliers provides focal firms with diverse innovative components and technology choices, leading to a higher probability to meet heterogeneous downstream demands (Bahlmann, Citation2014; Marhold et al., Citation2017). Moreover, a better regional innovation environment brings more dynamic technological changes in upstream suppliers, which increases external technological turbulence and uncertainty. Past empirical study indicates that the more turbulent the technology environment, the weaker the association between supplier technological diversity and innovation performance (Gao et al., Citation2015). Hence, this study proposes:
Hypothesis 2a. The better the regional innovation environment, the weaker the association between supplier diversity and innovation performance.
Hypothesis 2b. The better the regional innovation environment, the stronger the association between customer diversity and innovation performance.
2.3. Partnership heterogeneity
Partnership heterogeneity involves the dispersity of partnership strengths between a focal firm and its external partners as opposed to partner concentration (Patatoukas, Citation2012). Scholars found that not only partnership strength, but also density of partnership strengths play pivotal roles in influencing the relationship between partner diversity and innovation performance (Bahlmann, Citation2014; Delbufalo, Citation2015). This indicates a focal firm’s configuration of inter-firm partnership strengths may change the influence of the diversity of ecosystem partners on innovation performance. Hence, partnership heterogeneity may act as a moderator.
Specifically, higher partnership heterogeneity with suppliers may reduce the moderating effect of regional innovation environment. The reason is that a higher level of partnership heterogeneity with suppliers indicates more dispersed partnership strengths between the focal firm and its suppliers (Qiu, Citation2018). In this circumstance, focal firms need to pay more dispersed attention and resources among their suppliers. This reduces the benefits of regional innovation environment to focal firms’ acquisitions of external technologies and components due to the increased difficulties and costs in acquiring technology and components from dispersed suppliers, which may lead focal firms to innovate internally and integrate upstream suppliers (Adner & Kapoor, Citation2010; Marhold et al., Citation2017). Meanwhile, the more dispersed the upstream relationships with suppliers, the stronger the competition between suppliers. This may increase the upstream innovation knowledge spillovers and then boost focal firms’ internal innovation. Past studies indicated that dispersed relationships between the focal firm and its inter-firm partners contribute to innovation performance (Wang & Quan, Citation2017; Delbufalo, Citation2015). Thus, this research proposes:
Hypothesis 3a. The higher the partnership heterogeneity with suppliers, the weaker the role of regional innovation environment in moderating the association between supplier diversity and innovation performance.
Hypothesis 3b. The higher the partnership heterogeneity with customers, the weaker the role of regional innovation environment in moderating the association between customer diversity and innovation performance.
3. Methods
3.1. Data
This study chose the Chinese manufacturers as the research setting. Chinese manufacturers are suitable to investigate the relationships between supplier diversity and customer diversity with innovation performance due to the following reasons: First, through decades of rapid development, China has been the second-largest economy in the world for about ten years, where the manufacturing industry has been one of the crucial motive forces of economic development (Gao et al., Citation2015; Kang et al., Citation2018). Thus, Chinese manufacturing industries were well studied in the literature on innovation (Chen et al., Citation2021; Gao et al., Citation2015; Jiang et al., Citation2020; Wang et al., Citation2019). Second, Chinese manufacturing firms tend to be active in various innovation activities, especially for new product innovation, which provides a rich context to research innovation performance (Gao et al., Citation2015; Jiang et al., Citation2020). Third, in response to the complex technological changes and open market economy, the innovation activities of Chinese manufacturing firms seldom stand alone in innovation activities; rather they collaborate with other partners, especially with their suppliers and customers who can provide crucial innovation resources (Gao et al., Citation2015; Huang et al., Citation2018). As found in the studies, Chinese manufacturing firms have a closer relationship with their suppliers and customers (Gao et al., Citation2015; Huang et al., Citation2018). Combined with the above considerations, Chinese manufacturing firms seem suitable for studying the relationship between partner diversity (supplier and customer diversity) and innovation performance.
In collecting the dataset used in this study, we adhered to the following procedures: First, we used the CSMAR database to collect firms in Chinese manufacturing industries (Chen et al., Citation2021; Jiang et al., Citation2020). Focusing on industry diversity, we excluded those industries where firms have weak collaborations with their partners. As a consequence, six industries including pharmaceutical, general equipment, special equipment, automobile, electric machinery and equipment, computer and communication and other electronic equipment industries were selected. Second, in contrast to large manufacturing firms, some small firms and mostly privately owned firms were not our target due to the non-disclosure of data. Thus, we selected 1277 large manufacturing firms. Third, to ensure the authenticity of data, firms that disclose the names of suppliers and customers were considered reliable. Thus, we excluded some manufacturing firms that cannot provide specific information about their suppliers or customers, and the remaining 232 firms were considered. Forth, following the established time frame of this study, we collected information on partner diversity (supplier and customer diversity) and innovation performance in Chinese manufacturing firms between 2015 and 2018, and excluded 44 firms that cannot provide complete data to our study.
To be specific, the CSMAR database (http://www.gtarsc.com/), provides information on the firm’s top five suppliers and customers for measuring partner diversity and partnership heterogeneity. It also provides basic operating data such as ownership, number of employees, and financial indicators. Then, Aiqicha (https://aiqicha.baidu.com/?from=pz), Tianyancha (https://www.tianyancha.com/), Qixinbao (https://www.qixin.com/) and Bloomberg (https://www.bloomberg.com) all provide information on the main industry in which a given supplier or customer is involved, allowing triangular validation. Meanwhile, the official patent database of the China National Intellectual Property Administration (https://www.cnipa.gov.cn/) provides patent data to measure innovation performance (Wang et al., Citation2019). Finally, the Annual Report on China’s Regional Innovation Capability provides a comprehensive indicator for measuring innovation environment at the province level (Wang et al., Citation2019).
By the procedures above, a purer and more accurate dataset was established, which contains 130 firms with 303 observations for supplier diversity and 103 firms with 231 observations for customer diversity from 2015 to 2018. The sample distribution is presented in .
Table 1. Sample distribution.
3.2. Measures
3.2.1. Dependent variable
Innovation Performance represents the output generated by the firm’s innovation activities. We used the count of patent applications with a one-year lag as a proxy for innovation performance of the focal firm, consistent with prior studies (Degener et al., Citation2018; Li, Citation2019). This way of measurement focussed on the quantitative performance of firms’ innovation. As demonstrated by the literature that the number of patent applications is closely associated with innovation performance, this quantitative measure has been widely adopted to gauge innovation performance (Degener et al., Citation2018; Li, Citation2019; Wang et al., Citation2019).
3.2.2. Independent variables
Supplier Diversity and Customer Diversity were independent variables. Although an innovation ecosystem consists of those participants, including a focal firm, suppliers, complementors and customers (Adner, Citation2006; Adner & Kapoor, Citation2010), the focal firm has direct ties to its upstream supplier as well as direct ties to its downstream customers, in contrast to indirect ties to its complementors (Adner & Kapoor, Citation2010), thus the relationship between a focal firm with its suppliers and customers deserves more attention. This is consistent with the focus of extant research (Cho et al., Citation2018; Gao et al., Citation2015; Potter & Paulraj, Citation2020).
Supplier Diversity and Customer Diversity were measured based on the industries in which the top five suppliers and customers were involved respectively. This is based on that firms from the same industry usually have similar assets, operations and intangible resources including market and technological knowledge, experience, and capabilities (Chung et al., Citation2019; Marhold et al., Citation2017). The industry dimension of diversity was widely used to measure partner diversity (Chung et al., Citation2019; Lee et al., Citation2017). In this study, the industry categories are at the secondary level of Classification of China’s Industrial Classification for National Economic Activities (GB/T 4754-2017). Then, the two variables are calculated by Blau Index (Blau, Citation1977): 1-Σ(pi2), where pi is the proportion of partners from industry i in this study. Their values range from 0 (five partners from one industry) to 0.80 (five partners from five different industries). This index was broadly used in partner diversity studies (Degener et al., Citation2018; Jiang et al., Citation2010; Marhold et al., Citation2017).
3.2.3. Moderating variables
Regional Innovation Environment was measured by the comprehensive indicator: regional innovation environment in the Report on China's Regional Innovation Capability following (Wang et al., Citation2019). This report published by the University of Chinese Academy of Sciences comprehensively measured regional innovation environment according to provincial infrastructure, workforce quality, financial and market environment, and entrepreneurship. These factors were treated as the core contents of regional innovation environment by scholars, which reflects the scientificity and rationality of this indicator (Wang et al., Citation2019).
Partnership Heterogeneity represents the dispersion characteristic of tie strengths of a focal firm with partners. In contrast to partner concentration (Patatoukas, Citation2012), a high level of partnership heterogeneity indicates a high level of dispersion of the tie strengths of a focal firm with its partners. Following Delbufalo (Citation2015), we used the contractual trade proportions of suppliers and customers in the total trade volume of a focal firm to measure partner heterogeneity. As done by Ardito et al. (Citation2018), partnership heterogeneity with suppliers and partnership heterogeneity with customers were measured by Blau Index (Blau, Citation1977): 1-Σ(pi2), where pi represents the trade proportion of the top-five partner i of the focal firm in this study. The value of these two variables is a continuous decimal ranging from 0 to 1.
3.2.4. Control variables
First, this study controls for firm size using the number of annual employees (tenthousand as the unit) (Oerlemans et al., Citation2013), firm age by the years from establishing date (Bahlmann, Citation2014; Degener et al., Citation2018), R&D intensity utilizing the yearly total R&D expenditure divided by sales (Hagedoorn et al., Citation2018; Martinez et al., Citation2017), and debt ratio by the percentage of firm’s debts to assets (Li, Citation2019) to control their impacts on the innovation performance of focal firms. Second, considering tie strength of the focal firm with its partners closely connects to its innovation (Demirkan, Citation2018), supplier tie strength and customer tie strength are introduced by the percentage of the focal firm’s total trade shares with the top five suppliers and customers respectively. Third, government subsidy is measured by the yearly total amount of government subsidies (10,000 RMB as the unit), given its significant role in influencing firm innovation (Lucena & Roper, Citation2016). Finally, industry, ownership, and year effects are controlled (Zhang et al., Citation2021).
3.3. Methods of analysis
Innovation performance is a count variable in this study. Its variance is more than its mean. Therefore, negative binomial regression with fixed effects is more appropriate to handle the over-dispersed of this variable and the potential time-invariant heterogeneities (Fu et al., Citation2021). Moreover, the analyses employed the natural logarithm of the continuous control variables to mitigate the potential impacts of different scales of variables (Degener et al., Citation2018). Simple slope analysis and difference tests provide supplementary interpretations of the moderating effects (Dawson & Richter, Citation2006). STATA16 SE was employed to perform regressions. Specifically, this study used Model 1 to Model 4 to test hypotheses related to supplier diversity, and Model 5 to Model 8 to test hypotheses related to customer diversity.
(1)
(1)
(2)
(2)
(3)
(3)
(4)
(4)
(5)
(5)
(6)
(6)
(7)
(7)
(8)
(8)
where subscripts i and t represent individual firms and observation years, IPi,t-1 is innovation performance, SDi,t-1 is supplier diversity, CDi,t-1 is customer diversity, RIEi,t-1 is regional innovation environment, PHSi,t-1 is partnership heterogeneity with suppliers, and PHCi,t-1 is partnership heterogeneity with customers, STSi,t-1 is supplier tie strength, CTSi,t-1 is customer tie strength, FAi,t-1 is firm age, FSi,t-1 is firm size, GSi,t-1 is government subsidy, RDIi,t-1 is R&D intensity, DRi,t-1 is debt ratio, ei,t-1 is error term respectively. Each of these models was all controlled for industry, ownership, and year effects.
Model 1 and Model 5 are baseline models. Model 2 was used to test Hypothesis 1a according to the coefficient of SDi,t-1. Model 3 was used to test Hypothesis 2a according to the coefficient of the two-way interaction of SDi,t-1 and RIEi,t-1. Model 4 was used to test Hypothesis 3a according to the coefficient of the three-way interaction of SDi,t-1, RIEi,t-1, and PHSi,t-1. Meanwhile, Model 6 was used to test Hypothesis 1 b according to the coefficient of CDi,t-1. Model 7 was used to test Hypothesis 2 b according to the coefficient of the two-way interaction of CDi,t-1 and RIEi,t-1. Model 8 was used to test Hypothesis 3 b according to the coefficient of the three-way interaction of CDi,t-1, RIEi,t-1, and PHCi,t-1.
4. Results
presents the results of descriptive statistics and correlations. provides the results of hypotheses testing. The max of VIF in each model is well below the threshold of 10, excluding the multicollinearity concern (Cohen et al., Citation2013). The decreased index of Akaike Information Criteria (AIC) and significant results of Likelihood ratio (LR) tests indicate a good fit and effectiveness of these models (Caner & Tyler, Citation2015; Piening et al., Citation2016).
Table 2. Descriptive statistics and correlations.
Table 3. Results of negative binomial regressions.
As shown in , including SDi,t-1 in model 2 improves the model fit against Model 1 which only includes control variables, since AIC declines and the result of LR test is significant (p < 0.05). The coefficient of SDi,t-1 is significant and positive (b = 1.262, p < 0.05) in Model 2, supporting Hypothesis 1a. Similarly, when CDi,t-1 is introduced, Model 6 has a better model fit than Model 5 only including control variables, since AIC declines and LR test is significant (p < 0.01). The coefficient of CDi,t-1 is significant and positive (b = 1.302, p < 0.01) in Model 6, supporting Hypothesis 1 b.
Then, to test Hypothesis 2a, Model 3 includes SDi,t-1, RIEi,t-1, and their interaction. This improves model fit with a lower AIC and significant result of LR test (p < 0.01) against Model 2. The coefficient of the interaction between SDi,t-1 and RIEi,t-1 in Model 3 is negative and statistically significant (b=-0.170, p < 0.01), providing support for Hypothesis 2a. Similarly, to test Hypothesis 2 b, Model 7 introduces CDi,t-1, RIEi,t-1, and their interaction, leading to a better model fit with a decline of AIC and significant result of LR test (p < 0.01) against Model 6. The interaction between CDi,t-1 and RIEi,t-1 has a statistically significant and positive coefficient (b = 0.125, p < 0.05). Therefore, Hypothesis 2 b is supported. further presents the graphical interpretations of the two-way interactions.
Figure 1. Interactions between SDi,t-1 and RIEi,t-1, and CDi,t-1 and RIEi,t-1.
Source: compiled by authors.
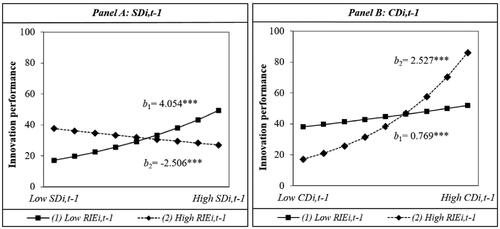
As shown in , SDi,t-1 is stronger linked to innovation performance in low RIEi,t-1 (mean minus one standard deviation, b = 4.054, p < 0.01) than in high RIEi,t-1 (mean plus one standard deviation, b=-2.506, p < 0.01). The two slopes are significantly different (b = 6.656, p < 0.01). Thus, the results support Hypothesis 2a. Meanwhile, the association of CDi,t-1 with innovation performance becomes stronger in high RIEi,t-1 (b = 2.527, p < 0.01) compared to in low RIEi,t-1 (b = 0.769, p < 0.01). The two slopes are significantly different (b=-1.758, p < 0.01). Hence, Hypothesis 2 b is supported.
Table 4. Simple slope analysis and difference tests for two-way interactions.
Finally, Hypothesis 3a was tested by Model 4 including SDi,t-1, RIEi,t-1, PHSi,t-1, and their interactions. Model 4 fits better with lower AIC and significant result of LR test (p < 0.01) against Model 3. The three-way interaction between SDi,t-1, RIEi,t-1, PHSi,t-1 has a significant and positive coefficient (b = 2.486, p < 0.1), providing support for Hypothesis 3a. Meanwhile, to test Hypothesis 3 b, Model 8 includes the interactions between CDi,t-1, RIEi,t-1, PHCi,t-1. It has a lower AIC and significant result of LR test (p < 0.01) against Model 7. The coefficient of three-way interaction between CDi,t-1, RIEi,t-1, PHCi,t-1 is not significant (b = 0.090, p > 0.1), which fails to support Hypothesis 3 b. further illustrates the role of partnership heterogeneity with suppliers.
Figure 2. Interaction between SDi,t-1, RIEi,t-1 and PHSi,t-1.
Source: compiled by authors.
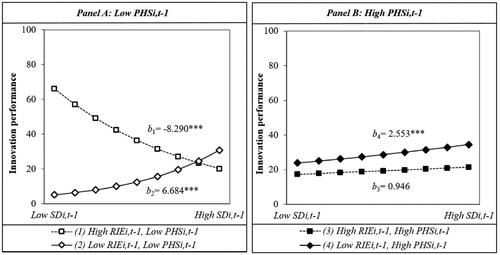
As demonstrated in , the moderating effect of RIEi,t-1 turns to be not significant from low PHSi,t-1 (mean minus one standard deviation) to high PHSi,t-1 (mean plus one standard deviation), since in high RIEi,t-1 and high PHSi,t-1 the link of SDi,t-1 to innovation performance is non-significant (b = 0.946, p = 0.113). And all the slopes in the four scenarios are significantly different. Therefore, Hypothesis 3a is supported.
Table 5. Simple slope analysis and difference tests for three-way interaction of SDi,t-1, RIEi,t-1 and PHSi,t-1.
Supplementary regressions provide extra evidence to support our results of hypothesis tests. First, SDi,t-1 and CDi,t-1 were gauged by the number of industry categories of suppliers and customers (Jiang et al., Citation2010) (). Then, the total number of patent applications during the observation year and the next year serves as an alternative way to gauge innovation performance (). Moreover, to address potential reverse causality concern, we regressed innovation performance on supplier diversity and customer diversity drawing on Degener et al. (Citation2018). Results found that innovation performance fails to significantly predict supplier diversity and customer diversity, which excluded this concern. Finally, potential non-linear associations of the diversity of ecosystem partners with innovation performance were tested providing non-significant results.
5. Discussion and conclusion
Integrating the alliance portfolio diversity and ecosystem as structure perspectives, this study focused on supplier diversity and customer diversity to seek a more nuanced understanding of how the diversity of ecosystem partners relates to innovation performance as well as the moderating roles of regional innovation environment as a regional factor and partnership heterogeneity as an inter-organizational factor. The findings are as follows.
First, both supplier diversity and customer diversity in a firm’s ecosystem improve innovation performance. As noted above, past studies provide mixed and inconsistent conclusions on how partner diversity connects to innovation performance (Hagedoorn et al., Citation2018; Lee et al., Citation2017). The reason may be that partners in different ecosystem positions play different roles in influencing focal firms’ innovation (Adner & Kapoor, Citation2010; Song, Citation2016). Therefore, this study highlights the importance of ecosystem positions when investigating the association of partner diversity with innovation performance. Consistent with the resource-based view, organizational learning theory, and social network theory, it confirms that supplier diversity contributes to focal firms’ innovation by providing diverse resources, knowledge spillovers, opportunities to learn, and technological solutions from the supply side, while customer diversity benefits focal firms’ innovation by diverse innovation resources, pressures, and learning opportunities from the demand side. These findings are also in line with prior studies (Gao et al., Citation2015; Sarpong & Teirlinck, Citation2018; von Raesfeld et al., Citation2012), and advance the understanding of the impact of diversity of inter-organizational partners on innovation performance.
Second, regional innovation environment weakens the influence of supplier diversity on innovation performance, but enhances the impact of customer diversity on innovation performance. Although prior studies investigated some boundary conditions which impact the innovation outcomes of partner diversity. For instance, technological and market uncertainties can decrease the benefits of R&D alliance diversity to innovation performance (Wang & Quan, Citation2017). Complementary to these studies, this study revealed the asymmetric moderating roles of regional innovation environment. The results enrich the understanding of the association of ecosystem partner diversity with innovation performance and the boundary conditions of this relationship from an alternative perspective.
Finally, partnership heterogeneity with suppliers weakens the moderating effect of regional innovation environment on the relationship between supplier diversity and innovation performance. Past studies have explored firm-level boundary conditions such as network stability (von Raesfeld et al., Citation2012), internal capabilities of value creation (Chung et al., Citation2019), and internal sources of finance (Cuervo-Cazurra et al., Citation2018). Scholars also revealed that partnership heterogeneity with suppliers increases the competitive intensity of suppliers which helps the focal firm to better leverage the benefits of supplier diversity for higher creativity (Gao et al., Citation2015). This article provides complementary findings by revealing the roles of partnership heterogeneity in shaping the association of partner diversity with innovation performance.
The research contributions of this article are as follows. First, it reveals that both supplier diversity and customer diversity contribute to the innovation performance of focal firms. Second, it verifies that regional innovation environment diminishes the benefits of supplier diversity to innovation performance, but enhances the benefits of customer diversity to innovation performance. Third, it confirms that partnership heterogeneity with suppliers weakens the moderating roles of regional innovation environment. In sum, this study advances extant studies on alliance portfolio diversity, ecosystem and innovation performance, thus deepening our understanding of the influence of partner diversity on the innovation performance of focal firms.
The findings provide several managerial implications. First, increasing the diversity of suppliers and diversity of customers in focal firms’ ecosystems could enhance innovation performance. Cross-industry collaborations, such as partnering with raw material, technology, and component suppliers in different industries may help focal firms to diversify partners. Moreover, improving the focal firm’s information technology infrastructure towards digital transformation may be a channel to increase partner diversity (van Beers & Zand, Citation2014). Finally, more innovation inputs such as R&D resources may help focal firms to better reap the benefits of partner diversity for more innovations (Lucena & Roper, Citation2016; Martinez et al., Citation2017).
Second, focal firms cannot always better leverage the benefits of diverse partners in different regional innovation environments. In a worse regional innovation environment, for better innovation performance focal firms may concentrate most of their resources to focus on key technology and core product by shrinking technology scope and adopting specialised product strategies which may decrease the diversity of suppliers (Shukla & Mital, Citation2018). Meanwhile, focal firms may keep a higher level of customer diversity in a better regional innovation environment. Strategies for international and differentiating marketing may expand the applications industries of focal firm’s products. Focal firms may market their products to different regions by more marketing endeavours such as establishing sales subsidiaries and digital platforms.
Finally, focal firms can change the heterogeneity of partnerships with suppliers to control the influence of regional innovation environment. Specifically, for better innovation performance, focal firms may increase the level of partnership heterogeneity with suppliers to mitigate the role of regional innovation environment in decreasing the benefits associated with supplier diversity to innovation performance. Adjusting component and product structure and expanding the scope of supplier selection may help focal firms to maintain dispersed partnership strengths with suppliers (Cho et al., Citation2018; Gao et al., Citation2015).
This research has some limitations which provide research opportunities. It focused on suppliers and customers considering their important roles for focal firms’ innovation. Future studies may investigate partners in other ecosystem positions such as competitors and complementors. Moreover, alternative measures of variables also exist. For instance, measuring partner diversity in different diversity dimensions and employing other aspects (e.g., regional patents and R&D investment) to measure regional innovation environment will improve the robustness of the findings. Finally, it selected large listed manufacturing firms for hypotheses tests. Future studies may be extended by selecting SMEs and firms from different industries to perform industry-wise analysis.
Disclosure statement
No potential conflict of interest was reported by the authors.
Additional information
Funding
References
- Adner, R. (2006). Match your innovation strategy to your innovation ecosystem. Harvard Business review, 84(4), 98–107.
- Adner, R. (2017). Ecosystem as structure: An actionable construct for strategy. Journal of Management, 43(1), 39–58. https://doi.org/10.1177/0149206316678451
- Adner, R., & Kapoor, R. (2010). Value creation in innovation ecosystems: How the structure of technological interdependence affects firm performance in new technology generations. Strategic Management Journal, 31(3), 306–333. https://doi.org/10.1002/smj.821
- Ardito, L., Natalicchio, A., Petruzzelli, A. M., & Garavelli, A. C. (2018). Organizing for continuous technology acquisition: The role of R&D geographic dispersion. R&D Management, 48(2), 165–176. https://doi.org/10.1111/radm.12270
- Bahlmann, M. D. (2014). Geographic network diversity: How does it affect exploratory innovation? Industry and Innovation, 21(7–8), 633–654. https://doi.org/10.1080/13662716.2015.1012906
- Blau, P. M. (1977). Inequality and heterogeneity: A primitive theory of social structure. Free Press.
- Caner, T., & Tyler, B. B. (2015). The effects of knowledge depth and scope on the relationship between R&D alliances and new product development. Journal of Product Innovation Management, 32(5), 808–824. https://doi.org/10.1111/jpim.12224
- Chen, J. Y., Lei, H., Luo, J., Tang, X. X., Sial, M. S., & Samad, S. (2021). The effect of the revision of intangible assets accounting standards on enterprise technology innovation. Economic Research-Ekonomska Istrazivanja, 4(1), 3015–3037. https://doi.org/10.1080/1331677X.2020.1865829
- Cho, M., Bonn, M. A., Han, S. J., & Kang, S. (2018). Partnership strength and diversity with suppliers: Effects upon independent restaurant product innovation and performance. International Journal of Contemporary Hospitality Management, 30(3), 1526–1544. https://doi.org/10.1108/IJCHM-01-2017-0016
- Chung, D., Kim, M. J., & Kang, J. (2019). Influence of alliance portfolio diversity on innovation performance: The role of internal capabilities of value creation. Review of Managerial Science, 13(5), 1093–1120. https://doi.org/10.1007/s11846-018-0281-4
- Cohen, J., Cohen, P., West, S. G., & Aiken, L. S. (2013). Applied multiple regression/correlation analysis for the behavioral sciences. Routledge.
- Cuervo-Cazurra, A., Nieto, M. J., & Rodriguez, A. (2018). The impact of R&D sources on new product development: Sources of funds and the diversity versus control of knowledge debate. Long Range Planning, 51(5), 649–665. https://doi.org/10.1016/j.lrp.2017.06.004
- Dawson, J. F., & Richter, A. W. (2006). Probing three-way interactions in moderated multiple regression: Development and application of a slope difference test. The Journal of Applied psychology, 91(4), 917–926. https://doi.org/10.1037/0021-9010.91.4.917
- Degener, P., Maurer, I., & Bort, S. (2018). Alliance portfolio diversity and innovation: The interplay of portfolio coordination capability and proactive partner selection capability. Journal of Management Studies, 55(8), 1386–1422. https://doi.org/10.1111/joms.12396
- Delbufalo, E. (2015). The influence of supply network structure on firm's multiple innovation capabilities. Management Decision, 53(10), 2457–2476. https://doi.org/10.1108/MD-07-2014-0431
- Demirkan, I. (2018). The impact of firm resources on innovation. European Journal of Innovation Management, 21(4), 672–694. https://doi.org/10.1108/EJIM-12-2017-0196
- Dyer, J. H., & Hatch, N. W. (2006). Relation-specific capabilities and barriers to knowledge transfers: Creating advantage through network relationships. Strategic Management Journal, 27(8), 701–719. https://doi.org/10.1002/smj.543
- Fu, X., Fu, X., Romero, C. C., & Pan, J. (2021). Exploring new opportunities through collaboration within and beyond sectoral systems of innovation in the fourth industrial revolution. Industrial and Corporate Change, 30(1), 233–249. https://doi.org/10.1093/icc/dtaa058
- Gao, G. Y., Xie, E., & Zhou, K. Z. (2015). How does technological diversity in supplier network drive buyer innovation? Relational process and contingencies. Journal of Operations Management, 36(1), 165–177. https://doi.org/10.1016/j.jom.2014.06.001
- Hagedoorn, J., Lokshin, B., & Zobel, A. K. (2018). Partner type diversity in alliance portfolios: Multiple dimensions, boundary conditions and firm innovation performance. Journal of Management Studies, 55(5), 809–836. https://doi.org/10.1111/joms.12326
- Huang, S. F., Chen, J., & Liang, L. (2018). How open innovation performance responds to partner heterogeneity in China. Management Decision, 56(1), 26–46. https://doi.org/10.1108/MD-04-2017-0452
- Jaklic, A., Damijan, J. P., Rojec, M., & Kuncic, A. (2014). Relevance of innovation cooperation for firms' innovation activity: The case of Slovenia. Economic Research-Ekonomska Istraživanja, 27(1), 645–661. https://doi.org/10.1080/1331677X.2014.975513
- Jiang, R., Tao, Q. T., & Santoro, M. D. (2010). Alliance portfolio diversity and firm performance. Strategic Management Journal, 31(10), 1136–1144. https://doi.org/10.1002/smj.869
- Jiang, Y., Yang, Y., Zhao, Y., & Li, Y. (2020). Partners' centrality diversity and firm innovation performance: Evidence from China. Industrial Marketing Management, 88, 22–34. https://doi.org/10.1016/j.indmarman.2020.03.020
- Kang, Y., Xie, B., Wang, J., & Wang, Y. (2018). Environmental assessment and investment strategy for China's manufacturing industry: A non-radial DEA based analysis. Journal of Cleaner Production, 175, 501–511. https://doi.org/10.1016/j.jclepro.2017.12.043
- Krolikowski, M., & Yuan, X. J. (2017). Friend or foe: Customer-supplier relationships and innovation. Journal of Business Research, 78, 53–68. https://doi.org/10.1016/j.jbusres.2017.04.023
- Lee, D., Kirkpatrick-Husk, K., & Madhavan, R. (2017). Diversity in alliance portfolios and performance outcomes: A meta-analysis. Journal of Management, 43(5), 1472–1497. https://doi.org/10.1177/0149206314556316
- Li, M. X. (2019). Diversity of board interlocks and the impact on technological exploration: A longitudinal study. Journal of Product Innovation Management, 36(4), 490–512. https://doi.org/10.1111/jpim.12488
- Lucena, A., & Roper, S. (2016). Absorptive capacity and ambidexterity in R&D: Linking technology alliance diversity and firm innovation. European Management Review, 13(3), 159–178. https://doi.org/10.1111/emre.12074
- Marhold, K., Kim, M. J., & Kang, J. (2017). The effects of alliance portfolio diversity on innovation performance: A study of partner and alliance characteristics in the bio-pharmaceutical industry. International Journal of Innovation Management, 21(01), 1750001–1750220. https://doi.org/10.1142/S1363919617500013
- Martinez, M. G., Zouaghi, F., & Garcia, M. S. (2017). Capturing value from alliance portfolio diversity: The mediating role of R&D human capital in high and low tech industries. Technovation, 59, 55–67. https://doi.org/10.1016/j.technovation.2016.06.003
- Oerlemans, L. A. G., Knoben, J., & Pretorius, M. W. (2013). Alliance portfolio diversity, radical and incremental innovation: The moderating role of technology management. Technovation, 33(6–7), 234–246. https://doi.org/10.1016/j.technovation.2013.02.004
- Patatoukas, P. N. (2012). Customer-base concentration: Implications for firm performance and capital markets. The Accounting Review, 87(2), 363–392. https://doi.org/10.2308/accr-10198
- Piening, E. P., Salge, T. O., & Schafer, S. (2016). Innovating across boundaries: A portfolio perspective on innovation partnerships of multinational corporations. Journal of World Business, 51(3), 474–485. https://doi.org/10.1016/j.jwb.2016.01.001
- Potter, A., & Paulraj, A. (2020). Building supplier innovation triads: The effects of leadership relationships and alliance partner diversity. International Journal of Operations & Production Management, 40(2), 144–172. https://doi.org/10.1108/IJOPM-07-2018-0418
- Qiu, T. J. (2018). Dependence concentration and fairness perceptions in asymmetric supplier-buyer relationships. Journal of Marketing Management, 34(3–4), 395–419. https://doi.org/10.1080/0267257X.2018.1450281
- Sarpong, O., & Teirlinck, P. (2018). The influence of functional and geographical diversity in collaboration on product innovation performance in SMEs. The Journal of Technology Transfer, 43(6), 1667–1695. https://doi.org/10.1007/s10961-017-9582-z
- Shukla, D. M., & Mital, A. (2018). Effect of firm's diverse experiences on its alliance portfolio diversity: Evidence from India. Journal of Management & Organization, 24(5), 748–772. https://doi.org/10.1017/jmo.2016.26
- Song, J. (2016). Innovation ecosystem: Impact of interactive patterns, member location and member heterogeneity on cooperative innovation performance. Innovation, 18(1), 13–29. https://doi.org/10.1080/14479338.2016.1165624
- van Beers, C., & Zand, F. (2014). R&D cooperation, partner diversity, and innovation performance: An empirical analysis. Journal of Product Innovation Management, 31(2), 292–312. https://doi.org/10.1111/jpim.12096
- von Raesfeld, A., Geurts, P., & Jansen, M. (2012). When is a network a nexus for innovation? A study of public nanotechnology R&D projects in The Netherlands. Industrial Marketing Management, 41(5), 752–758. https://doi.org/10.1016/j.indmarman.2012.06.009
- Wang, C. H., & Quan, X. I. (2017). The effect of R&D alliance diversity and network position on firm innovation performance: Evidence from the emerging biotechnology industry. Science Technology and Society, 22(3), 407–424. https://doi.org/10.1177/0971721817723374
- Wang, X., Zou, H. H., Zheng, Y., & Jiang, Z. H. (2019). How will different types of industry policies and their mixes affect the innovation performance of wind power enterprises? Based on dual perspectives of regional innovation environment and enterprise ownership. Journal of Environmental management, 251, 109586. https://doi.org/10.1016/j.jenvman.2019.109586
- Wuyts, S., & Dutta, S. (2014). Benefiting from alliance portfolio diversity: The role of past internal knowledge creation strategy. Journal of Management, 40(6), 1653–1674. https://doi.org/10.1177/0149206312442339
- Yoon, W. J., Lee, D. Y., & Song, J. Y. (2015). Alliance network size, partner diversity, and knowledge creation in small biotech firms. Journal of Management & Organization, 21(5), 614–626. https://doi.org/10.1017/jmo.2015.16
- Zhang, X. W., Wang, L. X., & Chen, F. (2021). R&D subsidies, executive background and innovation of Chinese listed companies. Economic Research-Ekonomska Istrazivanja, 34(1), 484–497. https://doi.org/10.1080/1331677x.2020.1792324
Appendix A:
Results of robustness tests
Table A1. Varying measures of SDi,t-1 and CDi,t-1.
Table A2. Varying measure of innovation performance.