
 ?Mathematical formulae have been encoded as MathML and are displayed in this HTML version using MathJax in order to improve their display. Uncheck the box to turn MathJax off. This feature requires Javascript. Click on a formula to zoom.
Abstract
A sustainable financial and economic system is the need of the hour, especially in the context of a deteriorating environment. Environment quality is very important for healthy labour life, contributing to economic growth more effectively. China is one of the largest economies in the world, which is the residency of 18.47% of total humans on planet earth. Keeping environment is a major policy concern; this study investigates the relationship between environmental quality and economic growth in the presence of human capita and renewable energy use. The study uses the data for the time period of 1995–2017. While conducting nonparametric tests, the study applied QMMR regression approach to hand the issues of cross-sectional heterogeneities and endogeneity simultaneously. The study found that GDP is positively associated with carbon emissions throughout all the quantiles. Foreign trade is showing mixed results, most probably due to changes in trade patterns, and a hidden heterogeneity across provinces in China.
1. Introduction
China is one of the busiest and most highly connected economies after implementing reforms and opening to trade with both developing and developed countries worldwide. China is growing faster with the expansion of production activities over the years. China is known as the second largest economic cluster in the world. High-scale production activities in large economies have significant negative environmental consequences. China is consuming large amount of fossil fuel energy, which makes causes Carbon emissions, leading China towards a top-ranking pollution-causing economy in world (Shi et al., Citation2022; Yang et al., 2018). Black carbon emissions are increasing in China due to increasing dependency on coal reserves. According to De Jong and Wagner (Citation2022), China contributes 11.9 billion tons of carbon to the atmosphere every year and is the minimum possible estimate but the second largest in the world. China has the largest population chunk of the world, which consumer goods and services and it is certain that each activity adds some carbon to the atmosphere. The release of pollutants is increasing, and pollutants such as sulphur dioxide, nitrogen oxides, and particulates are present at a high level in China. There exists an algebraic relationship between urbanization and environs. Urbanization has a positive impact on carbon emission due to high density of population and faster rate of economic activities (Dash et al. Citation2022). Human are causing significant damage to the atmosphere, it leads to changes in climatic conditions. Human-induced climate change is instigating treacherous and widespread disruptions in the natural ecosystem and is disturbing the eke-out-a living of billions of individuals in different parts of the world (IPCC, 2022).
Environment has become the priority concern of policy makers all over the world. Various methods are used to evaluate the environmental quality and its statistical relationship with other macroeconomic indicators, economic growth, foreign direct investments (FDIs), institutional quality, and many others. Environmental quality plays a key role in the sustainability of economic growth to flourish the economy. The impact on the environment has led to debates among in world countries to improve the quality of environment and economic growth should be sustainable to emit less carbon emission (CO2) in the world. World countries have initiated to put forward their aim limit on carbon dioxide emissions with increasing economic growth. The environment Kuznets Curve (EKC) hypothesis relationship has been explored in several studies and this hypothesis argues that initially, carbon emission increases as the income of a society or nation increases, but after reaching specific limits, the relationship between ecological degradation and economic growth changes (ALkhars, Citation2022; Frodyma, Citation2022; Hui & Junheng, Citation2021; Simionescu, Citation2022). The emission decreases because of changes in the technology or the composition of inputs consumed during the production process. The Kuznet Curve explains that in the initial stage, carbon dioxide increases with the increase in economic growth and worsens the environment. Still, after reaching an approximately optimal point, the environment quality starts to recover with increasing economic development (Anwar, Citation2022). The study by Tatoğlu and Polat (Citation2021) established none linear relationship between economic progress and environmental quality.
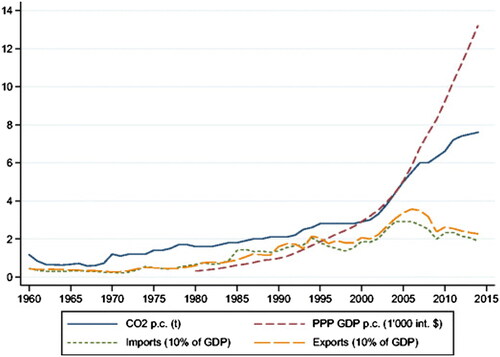
Theory also explains economic growth can provide a solution to improve the environment, allowing certainly causes ecological deterioration in the initial stage of economic development (Kuznets, Citation1955). The academics writers have established that including other determinants of CO2, economic growth, foreign trade (FTR), renewable energy, and human capital (HC) are critically important factors for policy making exercises. Trade openness does not help to improve the global environment until environmental standards are applied because goods transferred from surplus economies to the economies in deficit contain carbon emissions and are used by the consumer. Countries expanding their trade without carbon caps are contributing to global environmental degradation. Imports of dirty goods can lead to an increase in carbon dioxide release while exports can also help to counter it. It is possible through the channel of technological overspill from developed nations towards developing countries. So, the net effect of trade openness can be argued that it reduces carbon dioxide (Li & Wang, Citation2021; Wang et al., Citation2020; Xuan et al., 2022; Zhang et al., Citation2020). On the other hand, some researchers found that net exports increase carbon dioxide emissions and importing countries are also contributing higher carbon dioxide emission by not following the global environmental standards so overall, both countries are degrading the environment in the case of carelessness in policy making (Huang & Zhao, Citation2018; Yunfeng & Laike, Citation2010). FDIs have been also associated with carbon dioxide releases. It has a positive effect when economy expands because it does not bring clean technology to reduce environmental degradation in many cases because FDI is not often subjected to the environmental objectives of the economy (Kivyiro & Arminen, Citation2014; Tang & Tan, Citation2015). But if FDI is specifically coming for the imports of clean energy technology, it will surely improve the environmental quality in long run. Since the past five decades, China has been moving towards development (economic growth) over time. However, along with the increased economic growth, CO2 emissions and trade (imports and exports) also increase. Thus, all these variables in China are found to increase over the passage of time, which are provided in .
Figure 1. Economic growth, CO2 emissions, and trade in China.
Source: Franzen and Mader (Citation2016).
Following the backdrop, the objectives of this study are to empirically examine the influence of economic growth on CO2 emissions in Chinese provinces. Since the economic growth of the said country is rapidly increased over the past few decades, which could have a substantial influence on the environmental quality as the CO2 emissions also increase quickly in these times. As discussed, the increased economic growth is certainly the outcome of higher industrial production, which is further influenced by FTR. An increase in FTR speeds up the energy demand; hence, the increased energy consumption could substantially affect the environmental quality. Therefore, this study also aims to explore the influence of FTR on the CO2 emissions of the region. Since China is an emerging economy that is highly participating in the environmental recovery and sustainability objectives. Therefore, renewable energy consumption (REC) and HC are considered substantial factors in terms of reduction of fossil fuel demand and increased productivity. Therefore, this study observed the significance of these variables on environmental quality, which are empirically analysed for the Chinese provinces.
The debate of limiting carbon dioxide released from the world, as it contributes to global warming. The research community has shifted, and the current focus is on shifting from fossil fuel to clean Energy (Adams & Nsiah, Citation2019). Renewable energy reduces carbon dioxide releases and improves ecological quality, allowing for economic growth (Njoh, Citation2021; Shan et al., Citation2021; Shao et al., Citation2021). This policy has geared developed and developing countries to adopt renewable energy such as, wind, hydro, and solar. The countries focusing more on HC also contribute less emission of carbon dioxide (CO2) (Langnel et al., Citation2021; Ma et al., Citation2019; Yao et al., Citation2020). The contribution of this article to the existing literature of economics can be categorized in a way that this article. First, investigates the relationship between CO2 and other economic indicators on provincial level in China. Second, the study uses panel quantile regression for provinces level analysis in China as few studies have done this, but several econometric modelling aspects are still not addressed properly. This article attempts to address these gaps. The remaining part of the article is as follows: Section 2 does review of the literature, Section 3 shows the theory followed by the empirical methodologies, Section 4 discusses the results, and Section 5 concludes the articles.
2. Literature review
2.1. Economic growth and CO2 emissions
Daunting climate change is becoming a challenge posed by the human induced deterioration of world environment. Increasing temperature and carbon dioxide have worsened climatic conditions. The carbon dioxide (CO2) is increasing over the years with the country’s population. Carbon emissions are associated with economic growth. Which coming from automobile, extraction of oil and gas company and industry and these sectors and industries and well-known key factors to determine the economic growth and development (Marjanovic et al., Citation2016). Many research scholars have established the relationship between CO2 and economic growth. Yet, it is not concluded on the direction and nature of the relationship between economic growth and environmental quality. As study has examined this relationship by using the data of 16 districts with merging of XuanWu District and Chongwen District with Xicheng District and Dongcheng District for 2006–2017 (Shi et al., Citation2022), and it explains that increasing technology and developing industrial structure, the economic growth can be isolate or decoupled from CO2 emissions. But conversely, another side argues that the study by Chaabouni and Saidi (Citation2017) also explores the statistical relationship between GDP per capita and CO2 emissions and establishes that there exist a negative impact on GDP growth environmental quality, indicating that higher GDP leader to higher level CO2 emissions. Similar findings of Lau et al. (2014) with additional information that institutional quality improvements can also significantly reduce CO2 through effective governance system. Some researchers have shown a positive relation between CO2 and economic growth including the study by Wu et al. (Citation2021), which revealed that natural gas consumption can contribute to increase economic growth but simultaneously GC contributes less to economic growth than coal and oil at both national and regional levels. Residents and industries’ high carbon goods and service demand leads to more CO2 emissions, but the CO2 emissions reduction induced by the increasing share of NGC is insufficient. Similar findings were also shared by Al-mulali et al. (Citation2013). Few researchers also explored the presence of the EKC in South Asia. In the initial stage as economic growth rises, ecological deterioration increases, but within, CO2 emission decreases as economic development starts to take pace after the threshold point (Jun et al., 2021).
2.2. Renewable energy and CO2 emissions
Energy plays an exceptionally important role in any economy’s economic growth and development. Energy use has several environmental consequences, and emissions are central to this debate. It depends on the economy’s energy mix to evaluate the emission generated from the energy sector. China’s energy sector is the biggest energy sector in the world, serving more than 1.4 billion people at once. It contributes a significant amount of carbon emissions (Jin et al., 2017). Coal is the dirties input in the energy sector, followed by fossil fuel and oil. However, it is established that the thermal power plant energy releases more carbon dioxide (CO2) while renewable help to counter or reduce it as it releases a limited amount of CO2. It is also the main theme of Sustainable Development Goals (SDG) to produce clean energy and to adopt clean fossil fuel technology at the end of 2030. Studies have investigated and reinvestigated the relationship between renewable energy and carbon dioxide release (CO2). For instance, the study by Awan et al. (Citation2022) used 10 developing data countries from 1996 to 2015 and found that renewable Energy controls CO2 emissions. The findings of some other studies also confirmed that the long-run and short-run relationship exists between carbon emission and energy use (Long et al. Citation2015; Ridzuan et al. Citation2020; Wang et al. Citation2021). On the other hand, Adams and Nsiah (Citation2019) revealed that renewable energy emits more carbon dioxide (CO2) because of its sporadic nature and insufficient storage technology, this emission argument is based on life cycle hypothesis.
2.3. FTR and CO2 emissions
There are a number of theories that explain the relationship between trade and environment. The book by Siebert (2011) mentions that environmental scarcity influences comparative advantage and indicates that environment and trade are highly associated and interdependency is quite undeniable. To meet the demand of increasing population, imports are always important for the economy’s survival as the economy cannot produce everything inside the economy’s border. Environmentally harsh inputs based, imports increase environmental degradation, while exports decline carbon dioxide releases in own country but increase it in the hosting country of the exports. Recent studies have established this link. One study found a positive relationship between imports and carbon dioxide (CO2) and a negative relationship between exports and CO2 under Belt and Road Initiative for trade. These findings are further confirmed by another study by Zhang et al. (Citation2018) at the national level showed a negative effect on CO2. A different study established a relationship between CO2, FDI, and Domestic Capital Stock by utilizing the data of 30 provinces from China for the period 2001 to 2015. The study indicated that FDI has a positive association with CO2 ejection (Zhang et al. Citation2019). It is often invested in development projects which are less environmentally sound and friendly and causes a huge cost to environment. An Outward FDI (OFDI) also has positive relationship with carbon dioxide releases; however, this positive association can be tightened through technological improvement (Yang et al., Citation2021). Wang (Citation2021) indicated that trade openness declines carbon emission in lower income and lower-middle income groups, while trade openness increases carbon emission in upper middle-income group. As example of China, the country has been included in its world supply chains as export policy reforms declines global carbon dioxide emission (Chen Citation2019). This indicates that China has excelled in trade across the world but it is further debatable to explore both efficiency of trade, in terms of economic competitiveness and second environmental competitiveness of trade sector and changing patterns with improvement in environmental regulations.
2.4. Human capital and CO2 emissions
HC is reported in terms of educated people at organization and national level studies. In addition to the abovementioned factors, HC is also a significant contributing factor to the environment. Researchers have established a statistically significant and negative relationship between CO2 and HC (Zhang et al., Citation2021). However, some studies have shown positive relationship between environmental degradation and HC but most of the studies are not presenting statically sound findings. The study by Khan et al. (Citation2021) argued that HC by nature is well understood and familiar with the environment and responds responsibly to certain changes and helps environment to receive minimum damages when compared with Onifade (Citation2021), Ortiz (2022), Rahman (Citation2021), Yao et al. (Citation2020), Sarkodie (Citation2020), and Pata and Caglar (2021) who established negative relationship between HC development index and environmental pressure. These gaps are still waiting for sound econometric techniques to express the effects in the context of theory and data.
2.5. Literature summary
Following the abovementioned literature, this study summarized that economic growth has a two-way influence. Specifically, most of the literature claims that higher economic growth tends to enhance the per capital income level, which further increase demand for goods and services, which further increase the energy demand, and hence the level of CO2 emission increases. On the other hand, there are studies (earlier mentioned) that argue the increased level of income tends the industrialists and households use environmentally friendly energy resources, which enhances the level environmentally friendly energy resources and advanced technology, which decreases the CO2 emissions level. On the other hand, the literature asserted that FTR asymmetrically influences the environmental quality. That is, imports of goods and services significantly increase the pollution level due to the imports and consumption of energy-intensive goods and services. However, exports of goods and services leads to the transfer of energy intensive products to other regions, which reduce the level of emissions in the host country. Besides, the literature also shows that REC is a substantial factor of environmental sustainability as it replaces the traditional energy resources with the technologically advanced and efficient resources, reducing the pollution level. Moreover, the studies regarding HC’s influence on the environment are very limited. Still, the available literature reveals that HC has both positive and negative influences on the pollution level, which further depends on various economic, financial, and institutional factors. Apart from the literature summary, this research also provides the recent literature strand’s summary in .
Table 1. Literature summary.
2.6. Literature gap
There are several dimensions of gap, which this study is attempting to fulfil. First, few studies have investigated the relationships between CO2 emissions and HC using panel model for provincial-level data in China. Second, FTR is not explored more often in the context of CO2 impact, especially in the context of China, as it is an important factor of the Chinese economy and this should be further investigated in the case of China. Third, renewable energy has mixed trends in different countries that should be further investigated. Lastly, few studies have explored HC for tertiary education, while the above studies have used the human development index. Hence, this article attempts to reduce these loopholes of the former works by using panel data from 1995 to 2017 for Provinces of China.
3. Methods and materials
3.1. Theoretical framework and model specification
Over the past few decades, the environmental quality has been pushed to a miserable condition by the fast growing population and increasing demand for consumption goods with increasing per capita income and progressive intensifying the use of technology; not keeping the environmental standards in action. Using the modern, sophisticated econometric techniques, we can verify the theoretical association between carbon emissions and economic growth, with improvement in energy use choice on provincial level in China and the growth of HC over the years across different Provinces of China. The study estimated the association between environment quality and carbon dioxide emissions and established that CO2 emission increases with an increase in economic growth in the case of developing countries (Balsalobre-Lorente et al., Citation2018). It is also suggested that the selection of energy can define an increase or decrease in the level of CO2. The use of fossil fuel increases the CO2 emission where renewable energy can reduce the emission of CO2 (Inglesi-Lotz & Dogan, Citation2018). Therefore, the association of both economic growth and REC could be captured mathematically as: and
In continuation, Albulescu et al. (2020) added to the discussion by further expansion of theoretical debate, the FTR inflow increases economic growth and income. Still, it also has positive impact on CO2 that FTR increases CO2 emission in China and emerging countries.Footnote1 But when FDI transfers their environment friendly technology with the passage of time, the CO2 releases afterward decline,Footnote2 which could be given as So, this analysis is also done and percentage share of FTR inflow in the total energy consumption level (FTR). The analysis also incorporates the impact of HC on CO2 release levels, so the number of graduates is taken as proxy of HC. As theory suggest, education has negative relationship with CO2 and secondary education has negative affect on CO2.Footnote3 It can also deteriorate CO2 release if institutions are not strong to play role to control CO2 release, which may be given as
Moreover, the validity of the long-run estimations is evaluated two-fold. First, we utilize an alternate regression approach to re-estimate the models. The choice to adopt an alternate approach was inspired by the need to examine the validity of the long-run estimates over various regression methods. Second, in keeping with the theoretical foundations of the EKC hypothesis, the estimation techniques are reinforced with the square term of real GDP to analyse the nonlinearity of the real GDP-CO2 emissions nexus. The positive and negative signals of the elasticity coefficients related to real GDP and its squared component, accordingly, could confirm the validity of the EKC hypothesis. To estimate and validate this argument, or the arguments close to this, starting from the article by Ehrlich and Holdren (Citation1971), which made an effort to describe ecological pressure effects of population growth and its implications for human welfare. The authors presented IPAT identity, with some unique characteristics to explain the phenomenon and their research found that growth in population elucidates undesirable influences on environment, and established that increase in income is more significantly contributing to emission of carbon dioxide (CO2). But the issue of absolute residuals still remains unsolved in many cases to cross-sectional heterogeneities. And estimated results are exposed to criticism in the literature of econometrics. Furthermore, the study by Alotaibi and Alajlan (Citation2021) shared more detail on the validation of argument that human activities are crucial in determining the amount of carbon emissions. In their article, the authors have used the following regression as quantile regression on panel data. If we construct in the context of this study, the following equation can be written as:
(1)
(1)
where X is a vector that collectively represents the explanatory variables, consists of FTR, economic growth, renewable energy use, and HC. The above equation could be transformed into regression version as follows:
(2)
(2)
For this article, the CO2 releases for provinces are linearly related to economic growth, REC, FTR, and HC. Now it is important to understand the selection process of control variables. The equation describes the theoretical relationships, where ln represents the natural logarithm taken on dependent variable, which is CO2t and it is basically the per capita CO2 emissions at given point of time, indicated as t in the subscripts and Xn is the n number of explanatory variable. The symbol of α0 … αN is used in the model for parameters. Applying moments to the quantiles to reduce the absolute means error, this study uses the method by Machado and Silva (Citation2019) that is MMQR model to investigate the heterogeneous and distributional impacts across quantiles between carbon emissions and the covariates, which in this case are provincial GDP, CO2, REC, FTR, and HC.
The advantage of using quantile regression over other models in the literature is to control of unseen heterogeneity across the Provinces of China in terms of energy use and other environmental characteristics. The quantile regression process is conducted to choose the best possible sets of explanatory variables, which can explain maximum variation in the study’s dependent variable. Recognizing the final correct possible econometric model, which best fits the situation, is the fixed effect MMQR technique, which can capture the covariance of conditional heterogeneities across provinces in this case. For each set of variables, this study has utilized multiple quantiles on 0.25, 0.50, 0.75, and 0.90, while estimating the parameters of the econometric model.
3.2. Econometric methodology
In this article, the authors have used panel data to resolve the issue of absolute error mean and panel characteristics are reported and corrected by using the cross-sectional dependency (CSD) and slope homogeneity problems are also looked after by checking it statically to avoid the assessment predisposed outcomes of the econometric exercise. This is a very effective approach, so to estimate CSD and the slope homogeneity problems, this article has adopted the methodology of De Hoyos et al. (Citation2006) and Pesaran (Citation2006).
In order to obtain the empirical statistics for the slope heterogeneity, the following equations may be used:
(3)
(3)
(4)
(4)
where both the and
reports the normal slope homogeneity and adjusted slope homogeneity. The stated test assumes the homogeneity of slope coefficients. On the other hand, the cross-section dependence of the variables could be evaluated via consuming the following mathematical formula, which assumes the panel cross-section independence:
(5)
(5)
Afterwards, let us anticipate a standard panel regression model:
(3)
(3)
where β represents time invariant disruption or movement which composed of is a K × 1 vector of parameters and xit.
is presumed to be ‘independent and identically distributed’ across time and cross-sectional units under the null hypothesis (Khan et al., Citation2021).
is expected to be connected across all the crossectional with null hypothesis, presumed as no serial correlation.
Therefore, the proposition can be written as:
(6)
(6)
Against the alternative hypothesis,
where shows the disturbance of summation-moment correlation, which is assumed as
The total count of most likely combinations can be denoted As (
) it increases with an increases in (N).
To proceed with raw data in excel sheet, first of all, the study uses the panel unit root and cointegrating estimation technique to analyse the order of integration. It is done to understand the data in a better way and best suitable econometric technique could be used. Most of the studies have used the first-generation unit root and cointegrating estimation technique but there is a debate in the literature of econometrics that concludes that it is not a suitable method to deal the problem of CSD. This argument is based on the nature of test and functional capacity of test because first-generation techniques assume that cross-sectional unites are not interdependent in any aspect, which can lead to spurious regression. The solution is provided in this study by applying more powerful test. This study has utilized the second-generation Cross-sectional Augmented Im-Pesaran-Shin (CIPS) panel unit root test of Pesaran (Citation2007). The technique, when compared with first-generation techniques, is far more reliable and consistent in terms of stationarity properties by addressing CSD problems (Wang et al., Citation2020).
In this CIPS technique, the null hypothesis is predicted as nonstationary by using t-statistics (i.e., unit root problems present) instead of alternate hypothesis of stationary (i.e., unit root problems do not present). On the contrary, the article also uses second-generation (Westerlund, Citation2007) panel cointegrating method to establish the cointegrating relationships between the variables. The technique predicts the cointegrating properties in cross-sectional dependent heterogeneous panel data sets and estimates four error-correction-based panel non-cointegrating test statistics.
This method is favoured for the reason that it concords with heterogeneity and the issue of endogeneity by allowing for disproportionate and nonlinear relationship between environmental degradation and the determining factors. The final QMMR model is based on conditional quantile estimations Qy (ABC) representing the dimensions of location-scale variants and it can be expressed by the following equation:
where α parameter to be estimated, xit ′ β vector of conversions which is identically and independently distributed across all the cross-sectional components and at fixed as well and Ζit are the differentiable conversions
3.3. Data and variables
The data are obtained from 1995 to 2017 at the provincial level for China. The data on CO2 emissions (indicated by CO2) and REC, FTR, and HC are extracted from the EPS China. It is a panel data sets with 30 cross-sectional units. EPS China http://www.epschinadata.com/index.html?flag=0.
4. Empirical results and discussion
Descriptive statistics are given in . presents the results of slop heterogeneous test of Pesaran and Yamagata (Citation2008). The results of the test indicate that statistical analysis is significantly highlighting alarm of slope coefficients heterogeneities in the model one and model shown with adjusted delta value.
Table 2. Descriptive statistics.
Table 3. Testing for slope heterogeneity.
shows the CSD test of Pesaran (Citation2004) results and this test statistic is significant which shows that Provinces of China are adopting same economic and FTR policies. As China has committed to achieving SDG to limit carbon dioxide by 2030, its provinces are also adopting policies to reduce ecological degradation. These tests are important to address problems of CSDs and the results show that there exists a significant level of CSDs across provincial unites in the data and p-values are close to zero, which means that data are correlated across panel groups.
Table 4. Testing for cross-sectional dependence (CSD).
shows the CIPS Panel Unit Root Test results of Pesaran (Citation2007). The test statistics are significant at the 1% and 5% level, which means that all variables are cointegrated and stationary at first difference I(1) and are mean-reverting. It also means that estimates are not spuriously regressed.
Table 5. Pesaran (Citation2007) panel unit root test.
shows the results of Westerlund (Citation2007), cointegrating test for the province level data of China. The results show a long-run association between CO2 and economic growth across the provincial indicators of China because two models have cointegrating (Gt and Pt) at 1% and 5% significance. So, we can forecast long-run coefficients using this technique based on the model long-run relationship as the results indicate that null hypothesis of no cointegrating relationship is rejected at a 1% level of significance for all the tests. Therefore, the study further applies long-run quantile regression to estimate a more sophisticated relationship between environment and economy.
Table 6. Westerlund ECM panel cointegrating tests.
The results in show that there is a proof of positive relationship between economic growth and carbon emissions in China. The provincial level data analysis indicates that GDP growth is significantly contributing to negative environmental consequences in terms of carbon emissions across all the components of first and second quantiles (0.25, 0.50). Such significant estimates are in line to the existing studies by Shi et al. (Citation2022), Wu et al. (Citation2021), and Safi et al. (Citation2021a), which also validates the positive influence of economic growth on carbon emissions. Yet, the relationship between income growth and emissions is not significant at the scale component of the second quantile (0.50). The evidence approves the association between renewable energy and emissions in the long run, especially since all the coefficients are statistically significant. Still, the direction of the relationship shows that positive relationship is stronger than the carbon offsetting effects of renewable energies. In first quantile, Chinese trade across the world is helping to reduce emissions at location quantile and in the second quantile it contributes to the negative environmental outcomes at same location component. However, the net effect of trade is quite helpful in offsetting China’s carbon across provincial-level outcomes. The present results are consistent with the existing studies by Safi et al. (Citation2022a), Jiang et al. (Citation2022), and Khan et al. (Citation2020a), which validate the negative influence of trade and exports in particular on CO2 emissions. Improvement in HC reduces carbon emissions and its shows a statistically significant long-run relationship between all the quantiles. These findings are in line with the empirical studies by Onifade (Citation2021), Qin et al. (Citation2021b), and Khan et al. (Citation2020d), which confirm the negative and significant role of HC in environmental degradation.
Table 7. Method of moment quantile regression.
indicates the long-run association between emissions and given macroeconomic indicators for the third and fourth quartile estimates. The results show that the expansion of economy leads to increase in environmental pressure in early stage, carbon dioxide (CO2) increase slightly. Normally it tends to increase in first quantile with the economic growth expansion and decline in subsequent quantiles. Still, unconventionally in this case it remains constant in second quantile and in third quantile. This indicates that GDP growth has never been utilized to implement effective environmental measures to reduce the emission level in production activities. The China provinces are adopting more renewable energy and this policy has produced fruitful results and renewable energy technology is not emitting carbon dioxide, as this figure shows. Not only this study, but the existing literature, such as Qin et al. (Citation2021b) and Khan et al. (Citation2020a, Citation2020c) , also indicates the negative and significant impact of renewable energy on the CO2 emissions. Similarly, FTR has also declined in carbon dioxide and the country is not degrading environment. Therefore, the empirical estimates are in line with the studies by Safi et al. (Citation2021b, Citation2021c) and Khan et al. (Citation2020c), which empirically provide evidence of the negative impact of trade on environmental degradation. HC also reduced carbon dioxide till fourth quantile, while it started to increase in the fifth quantile again. But overall, HC has negative association with carbon dioxide emission, as depicted by Ortiz (2022), Rahman (Citation2021), and Yao et al. (Citation2020).
Table 8. Method of moment quantile regression.
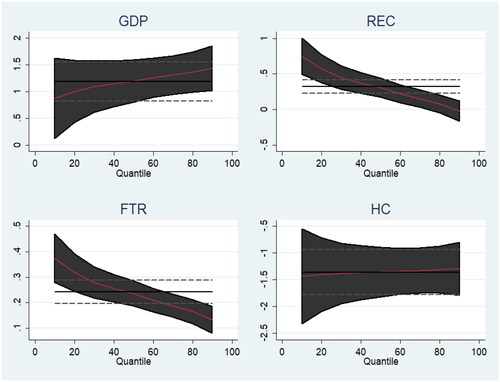
The empirical results are further verified by the method of moments quantile regression graphical representations given in . Here, we can see that the same coefficients with the same trend are provided.
Figure 2. Method of moment quantile regression results.
Source: Authors own calculations.
5. Conclusion
The study pushes forward the debate of increasing access to renewable energy sources to reduce the economic and environmental costs to society. Renewable energy increases net social welfare by reducing the negative effects on the environment and improving health and quality of life. This study controlled for CSDs and heterogeneities in the cross-sectional units of the given panel data from China. The study found that the results of MMQR reveal quite uncommon results, where carbon caps never appear and carbon emissions do not respond to income quantiles nonlinearly but indicate a linear and positive trending relation in long run. It is quite plausible to think that how the use of renewable energy is still not significant for the improvement environment in China. HC growth can improve the environment because highly valued HC attach higher values to pristine environment and reshuffles their consumption patterns with increasing income level. China is an ecologically stressed economy due to the increasing population, which puts further pressure on energy use; thus, China should focus on a renewable energy policy to reduce the carbon footprints of the economy.
Notes
1 The heterogeneous effects of FDI and foreign trade on CO2 emissions: evidence from China.
2 file:///C:/Users/dhsw6/Downloads/sustainability-11-02682-v2.pdf
3 Role of education and economic growth on the CO2 emissions in Saudi Arabia.
References
- Adams, S., & Nsiah, C. (2019). Reducing carbon dioxide emissions: Does renewable energy matter? Science of the Total Environment, 693, 133288. https://doi.org/10.1016/j.scitotenv.2019.07.094 [InsertedFromOnline
- AlKhars, M. A., Alwahaishi, S., Fallatah, M. R., & Kayal, A. (2022). A literature review of the environmental Kuznets curve in GCC for 2010–2020. Environmental and Sustainability Indicators, 14, 100181. https://doi.org/10.1016/j.indic.2022.100181
- Al-Mulali, U., Lee, J. Y., Mohammed, A. H., & Sheau-Ting, L. (2013). Examining the link between energy consumption, carbon dioxide emission, and economic growth in Latin America and the Caribbean. Renewable and Sustainable Energy Reviews, 26, 42–48. https://doi.org/10.1016/j.rser.2013.05.041
- Alotaibi, A. A., & Alajlan, N. (2021). Using quantile regression to analyze the relationship between socioeconomic indicators and carbon dioxide emissions in G20 countries. Sustainability, 13(13), 7011. https://doi.org/10.3390/su13137011
- Anwar, M. A., Zhang, Q., Asmi, F., Hussain, N., Plantinga, A., Zafar, M. W., & Sinha, A. (2022). Global perspectives on environmental Kuznets curve: A bibliometric review. Gondwana Research, 103, 135–145. https://doi.org/10.1016/j.gr.2021.11.010
- Awan, A., Abbasi, K. R., Rej, S., Bandyopadhyay, A., & Lv, K. (2022). The impact of renewable energy, internet use and foreign direct investment on carbon dioxide emissions: A method of moments quantile analysis. Renewable Energy. 189, 454–466. https://doi.org/10.1016/j.renene.2022.03.017
- Balsalobre-Lorente, D., Shahbaz, M., Roubaud, D., & Farhani, S. (2018). How economic growth, renewable electricity and natural resources contribute to CO2 emissions? Energy Policy, 113, 356–367.
- Chaabouni, S., & Saidi, K. (2017). The dynamic links between carbon dioxide (CO2) emissions, health spending and GDP growth: A case study for 51 countries. Environmental Research, 158, 137–144. https://doi.org/10.1016/j.envres.2017.05.041
- Chen, Q., Loschel, A., Pei, J., Peters, G. P., Xue, J., & Zhao, Z. (2019). Processing trade, foreign outsourcing and carbon emissions in China. Structural Change and Economic Dynamics, 49, 1–12. https://doi.org/10.1016/j.strueco.2019.03.004
- Dash, D. P., Dash, A. K., & Sethi, N. (2022). Designing hydro-energy led economic growth for pollution abatement: evidence from BRICS. Environmental Science and Pollution Research, 1–18.
- De Hoyos, R. E., & Sarafidis, V. (2006). Testing for cross-sectional dependence in panel-data models. The Stata Journal, 6(4), 482–496.
- De Jong, R., & Wagner, M. (2022). Panel cointegrating polynomial regression analysis and an illustration with the environmental Kuznets curve. Econometrics and Statistics, https://doi.org/10.1016/j.ecosta.2022.03.005
- Ehrlich, P. R., & Holdren, J. P. (1971). Impact of population growth: Complacency concerning this component of man's predicament is unjustified and counterproductive. Science, 171(3977), 1212–1217.
- Franzen, A., & Mader, S. (2016). Predictors of national CO2 emissions: Do international commitments matter? Climatic Change, 139(3–4), 491–502. https://doi.org/10.1007/s10584-016-1795-x
- Frodyma, K., Papież, M., & Śmiech, S. (2022). Revisiting the environmental Kuznets curve in the European Union countries. Energy, 241, 122899. https://doi.org/10.1016/j.energy.2021.122899
- Hasnaoui, J. A., Rizvi, S. K. A., Reddy, K., Mirza, N., & Naqvi, B. (2021). Human capital efficiency, performance, market, and volatility timing of Asian equity funds during COVID-19 outbreak. Journal of Asset Management, 22(5), 360–375. https://doi.org/10.1057/s41260-021-00228-y
- Huang, L., & Zhao, X. (2018). Impact of financial development on trade-embodied carbon dioxide emissions: Evidence from 30 Provinces in China. Journal of Cleaner Production, 198, 721–736. https://doi.org/10.1016/j.jclepro.2018.07.021
- Hui, Y., & Junheng, M. (2021). Correlation analysis between regional economic differences and environmental pollution based on Kuznets Curve Model. Environmental Technology & Innovation, 22, 101444. https://doi.org/10.1016/j.eti.2021.101444
- Inglesi-Lotz, R., & Dogan, E. (2018). The role of renewable versus non-renewable energy to the level of CO2 emissions a panel analysis of sub-Saharan Africa’s Βig 10 electricity generators. Renewable Energy, 123, 36–43. https://doi.org/10.1016/j.renene.2018.02.041
- Ji, X., Chen, X., Mirza, N., & Umar, M. (2021b). Sustainable energy goals and investment premium: Evidence from renewable and conventional equity mutual funds in the Euro zone. Resources Policy, 74(102387), 102387. https://doi.org/10.1016/j.resourpol.2021.102387
- Ji, X., Zhang, Y., Mirza, N., Umar, M., & Rizvi, S. K. A. (2021a). The impact of carbon neutrality on the investment performance: Evidence from the equity mutual funds in BRICS. Journal of Environmental Management, 297(113228), 113228. https://doi.org/10.1016/j.jenvman.2021.113228
- Jiang, S., Chishti, M. Z., Rjoub, H., & Rahim, S. (2022). Environmental R&D and trade-adjusted carbon emissions: Evaluating the role of international trade. Environmental Science and Pollution Research International, 29(42):63155–63170. https://doi.org/10.1007/s11356-022-20003-9
- Khan, Z., Ali, M., Jinyu, L., Shahbaz, M., & Siqun, Y. (2020b). Consumption-based carbon emissions and trade nexus: Evidence from nine oil exporting countries. Energy Economics, 89(104806), 104806. https://doi.org/10.1016/j.eneco.2020.104806
- Khan, Z., Ali, M., Kirikkaleli, D., Wahab, S., & Jiao, Z. (2020a). The impact of technological innovation and public‐private partnership investment on sustainable environment in China: Consumption‐based carbon emissions analysis. Sustainable Development, 28(5), 1317–1330. https://doi.org/10.1002/sd.2086
- Khan, Z., Ali, S., Dong, K., & Li, R. M. (2021). How does fiscal decentralization affect CO2 emissions? The roles of institutions and human capital. Energy Economics, 94, 105060. https://doi.org/10.1016/j.eneco.2020.105060
- Khan, Z., Ali, S., Umar, M., Kirikkaleli, D., & Jiao, Z. (2020c). Consumption-based carbon emissions and International trade in G7 countries: The role of environmental innovation and renewable energy. The Science of the Total Environment, 730(138945), 138945. https://doi.org/10.1016/j.scitotenv.2020.138945
- Khan, Z., Malik, M. Y., Latif, K., & Jiao, Z. (2020d). Heterogeneous effect of eco-innovation and human capital on renewable & non-renewable energy consumption: Disaggregate analysis for G-7 countries. Energy (Oxford, England), 209(118405), 118405. https://doi.org/10.1016/j.energy.2020.118405
- Khan, Z., Murshed, M., Dong, K., & Yang, S. (2021). The roles of export diversification and composite country risks in carbon emissions abatement: Evidence from the signatories of the regional comprehensive economic partnership agreement. Applied Economics, 53(41), 4769–4787. https://doi.org/10.1080/00036846.2021.1907289
- Khan, Z., Sisi, Z., & Siqun, Y. (2019). Environmental regulations an option: Asymmetry effect of environmental regulations on carbon emissions using non-linear ARDL. Energy Sources Part A Recovery Utilization and Environmental Effects, 41(2), 137–155. https://doi.org/10.1080/15567036.2018.1504145
- Kivyiro, P., & Arminen, H. (2014). Carbon dioxide emissions, energy consumption, economic growth and foreign direct investment: Causality analysis for Sub-Saharan Africa. Energy, 74, 595–606. https://doi.org/10.1016/j.energy.2014.07.025
- Kuznets, S. (1955). Economic growth and income inequality. The American Economic Review, XLV(One).
- Langnel, Z., Amegavi, G. B., Donkor, P., & Mensah, J. K. (2021). Income inequality, human capital, natural resource abundance, and ecological footprint in ECOWAS member countries. Resources Policy, 74, 102255. https://doi.org/10.1016/j.resourpol.2021.102255
- Li, Z., & Wang, J. (2021). Spatial emission reduction effects of China’s carbon emissions trading: Quasi-natural experiments and policy spillovers. Chinese Journal of Population, Resources and Environmental, 19(3), 246–255. https://doi.org/10.1016/j.cjpre.2021.12.027
- Long, X., Naminse, E. Y., Du, J., & Zhuang, J. (2015). Nonrenewable energy, renewable energy, carbon dioxide emissions and economic growth in China from 1952 to 2012. Renewable and Sustainable Energy Reviews, 52, 680–688. https://doi.org/10.1016/j.rser.2015.07.176
- Luan, S., Hussain, M., Ali, S., & Rahim, S. (2022). China’s investment in energy industry to neutralize carbon emissions: Evidence from provincial data. Environmental Science and Pollution Research International, 29(26), 39375–39383. https://doi.org/10.1007/s11356-021-18141-7
- Ma, S., Dai, J., & Wen, H. (2019). The influence of trade openness on the level of human capital in China: On the basis of environmental regulation. Journal of Cleaner Production, 225, 340–349. https://doi.org/10.1016/j.jclepro.2019.03.238
- Machado, J. A., & Silva, J. S. (2019). Quantiles via moments. Journal of Econometrics, 213(1), 145–173. https://doi.org/10.1016/j.jeconom.2019.04.009
- Marjanovic, V., Milovancevic, M., & Mladenovic, I. (2016). Prediction of GDP growth rate based on carbon dioxide (CO2) emissions. Journal of CO2 Utilization, 16, 212–217. https://doi.org/10.1016/j.jcou.2016.07.009
- Mirza, N., Hasnaoui, J. A., Naqvi, B., & Rizvi, S. K. A. (2020). The impact of human capital efficiency on Latin American mutual funds during Covid-19 outbreak. Schweizerische Zeitschrift Für Volkswirtschaft Und Statistik, 156(1), 16. https://doi.org/10.1186/s41937-020-00066-6
- Naqvi, B., Mirza, N., Rizvi, S. K. A., Porada-Rochoń, M., & Itani, R. (2021). Is there a green fund premium? Evidence from twenty seven emerging markets. Global Finance Journal, 50(100656), 100656. https://doi.org/10.1016/j.gfj.2021.100656
- Njoh, A. J. (2021). Renewable energy as a determinant of inter-country differentials in CO2 emissions in Africa. Renewable Energy. 172, 1225–1232. https://doi.org/10.1016/j.renene.2021.03.096
- Onifade, S. T., Gyamfi, B. A., Haouas, I., & Bekun, F. V. (2021). Re-examining the roles of economic globalization and natural resources consequences on environmental degradation in E7 economies: Are human capital and urbanization essential components? Resources Policy, 74, 102435. https://doi.org/10.1016/j.resourpol.2021.102435
- Pata, U. K., & Caglar, A. E. (2021). Investigating the EKC hypothesis with renewable energy consumption, human capital, globalization and trade openness for China: Evidence from augmented ARDL approach with a structural break. Energy, 216, 119220. https://doi.org/10.1016/j.energy.2020.119220
- Pesaran, H. (2004). General diagnostic tests for cross-sectional dependence in panels. University of Cambridge, Cambridge Working Papers in Economics, 435.
- Pesaran, M. H. (2006). Estimation and inference in large heterogeneous panels with a multifactor error structure. Econometrica, 74(4), 967–1012. https://doi.org/10.1111/j.1468-0262.2006.00692.x
- Pesaran, M. H. (2007). A simple panel unit root test in the presence of cross‐section dependence. Journal of Applied Econometrics, 22(2), 265–312. https://doi.org/10.1002/jae.951
- Pesaran, M. H., & Yamagata, T. (2008). Testing slope homogeneity in large panels. Journal of Econometrics, 142(1), 50–93.
- Qin, L., Hou, Y., Miao, X., Zhang, X., Rahim, S., & Kirikkaleli, D. (2021b). Revisiting financial development and renewable energy electricity role in attaining China’s carbon neutrality target. Journal of Environmental Management, 297(113335), 113335. https://doi.org/10.1016/j.jenvman.2021.113335
- Qin, L., Raheem, S., Murshed, M., Miao, X., Khan, Z., & Kirikkaleli, D. (2021a). Does financial inclusion limit carbon dioxide emissions? Analyzing the role of globalization and renewable electricity output. Sustainable Development, 29(6), 1138–1154. https://doi.org/10.1002/sd.2208
- Rahman, M. M., Nepal, R., & Alam, K. (2021). Impacts of human capital, exports, economic growth and energy consumption on CO2 emissions of a cross-sectionally dependent panel: Evidence from the newly industrialized countries (NICs). Environmental Science & Policy, 121, 24–36. https://doi.org/10.1016/j.envsci.2021.03.017
- Ridzuan, N. A., Marwan, N. F., Khalid, N., Ali, M. H., & Tseng, M.-L. (2020). Effects of agriculture, renewable Energy, and economic growth on carbon dioxide emissions: Evidence of the environmental Kuznets curve. Resources, Conservation & Recycling, 160, 104879. https://doi.org/10.1016/j.resconrec.2020.104879
- Rizvi, S. K. A., Yarovaya, L., Mirza, N., & Naqvi, B. (2020). The impact of COVID-19 on valuations of non-financial European firms. SSRN Electronic Journal, https://doi.org/10.2139/ssrn.3705462
- Safi, A., Chen, Y., & Zheng, L. (2022a). The impact of energy productivity and Eco-innovation on sustainable environment in Emerging Seven (E-7) countries: Does institutional quality matter? Frontiers in Public Health, 10, 878243. https://doi.org/10.3389/fpubh.2022.878243
- Safi, A., Chen, Y., Wahab, S., Ali, S., Yi, X., & Imran, M. (2021a). Financial instability and consumption-based carbon emission in E-7 countries: The role of trade and economic growth. Sustainable Production and Consumption, 27, 383–391. https://doi.org/10.1016/j.spc.2020.10.034
- Safi, A., Chen, Y., Wahab, S., Zheng, L., & Rjoub, H. (2021b). Does environmental taxes achieve the carbon neutrality target of G7 economies? Evaluating the importance of environmental R&D. Journal of Environmental Management, 293(112908), 112908. https://doi.org/10.1016/j.jenvman.2021.112908
- Safi, A., Wahab, S., Zeb, F., Amin, M., & Chen, Y. (2021c). Does financial stability and renewable energy promote sustainable environment in G-7 Countries? The role of income and international trade. Environmental Science and Pollution Research International, 28(34), 47628–47640. https://doi.org/10.1007/s11356-021-13991-7
- Safi, A., Wang, Q.-S., & Wahab, S. (2022b). Revisiting the nexus between fiscal decentralization and environment: Evidence from fiscally decentralized economies. Environmental Science and Pollution Research International, 29(38), 58053–58064. https://doi.org/10.1007/s11356-022-19860-1
- Sarkodie, S. A., Adams, S., Owusu, P. A., Leirvik, T., & Ozturk, I. (2020). Mitigating degradation and emissions in China: The role of environmental sustainability, human capital and renewable Energy. The Science of the Total Environment, 719, 137530. https://doi.org/10.1016/j.scitotenv.2020.137530
- Shahzad, U., Radulescu, M., Rahim, S., Isik, C., Yousaf, Z., & Ionescu, S. (2021). Do environment-related policy instruments and technologies facilitate renewable energy generation? Exploring the contextual evidence from developed economies. Energies, 14(3), 690. https://doi.org/10.3390/en14030690
- Shan, S., Genç, S. Y., Kamran, H. W., & Dinca, G. (2021). Role of green technology innovation and renewable energy in carbon neutrality: A sustainable investigation from Turkey. Journal of Environmental Management, 294, 113004. https://doi.org/10.1016/j.jenvman.2021.113004
- Shao, X., Zhong, Y., Liu, W., & Li, R. Y. M. (2021). Modeling the effect of green technology innovation and renewable energy on carbon neutrality in N-11 countries? Evidence from advance panel estimations. Journal of Environmental Management, 296, 113189. https://doi.org/10.1016/j.jenvman.2021.113189
- Shi, B., Xiang, W., Bai, X., Wang, Y., Geng, G., & Zheng, J. (2022). District level decoupling analysis of energy-related carbon dioxide emissions from economic growth in Beijing, China. Energy Reports, 8, 2045–2051. https://doi.org/10.1016/j.egyr.2022.01.124
- Simionescu, M., Strielkowski, W., & Gavurova, B. (2022). Could quality of governance influence pollution? Evidence from the revised Environmental Kuznets Curve in Central and Eastern European Countries. Energy Reports, 8, 809–819. https://doi.org/10.1016/j.egyr.2021.12.031
- Tang, C. F., & Tan, B. W. (2015). The impact of energy consumption, income and foreign direct investment on carbon dioxide emissions in Vietnam. Energy, 79, 447–454. https://doi.org/10.1016/j.energy.2014.11.033
- Tatoğlu, F. Y., & Polat, B. (2021). Occurrence of turnig points on environmental Kuznets curve: Sharp breaks or smooth shifts? Journal of Cleaner Production, 317, 128333. https://doi.org/10.1016/j.jclepro.2021.128333
- Umar, M., Ji, X., Mirza, N., & Naqvi, B. (2021). Carbon neutrality, bank lending, and credit risk: Evidence from the Eurozone. Journal of Environmental Management, 296(113156), 113156. https://doi.org/10.1016/j.jenvman.2021.113156
- Wang, W., Wang, D., Ni, W., & Zhang, C. (2020). The impact of carbon emissions trading on the directed technical change in China. Journal of Cleaner Production, 272, 122891. https://doi.org/10.1016/j.jclepro.2020.122891
- Wang, Z., Ben Jebli, M., Madaleno, M., Doğan, B., & Shahzad, U. (2021). Does export product quality and renewable energy induce carbon dioxide emissions: Evidence from leading complex and renewable energy economies. Renewable Energy. 171, 360–370. https://doi.org/10.1016/j.renene.2021.02.066
- Wei, J., Rahim, S., & Wang, S. (2022). Role of environmental degradation, institutional quality, and government health expenditures for human health: Evidence from emerging seven countries. Frontiers in Public Health, 10, 870767. https://doi.org/10.3389/fpubh.2022.870767
- Westerlund, J. (2007). Testing for error correction in panel data. Oxford Bulletin of Economics and Statistics, 69(6), 709–748. https://doi.org/10.1111/j.1468-0084.2007.00477.x
- Wu, D., Geng, Y., & Pan, H. (2021). Whether natural gas consumption bring double dividends of economic growth and carbon dioxide emissions reduction in China? Renewable and Sustainable Energy Reviews, 137, 110635. https://doi.org/10.1016/j.rser.2020.110635
- Xuan, D., Ma, X., & Shang, Y. (2020). Can China’s policy of carbon emission trading promote carbon emission reduction? Journal of Cleaner Production, 270, 122383. https://doi.org/10.1016/j.jclepro.2020.122383
- Yang, T., Dong, Q., Du, Q., Du, M., Dong, R., & Chen, M. (2021). Carbon dioxide emissions and Chinese OFDI: From the perspective of carbon neutrality targets and environmental management of home country. Journal of Environmental Management, 295, 113120. https://doi.org/10.1016/j.jenvman.2021.113120
- Yao, Y., Ivanovski, K., Inekwe, J., & Smyth, R. (2020). Human capital and CO2 emissions in the long run. Energy Economics, 91, 104907. https://doi.org/10.1016/j.eneco.2020.104907
- Yarovaya, L., Mirza, N., Abaidi, J., & Hasnaoui, A. (2021). Human capital efficiency and equity funds’ performance during the COVID-19 pandemic. International Review of Economics & Finance, 71, 584–591. https://doi.org/10.1016/j.iref.2020.09.017
- Yunfeng, Y., & Laike, Y. (2010). China’s foreign trade and climate change. A case study of CO2 emissions. Energy Policy, 38(1), 350–356. https://doi.org/10.1016/j.enpol.2009.09.025
- Zhang, K., Dong, J., Huang, L., & Xie, H. (2019). China’s carbon dioxide emissions: An interprovincial comparative analysis of foreign capital and domestic capital. Journal of Cleaner Production, 237, 117753. https://doi.org/10.1016/j.jclepro.2019.117753
- Zhang, L., Godil, D. I., Bibi, M., Khan, M. K., Sarwat, S., & Anser, M. (2021). Caring for the environment: How human capital, natural resources, and economic growth interact with environmental degradation in Pakistan? A dynamic ARDL approach. The Science of the Total Environment, 774, 145553. https://doi.org/10.1016/j.scitotenv.2021.145553
- Zhang, L., Xiong, L., Cheng, B., & Yu, C. (2018). How does foreign trade influence China’s carbon productivity? Based on panel spatial lag model analysis. Structural Change and Economic Dynamics, 47, 171–179. https://doi.org/10.1016/j.strueco.2018.08.008
- Zhang, Y., Li, S., Luo, T., & Gao, J. (2020). The effect of emission trading policy on carbon emission reduction: Evidence from an integrated study of pilot regions in China. Journal of Cleaner Production, 265, 121843. https://doi.org/10.1016/j.jclepro.2020.121843