
 ?Mathematical formulae have been encoded as MathML and are displayed in this HTML version using MathJax in order to improve their display. Uncheck the box to turn MathJax off. This feature requires Javascript. Click on a formula to zoom.
Abstract
The increased concern for green economic growth made many countries shift from simply pursuing economic growth to a green economic growth mode to protect resources and the environment. Against this background, we calculated China’s green GDP and studied the impact of economic growth on environmental quality. For green economic growth, we employed income per capita, its square, information and communication technology, sports industry ecosystem efficiency, and human capital. We applied innovative econometric techniques such as cross-sectional dimensions (CSDs) tests, cross-sectional augmented Dickey-Fuller (CADF), cross-sectional augmented Pesaran and Shin (CIPS) tests, Westerlund co-integration test, generalised method of moments (GMM), and fully modified least squares (FMOLS) estimators. The obtained outcomes showed the inverted U-shaped EKC hypothesis, which validates the green economic growth theme. However, ICT was negatively associated with carbon emissions. Similarly, sports industry eco-system efficiency (SIE) showed an insignificant negative impact on the explained variable. Human capital was inversely associated with carbon emissions. In addition, the moderate role of the SIE significantly reduces carbon emissions. In addition, the D-H panel causality test results showed a significant causal association among the selected variables. Owing to the outcomes, we proposed imperative policy implications for the desired level of green economic growth.
1. Introduction
Green growth was first advocated during the 5th Asia-Pacific Conference on Environment and Development of the United Nations, where it was described as an environmentally sustainable method of economic growth (Fujii & Managi, Citation2019; Wang et al., Citation2021). Sustained growth and balanced development can be traced from the green economic growth theory (Li et al., Citation2018). Sustainable development is defined as ‘development that satisfies present needs without jeopardising the ability of future generations to satisfy their most fundamental survival needs’. This kind of development encourages the concurrent, integrated, and sustainable growth of economies, societies, and eco-systems and is based on the idea of ‘ecological carrying capacity’ (Fan et al., Citation2021; Zheng et al., Citation2021). The concept of ‘green economic growth’, which itself is based on research into the relationship underlying social and economic advancement and the health of the earth, is also known as ‘sustainable development’, ‘green growth’, and ‘low carbon economy’ (Chen et al., Citation2022; Hu et al., Citation2022; Taghizadeh-Hesary et al., Citation2022). In China, local administrations prioritise economic growth because it directly affects the officials who get promoted) while they also give less importance to environmental protection (Su, Li, et al., Citation2022; Su, Mirza, et al., Citation2022; Su, Umar, et al., Citation2022). The income disparity, environmental degradation, and other problems brought on by China’s quick economic growth have serious concerns (Geng et al., Citation2017; Khan, Hussain, Shahbaz, et al., 2020; Khan et al., Citation2021).
Additionally, China’s carbon dioxide emissions have come under intense pressure from the international community in recent years owing to the country’s coal-based energy consumption system, which produces a large number of greenhouse gases. Therefore, China is heavily criticised for increasing its energy efficiency and reducing its carbon footprint (Li, Ozturk, et al., Citation2022; Umar et al., Citation2022; Yang et al., Citation2022). China’s previous policy of rapid economic expansion was inadequate for promoting long-term prosperity, as the government places greater importance on environmental stewardship. Spatial variability is significantly influenced by nearby regional greenhouse emissions. Decentralization will shorten greenhouse gas emissions in the near future. However, decentralization is essential to achieve the goal of net-zero carbon emissions. This gradually reduces pollution (Safi et al., 2022).
The Chinese government now sees establishing a green economy as an absolute need in light of the simultaneous threats posed by global and domestic environmental shifts. According to the first theory, environmental regulations may be the reason for this. Environmental laws and green economic expansion are not inversely correlated (Dorfleitner & Grebler, Citation2022; Kaiser & Welters, Citation2019; Yumei et al., Citation2022). Geographically, the green economy is also affected by environmental legislation (Hmaittane et al., Citation2019; Qu et al., Citation2020). The second theory focuses on the impact of macro-level government policies. Sport is a classic indication of the growing importance of people in life and health issues. Over time, the sports industry has evolved into a viable economic model. The rapid growth of the sports industry can be attributed to the growing interest in sports and the videos, merchandise, and celebrities that the sports industry produces (Ali et al., 2021). Sports development is a sign of a country’s social and economic health. The development of the sports industry is another essential component of overall national economic growth. Physical activity, purchasing and following sports brands, and attending sporting events all increase sports involvement (Yu et al., Citation2020). Major international sporting events draw an increasing number of nations, which not only reflects but also fuels the rise in each country’s overall economic potential (Zhao et al., Citation2020). Therefore, the capacity of a country or an individual to promote a successful sports industry is essential.
Due to the National Basketball Association, World Cup, and other international sports events, more academics and sports industry developers have devoted time and energy to researching the economic development of the sports industry (Wu et al., Citation2016). It is no longer restricted to a single country or a particular sports industry area. Effective management of the interdependencies among the numerous components involved in economic management would contribute to the long-term growth of the sports industry. It is difficult to rely on personnel from sports sector companies to process these data because of the complicated relationships between them (Yang & Ni, Citation2022). Profit and loss statements tell only part of the story regarding the growth of business in the sports industry; other considerations, such as advertising and marketing budgets and product effect income, are crucial to these enterprises. Similarly, as people’s standard of living increases, their interest in sports expands beyond merely engaging in physical activity to include following their favourite teams, players, coaches, etc., which in turn fuels the growth of stadium facilities and revenues and the sales of related sports products (Prideaux et al., Citation2020). This also concerns the stock growth rate of major corporations in the sports business.
In the twenty-first century, the sports sector was heralded as a ‘sunrise industry’ and a ‘green industry’. It has expanded the potential of sports and its impact on the national economy and society through its unique allure, robust network, and radiative properties. The output value of China’s sports business has increased significantly because of investment in the sector. In 2018, the sports industry broke through twice: its contribution to GDP topped 1 percent, the value-added of China’s sports industry expanded by 11.6 percent in 2019, and the country’s GDP grew by only 6.0 percent. In other words, the national economy has reached a new high point. Each region of the country is pouring money into the sports business, driven by both the government and the free market (Yoshino et al., Citation2019). Therefore, it has progressed further along the paths of socialisation and industrialisation and has become a more significant contributor to overall economic growth. Investment in the sports business has entered a phase of rapid expansion as new formats for sports integration continue to emerge and the industry welcomes substantial potential opportunities. This study attempts to examine carbon emissions, GDP growth, ICT, sports industry eco-system efficiency, and human capital. Environmental indicators, such as the environmental performance index or environmental sustainability index, may respond differently to research variables. The novelty of this study lies in employing ecological footprint as a measure of environmental degradation. To verify the accuracy of the conclusions reached in this study and show how environmental degradation responds to alternative determinants, new studies should be conducted by tracking various data over an extended period of time using newly developed or nonlinear estimation techniques, introducing new control variables, and taking more thorough measurements of environmental degradation. We use annual data from a wide range of categories, including carbon emissions (CO2), GDP (gross domestic product), ICT (information and communication technology), SIE (sports industry eco-system efficiency), and HC (human capital). The China Industrial Statistical Yearbook is the data source for all the variables from 2008 to 2020 for each country’s 30 regions. This study, however, uses a novel set of econometric techniques, including cross-sectional dependence, second-generation unit root tests, a co-integration test, fully modified ordinary least squares and dynamic ordinary least squares, and a D-H panel causality test to achieve its goals. In addition, we obtain solid outcomes using FMOSL and DOLS (Handajani et al., Citation2019).
2. Literature review
The aforementioned studies have provided evidence for the economic growth and sports role of its expansion. Strengthening the local economy positively correlates with both short- and long-term investments in cleaning environmental contamination. Meanwhile, regional green development is negatively affected by metropolitan salaries and foreign investment in initiatives to address contaminants. By adopting the Chinese model of green growth in the economy, policymakers in industrially contaminating nations can reduce industrial pollution and advance a green economy in those nations (Imran et al., 2022). A number of things have a large positive knock-on effect, such as clean energy, although bilateral trade and economic growth have a negative impact on the cost of carbon emissions (Wahab et al., 2022). During Covid-19 and looming risks, fund managers have been shifting away from high-risk choices and toward low-risk ones in terms of both size and investment portfolio (Rizvi, Mirza, et al., 2020). Conventional energy funds have improved performance compared to renewable energy funds. Furthermore, while the outcomes for traditional fund managers show that they can time the economy and fluctuation, they are inconclusive for renewable energy. These findings serve as deterrents for potential green investors. Last but not least, during COVID-19, the performance of renewable funds declined, illustrating the additional spending burden (Naqvi et al., Citation2021). Exchange-traded funds (ETFs) with a social conscience often have performances equivalent to traditional ETFs. This is crucial for environmentally conscious investors since it shows that the additional screening that socially conscious ETFs are subject to does not materially affect performance (Lobato et al., 2021). Wahab et al. (Citation2021) provided evidence for the co-integration relationships between spending, carbon pollution, imports, exports, power, GDP, technology advancements, and structural fractures. Funds with adequate human capital outperform those of their rivals, who score worse on human asset utilisation. Capital can boost human capital’s productivity and resilience in the face of macroeconomic shocks (Ahmed, Citation2020; Bansal & Kumar, Citation2021; Gao, O’Sullivan, et al., Citation2021). According to Rizvi, Yarovaya, et al. (2020), the pandemic was the main reason for the decline in profits for shareholders, and valuations across all industries were significantly affected adversely and likely dropped in sales, while there was a rise in the price of equity.
Green GDP is a measure of the green economy used in numerous studies to consider the trade-off between eco-systems and economic systems (Zheng et al., Citation2021). Additionally, more scholars are examining industrial efficiency in terms of green economic growth (Wang, Wang, et al., Citation2022). AGDCC-GARCH model was used by Karim et al. (Citation2022) to assess the hedging and safe-haven features of three bond markets (BBGT, SPGB, and SKUK). Except for SKUK, which is a safe place investment for crypto indexes and provides significant diversity during times of economic fragility, they discovered that financial markets were neither hedges nor safe-havens. Additionally, during times of crisis, SPGB surpasses other bonds in terms of hedge performance, offering significant potential for diversity in cryptocurrency indices. As an increasing number of online statistics have been updated, academics have been able to learn more about the correlation between Internet growth and environmentally responsible economic expansion as more and more online statistics have been updated (Li et al., Citation2020). Ferrat et al. (2022) examined the influence of responsible investment growth on future stock returns by using panel models for robust to nation, industry effects and firm-year. Evidence suggests that the effect of responsible investment growth depends on the time frame in question. The short-term stock returns for corporations that are leading or underperforming in sustainability are comparable. However, over a very long duration, the return divergence is negative and becoming wider. Businesses devoted to managing sports economies have prospered globally, significantly contributing to the growth of economies worldwide. (Mikhno et al., Citation2021) were able to measure the factor contribution rate and industrial efficiency of the growth of the regional sports industry by using a variety of tools, such as the Solow growth function and the super-efficiency SBM model, and then investigated the influence of related factors through regression analysis. Grey correlation research was utilised by (Ning et al., Citation2021) to examine the connection between China’s sports industry and its level of economic growth. He found that the sports industry strongly correlates with GDP, per capita disposable income, and employment levels. Multiple linear regression models show that China’s sports sector competitiveness has a strong linear link with economic development after (Huynh et al., Citation2020) built an index system of elements that influence the sports industry.
Numerous researchers have compiled a sizable corpus of research. Shaikh (Citation2018) proposed a nonlinear entropy coupling evaluation model of the sports economy based on the degree of coordination between regional growth, the social environment, and the sports economy. The applicability and reliability of GMM in sports economic evaluations were investigated using MATLAB. Their conclusions can act as a benchmark for the further expansion of the sports business sector. Falcone (Citation2018) combined Internet technology with sports economic management to examine how business affects the growth of the sports economy. They investigated how the development of China’s sports business affects the GDP of the nation using big data technology and the OpenStack Cloud platform. According to research, China’s economic development has been boosted by between 11 and 7 percentage points, owing to the growth of the sports industry. New insights into the sports economy were uncovered by (Jiang et al., Citation2020) regarding the usage of cloud platforms and big data technologies to evaluate the industry’s growth pattern through regression processing on sports economic data using the Hadoop cloud platform processing data system and the support-vector machine technique. There is enormous potential for the country’s overall economic strength to improve owing to the brisk growth of the sports industry. His research into the sports industry’s model for forecasting utilised data mining techniques made possible by advances in big data technology (Gu et al., Citation2021). However, Chinese-listed firms in the sports sector are poor, and the sports economy industry is a relatively recent phenomenon. He examined the trajectory of the Chinese sports economy’s growth and the crucial contribution that the sports sector makes to China’s overall economic growth from the perspective of the economic strategy of publicly traded companies. According to the study’s conclusions, listed companies’ participation in the sports economy will help accelerate China’s overall economic growth (Yang, Citation2021). It has been suggested by (Gao, Wang, et al., Citation2021) that the efficiency of the sports industry is influenced by factors such as the degree of development in the service sector, level of urbanisation, level of financial development, and climate environment. From the standpoint of the effectiveness of the industrial ecosystem, Qiu et al. (Citation2021) proposed that natural ecology, social ecology, and economic ecology, including natural resource endowments, location conditions, infrastructure construction, residents’ awareness of fitness, income level, policies and regulations, and other factors, have an impact on the Shandong Peninsula sports industry ecosystem. According to Zhang et al. (Citation2020), the government, industrial environment, and consumer behavior have the greatest effects on the competitiveness of Shandong’s sports industry.
3. Data and methodology
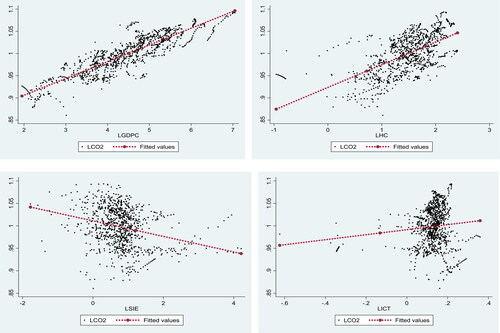
When the data value is low, performing ordinary least squares regression on the reduced data results in skewed parameter estimation. These findings are important for the remainder of this investigation. This research study’s data also included a panel spanning 13 years, from 2008 to 2020, and 30 Chinese provinces. This dataset was chosen because the Chinese industrial sectors experienced the effects of the 2008 global recession, and it is now necessary to assess the situation that followed it. These provinces also serve as the industrial centers of China and are important to its continued industrial progress. The data were compiled from several sources, including the ‘China Industrial Statistics Yearbook’, the ‘China Energy Statistical Yearbook’, the ‘China Science and Technology Statistical Yearbook’, and other provincial and national statistical yearbooks published by the Chinese government. provides scatter plots for the chosen variable, and Kakoulaki et al. (Citation2021) first used IP in the AT formulation. (Li & Lv, Citation2021) reformulated IPAT into a stochastic model named STIRPAT, which can statistically model the non-proportionate impacts of variables on the environment in the following form:
(1)
(1)
(2)
(2)
where per capita income (
), square of per capita income (
), information and communication technology (
), sports industry ecosystem efficiency (
), and human capital (
) were taken as the deciding factors of carbon emissions (
), t denotes the year, and ε denotes the error term.
(3)
(3)
Figure 1. Scatter plots of selected variables.
Source: The authors.
In EquationEquation (3)(3)
(3) , other factors remain constant.
shows the impact on carbon emissions in this study.
(4)
(4)
EquationEquation (4)(4)
(4) shows the impact of
on carbon emissions and other factors or variables that remain constant.
In Equation (5), other factors that remain constant SIE * HC show an impact on carbon emission in this study. After taking logarithms, the model takes the following form:
3.1. Estimation techniques
This research provides a logical plan for conducting empirical studies on unit root tests using the Pesaran CADF and Pesaran CIPS panel unit root tests; co-integration was analysed using the Pedroni-cointegration and Kao-cointegration tests, model selection was evaluated using the FMOLS and DOLS tests, and causality was dissected using the Dumitrescu and Hurlin panel causality test. In panel data models, disturbances are often assumed to be cross-sectionally independent. This seems to be particularly true for panels with large cross-sectional dimensions. Each test’s null hypothesis assumed the absence of a CSD. We then performed the CIPS unit root test suggested by Pesaran (Citation2007), who considered the CSD problem to determine if the data set has a unit root or otherwise. The Westerlund co-integration test was applied to determine whether the research variables had a long-term relationship. This approach examined the null hypothesis that there is no co-integration between the variables when considering the CSD problem (Danish & Ulucak, Citation2020).
Moreover, the cross-sectional augmented Dickey-Fuller (CADF) test and the cross-sectional augmented Pesaran and Shin (CIPS) test, both envisioned by Pesaran (Citation2007), have been examples of second-generation unit root tests. CSD problems are explained by second-generation stationarity tests, specifically CADF and CIPS (Ansari et al., Citation2022). The Generalised Method of Moments (GMM), which we examined in the long-run scenario, is the best method for calculating the significant impact of variables on the dependent variable in the long run with a large N and smaller T. The two-step GMM method was used in this study because it is more precise than the one-step GMM approach and robust to heteroscedasticity and autocorrelation (Roodman, Citation2009).
3.2. Panel unit root tests
First-generation unit root tests, including those by Im, Pesaran, and Shin (IPS), Augmented Dickey-Fuller (ADF), and Phillips-Perron (PP), appear to be (cross-sectionally augmented) Im, Pesaran, and Shin (IPS) and Augmented Dickey-Fuller (CADF). These examinations were created by (Pesaran et al., Citation2008). The CADF equation is expressed as follows:
(7)
(7)
where
and Δ
show the first differences of each unit and the mean of the lagged cross-sectional values. After calculating the CADF, we estimated the CIPS statistics as follows:
(8)
(8)
where
(N, T) shows t-statistics in the CADF test defined in Equation (5).
3.3. Panel co-integration tests
We used co-integration tests to build connection between the cross sections. Co-integration tests can be used to assess whether two variables are permanently linked. The possibility of long-term partnership with a fractional component is limitless when cross-sectional dependence exists. We employed co-integration tests based on Durbin-Hausman developed by (Ünüvar, Citation2019). The panel-specific-AR and same-AR test statistics are two autoregressive (AR) parameters unique to the panel under consideration in the Westerlund co-integration test’s estimations of CSDs. Co-integration can be inferred from the statistical rejection of the null hypothesis employed in panel-specific AR tests. Concurrently, if panel-specific AR test statistics fail to reject the null hypothesis, the entire panel cannot be cointegrated.
We can express panel-specific-AR test statistics as follows:
(9)
(9)
3.4. Fmols and DOLS test
The long-run relationship between the variables was investigated using the FMOLS and DOLS developed by Onishi (Citation2010), Ahmad and Wu (Citation2022), and Srivastava et al. (Citation2022), with strong support for long-run co-integration. These econometric methods are useful when endogeneity and autocorrelation between variables and error factors afflict panel data. We used Panel FMOLS and DOLS tests in this study. The Fully Modified Least Squares (FMOLS) method was used to examine the robustness of this model. The three biggest issues when coping with panel data are heteroscedasticity, endogeneity, and autocorrelation across panels. Both models have the advantage of considering heteroscedasticity, endogeneity, and correlation issues with the data (Umar et al., Citation2020a, Citation2020b).
3.5. Panel causality test
While long-run estimators probe the effects of explanatory variables on their targets, they cannot identify the causal relationships between these variables in the short term, making it impossible to use these estimates to guide policymaking. Therefore, we utilised Dumitrescu and Hurlin tests to verify the panel’s causalities, as suggested by (Huang et al., Citation2022). Compared to other tests, the causal findings produced by Dumitrescu and Hurlin (D-H) are the most reliable and consistent.
4. Result and discussion
The normal distribution of the study’s preferred metrics was verified, and descriptive statistics are provided for each variable in , along with their respective variables. It is necessary to initially obtain descriptive statistics () of the relevant variables before continuing with further extensive research. Several variables have been examined, including carbon dioxide emissions, gross domestic product, GDP per capita, GDP per capita annually, information and communication technology, the effectiveness of the sports industry ecosystem, and human capital. At the 5% significance level, the results showed that the hypothesis of no significant difference between the means and medians of all variables could not be rejected.
Table 1. Descriptive statistics.
presents a list of the findings of the correlation matrix. Higher per capita income is associated with decreased CO2 emissions at the 1percent level of significance. The table shows a negative correlation between ICT and carbon emissions at the 1% significance level, as well as a negative correlation between the effectiveness of the sports industry’s ecosystem and carbon emissions. In addition, at the 1% significance level, human capital was positively associated with carbon emissions. Pesaran (CADF) and Pesaran (CIPS) were used to test whether the variables were stationary. displays the results of both stationarity tests. At the intercept and trend levels, we found that the null hypothesis was incorrect. We discovered stationarity at the 1 percent level for both the intercept and intercept and trend. The findings from a panel unit root test indicate that the variables are first-difference-integrated.
Table 2. Correlation matrix.
Table 3. CADF and CIPS.
The next step is investigating the long-run co-integration connection between the explained and explainable variables. As a result, we employed the Pedroni co-integration test defined by Li, Li, et al. (Citation2022). In both parametric and nonparametric contexts, seven alternative test statistics were provided. presents these findings. The four tests conducted in this study statistically confirmed the long-term co-integration of the selected panel. Consequently, several green economic indices exhibit long-term co-integration. We also used Kao’s panel co-integration approach (Wang, Shahid, et al., Citation2022) to confirm Pedroni’s findings, demonstrating co-integration ().
Table 4. Pedroni and Kao co-integration test.
4.5. Long-run results of FMOLS and DOLS estimators
To estimate the long-run co-integration vector between green growth and its determinants, we similarly turned to the FMOLS and DOLS techniques panels. We used a pooled weighted estimate method to test a panel data model while keeping fixed effects and constants in mind. Panel FMOLS estimators for the chosen variables are shown in . The table displays the most credible results when the FMOLS and DOLS estimators were used. The results indicate an inverted U-shaped relationship between economic growth and carbon emissions. The link between GDP growth and CO2 emissions provides a rational economic explanation. The long-term correlations between variables can also be discovered using this table. As these FMOLS outcomes show, there is a positive relationship between economic growth and CO2 emissions, the value of long-run LGDPC is positive and substantial at the 1% level, and so on. The LGDPC is also 5 percent significant in the positive direction, demonstrating a positive correlation with LCO2 in the DOLS panel. The EKC theory of an inverted U-shape was confirmed by both P-FMOLS-DOLS. The world’s most advanced economies have entered the global village phase, which is why. In the early years of their development, these economies consistently strove to accelerate their economic expansion without giving sufficient thought to their surroundings. In the long run, environmental degradation results from ignorance during the early stages of progressive economic growth. For the FMOLS test, the squared value of economic growth LGDPC was negative and statistically significant at the 5 percent significance level. The negative squared term growth and CO2 emissions are reflected in the inverse value of the LGDPC-square in the long run. Simultaneously, the long-run value of LGDPC is negative and statistically significant (at the 1 percent level) according to the DOLS test. The long-term growth squared (LFDPC-square) has a negative slope concerning LCO2, indicating that exponential development reduces CO2 emissions by approximately. The EKC theory has been disproved in two regions of China by P-FMOLS-DOLS analyses, showing an inverted U-shape between the LGDPC-square and LCO2. Economies, by definition, are expected to fulfill the criteria of sustainable growth and development to advance their economic standing. However, in the chosen provinces, growth coincided with environmental sustainability because of adherence to sustainable growth and development criteria. Some prior studies corroborate the results of this study, showing that achieving the targeted level of economic growth reduces carbon dioxide emissions and makes the inverted U-shaped EKC more visible in these economies (Atasoy, Citation2020; Lv et al., Citation2021; Mensah et al., Citation2019; Rao & Holt, Citation2005; Rios & Gianmoena, Citation2018).
Table 5. FMOLS long run test.
Statistical analysis revealed a negative correlation between ICT and carbon emissions, suggesting that reducing this element would reduce overall emissions. There is an economic rationale for this unintended outcome. A further intriguing discovery has to do with the significance of the complementarity between ICTs in negatively affecting environmental quality. Even though this may come as a surprise, information and communication technologies have been shown to dramatically reduce CO2 emissions. As there is no direct information about the impact of ICTs once coupled with the environment, this unintended consequence occurred. Since the endogeneity problem is not accounted for in this modelling paradigm, the effect may be different when accounting for variability among provinces (Shabir et al., Citation2022). This major finding, however, is consistent with the findings of prior studies, including those by (Hanif et al., Citation2019). These findings demonstrate that advanced ICT helps to reduce carbon dioxide emissions.
Our research is consistent with the ‘ICT for green’ perspective since it lends credence to the claim that technological advancements can help alleviate some of the environmental problems that have plagued the world in recent decades. Thus, ICT for green is a strategy to reduce environmental impact on the other economic sectors. The results of other recent research corroborate ours: (Hsu et al., Citation2021) for ASEAN countries (Hardin-Ramanan et al., Citation2018) for Belt and Road countries, emerging economies, and BRICS (Yumei et al., Citation2022). There is an increase in carbon emissions because ICT advancements will encourage using other renewable energy options. The evidence is also in line with prior studies that found a reversed U-shaped relationship between ICT and CO2 emissions worldwide and in Iran. For instance (Hsu et al., Citation2021) found that advancing ICT reduces the chance of contamination. The efficiency of the sports sector ecosystem is a negative contributor to greenhouse gas production. This model’s SIE carbon emission reduction is −0.3143 percent, compared to −0.2654 percent in Model 1, −0.0085 percent in Model 2, −0.4765 percent in Model 3, and −0.3143 percent in Model 1. The detrimental effect of environmental regulations on the eastern region’s sports industry ecosystem efficiency is not statistically significant. In both the central and western regions, the efficiency of the sports industry’s support is negatively correlated with the growth of the sports industry, with the western region bearing the greatest weight because of the potential negative effects of the sports industry expansion on environmental quality. The growth of the sports business is impeded to some degree by environmental legislation, which is mostly the result of the government’s proposal of stricter standards on carbon emissions. Although stricter environmental rules have less negative impact on the eastern economy because of the region’s advanced technology, they will have an even greater negative impact on the western economy because of its slower growth.
As can be seen from the data, human capital is positively associated with carbon output. Human capital increased by 0.0658 percent, 0.2764 percent, 0.6471 percent, and 0.4576 percent in developing nations for every percentage point in GDP growth. An important discovery that can aid their efforts is that human capital negatively influences carbon emissions. Carbon emissions may decrease in certain provinces if human capital, as measured by secondary school enrolment and average school education, rises. Therefore, investing in people is a long-term solution to the problem of carbon emissions. Energy security and carbon emission reductions would benefit from a larger pool of potential workers who are well-educated and aware of current issues due to an increase in secondary school attendance.
However, while education is a top priority for advanced countries, China’s educational system is dismal. If the government does not invest more money in ensuring that everyone can obtain an education, declining enrolment will speed up the rate at which emissions increase. Unskilled labor results from a lack of education and increased household expenditure, which results in another. The cost of quality education in Pakistan is currently prohibitive owing to a shortage of public educational institutions and resources. China is currently in the early stages of establishing a robust system for technical universities. There are several issues plaguing the country’s educational system, including the lackluster method of assessing teachers’ performance, widespread unemployment and poverty, rapid population expansion, meddling from politicians, and a meagre budget. It seems reasonable to infer from our findings that investing in human capital through education has the potential to slow the rate of increase in global carbon emissions. In response, countries that place a higher priority on education tend to have more skilled personnel, making it simpler to implement cutting-edge green technologies and reduce carbon emissions.
In addition to this obvious result, the impact of the efficiency of the sports industry’s ecosystem on GDP growth, ICT, and human capital, and hence on greenhouse gas emissions, needs to be studied. However, the negative effect on carbon emissions is moderate, owing to the influence of SIE. As a result, SIE provides evidence of a favourable reaction to sustainable development. Results from the panel DOLS estimators for the chosen variables are shown in . The models demonstrate a positive relationship between per capita income and carbon emissions, with positive coefficients of 0.3744 percent, 0.7365 percent, 0.3478 percent, and 0.6354 percent, respectively, whereas the square root of per capita income shows an inverse relationship between income and emissions.
Table 6. DOLS long run test.
Table 7. Results of the D-H panel causality test.
Model 2 indicates a decrease in carbon emissions due to an increase in ICT of −0.9845 percent, Model 3 shows a decrease of −0.7275 percent, and Model 4 shows a decrease in carbon emissions due to an increase in ICT of −0.2265 percent. These results indicate that ICT usage increases carbon emissions. Similarly, a drop in carbon emissions of −0.317 percent, −0.0476 percent, −0.846 percent, and −0.6467 percent is shown as SIE increases. Human capital has a favourable effect on greenhouse gas emissions, as demonstrated by these findings. Carbon emissions reductions of 0.0326 percent, 0.7547 percent, 0.9856 percent, and 0.2648 percent can be attributed to an increase in human capital.
4.6. D-H panel causality results
To conduct a causality test, all variables must rest. This is because the prioritised growth factors were constant at the first-order difference. Additionally, FMOLS and DOLS estimators were used to estimate the parameters of some panel data. This study used a modified version of the Granger non-causality test to evaluate the relationships between certain variables and their potential causes. The D-H test also calculated both W-bar and Z-bar statistics. As a result, W-bar statistics were used to determine the significance of the mean difference, whereas Z-bar statistics represented the normal distribution. Finally, the causal direction will aid policymakers in suggesting relevant, sustainable policies and economic strategies for the chosen countries. The factors affecting carbon emissions are listed in . This finding demonstrates that per capita income and carbon emissions are causally related in two ways. It demonstrates the reasons for the ways in which a change in LGDP may impact carbon dioxide emissions. Or, to put it another way, LGDP policies and carbon emission policies are consistent. This outcome supports the findings of (Gao, O’Sullivan, et al., Citation2021). In addition, a negative link between GDP and carbon dioxide emissions was found. It was found that there is only one route in which causality runs, just as there is between ICT and carbon emissions with associated feedback. This result agrees with that of (Han et al., Citation2022), who discovered a causal relationship between ICT and carbon emissions in only one way (d’Amore-Domenech et al., 2020). Furthermore, SIE directly causes an increase in carbon dioxide output. This correlation shows that SIE and CO2 are major causes of each other. This finding lends credence to the argument that SIE helps cut down on carbon emissions while also opening up new avenues for economic growth and employment (Zhao et al., Citation2022). Finally, there is a reversible correlation between human capital and greenhouse gas production.
5. Policy implication and future guidelines
Based on these findings, this study suggests several significant policy implications. The empirical findings support the inverted U-shaped link between carbon dioxide emissions and ED and recommend that China prioritise sustainable development to satisfy the ED. Stronger incentives and motivations should be included in government policies for industrial products, supported by clean and sustainable growth. Additionally, lower taxes, interest rates, and increased infrastructure spending should assist crucial industries. Although China’s carbon dioxide emissions have clearly increased over the past few decades, new conservative eco-friendly criteria should be considered in addition to ongoing development. We predicted that human capital has a sizable beneficial effect on carbon dioxide emissions, while the impact of information and communications technology is sizable and negative.
Additionally, the findings imply that ICT contributes to a reduction in carbon emissions in the residential, transportation, and industrial sectors. The interim impact of human capital can be uncertain in the interim. These findings also show that enhancing human capital can reduce commercial carbon emissions. However, increased emissions from the housing and transportation sectors are linked to human capital expansion. These results support earlier research suggesting that ICT can help the environment by improving environmental management and assisting in the dematerialization of significant portions of the industrial sector. The calculated findings demonstrate that economic growth follows an inverted U-shaped curve, supporting the EKC hypothesis. Consequently, new studies should be conducted by following different data over a long period, using new or nonlinear estimation techniques, introducing new control variables, and taking more comprehensive measurements of environmental degradation to confirm the validity of the findings obtained in this study and to reveal how environmental degradation reacts to alternative determinants.
6. Conclusion
In this study, we investigated the variables between 2008 and 2020 that determined the viability of the green economy in 30 different Chinese regions. This study checks for foreign dependencies before using a panel unit root test that considers cross-sectional dependency. Owing to the presence of non-stationary variables, cross-sectional dependence must be controlled to evaluate co-integration connections. The study confirms the existence of a co-integration relationship using system GMM and FMOLS estimators to estimate long-run co-integration parameters. In conclusion, the findings support an inverted U-shaped relationship between income and carbon emissions across all 30 Chinese provinces and regions. ICT and SIE both confirm that the sports industry has a negligible yet negative impact on carbon emissions as a whole. Although there is a positive link between human capital and physical capital, there is a negative association between carbon emissions and physical capital. The D-H panel causality test was employed to examine the relationships between the variables.
Thus, according to empirical data from China, the ICT sector has a far smaller negative impact on the environment when embodied carbon repercussions are considered. The ICT industry can produce a large amount of carbon emissions because it requires a large amount of electricity and materials with a high carbon footprint as an intermediate production input. The information and communication technology sector should establish carbon management strategies using embodied rather than direct carbon emission metrics. For instance, it is necessary to encourage business personnel to monitor and mark carbon footprints connected to particular information and communication technology (ICT) products and services. ICT-embodied emissions ranged widely between industries, with the more carbon-intensive ICT manufacturing sector accounting for the majority of overall emissions. Therefore, while formulating ICT industrial development plans, decision makers should give preference to the cleaner ICT service sectors. However, the outcomes of this study do have some qualifications. First, we used data from various sources, some of which may contain measurement errors. Second, the empirical strategy employs FMOLS and DOLS estimators with some restrictions. However, the results may differ depending on the precise application of alternative panel data techniques that are based on nonlinear structures. Other environmental indicators, such as the environmental performance index or the environmental sustainability index, may respond differently to the research variables, even though this study employed the ecological footprint as a measure of environmental degradation. Therefore, when creating plans for the industrial development of ICT, decision makers should prioritise more environmentally friendly ICT service industries.
Disclosure statement
No potential conflict of interest was reported by the authors.
References
- Ahmad, M., & Wu, Y. (2022). Combined role of green productivity growth, economic globalization, and eco-innovation in achieving ecological sustainability for OECD economies. Journal of Environmental Management, 302, 113980.https://doi.org/10.1016/J.JENVMAN.2021.113980
- Ahmed, W. M. (2020). Asymmetric impact of exchange rate changes on stock returns: Evidence of two de facto regimes. Review of Accounting and Finance, 19(2), 147–173.
- Ali, S. S. A., Longsheng, C., Solangi, Y. A., Ahmad, M., & Ali, S. (2021). Energy trilemma based prioritization of waste-to-energy technologies: Implications for post-COVID-19 green economic recovery in Pakistan. Journal of Cleaner Production, 284, 124729.https://doi.org/10.1016/j.jclepro.2020.124729
- Ansari, M. A., Haider, S., Kumar, P., Kumar, S., & Akram, V. (2022). Main determinants for ecological footprint: An econometric perspective from G20 countries. Energy, Ecology and Environment, 7(3), 250–267. https://doi.org/10.1007/s40974-022-00240-x
- Atasoy, A. T. (2020). Behavioral responses of green builders to discontinuous certification schemes. Resource and Energy Economics, 60, 101141. https://doi.org/10.1016/j.reseneeco.2019.101141
- Bansal, M., & Kumar, V. (2021). Forcing responsibility? Examining earnings management induced by mandatory corporate social responsibility: Evidence from India. Review of Accounting and Finance, 20(2), 194–216. https://doi.org/10.1108/RAF-06-2020-0151
- Chen, Z., Mirza, N., Huang, L., & Umar, M. (2022). Green Banking—Can Financial Institutions support green recovery? Economic Analysis and Policy, 75, 389–395. https://doi.org/10.1016/j.eap.2022.05.017
- d’Amore-Domenech, R., Santiago, Ó., & Leo, T. J. (2020). Multicriteria analysis of seawater electrolysis technologies for green hydrogen production at sea. Renewable and Sustainable Energy Reviews, 133, 110166. https://doi.org/10.1016/j.rser.2020.110166
- Danish, R., & Ulucak, R. (2020). How do environmental technologies affect green growth? Evidence from BRICS economies. The Science of the Total Environment, 712, 136504.https://doi.org/10.1016/j.scitotenv.2020.136504
- Dorfleitner, G., & Grebler, J. (2022). Corporate social responsibility and systematic risk: International evidence. The Journal of Risk Finance, 23(1), 85–120. https://doi.org/10.1108/JRF-07-2020-0162
- Falcone, P. M. (2018). Green investment strategies and bank-firm relationship: A firm-level analysis. Economics Bulletin, 38, 2225–2239.
- Fan, F., Lian, H., Liu, X., & Wang, X. (2021). Can environmental regulation promote urban green innovation Efficiency? An empirical study based on Chinese cities. Journal of Cleaner Production, 287, 125060. https://doi.org/10.1016/j.jclepro.2020.125060
- Ferrat, Y., Daty, F., & Burlacu, R. (2022). Short- and long-term effects of responsible investment growth on equity returns. The Journal of Risk Finance, 23(1), 1–13. https://doi.org/10.1108/JRF-07-2021-0107
- Fujii, H., & Managi, S. (2019). Decomposition analysis of sustainable green technology inventions in China. Technological Forecasting and Social Change, 139, 10–16. https://doi.org/10.1016/j.techfore.2018.11.013
- Gao, J., O’Sullivan, N., & Sherman, M. (2021). Chinese securities investment funds: The role of luck in performance. Review of Accounting and Finance, 20(5), 271–297. https://doi.org/10.1108/RAF-07-2020-0182
- Gao, X., Wang, S., Ahmad, F., Chandio, A. A., Ahmad, M., & Xue, D. (2021). The nexus between misallocation of land resources and green technological innovation: A novel investigation of Chinese cities. Clean Technologies and Environmental Policy, 23(7), 2101–2115. https://doi.org/10.1007/s10098-021-02107-x
- Geng, R., Mansouri, S. A., & Aktas, E. (2017). The relationship between green supply chain management and performance: A meta-analysis of empirical evidence in Asian emerging economies. International Journal of Production Economics, 183, 245–258. https://doi.org/10.1016/j.ijpe.2016.10.008
- Gu, K., Dong, F., Sun, H., & Zhou, Y. (2021). How economic policy uncertainty processes impact on inclusive green growth in emerging industrialized countries: A case study of China. Journal of Cleaner Production, 322, 128963. https://doi.org/10.1016/j.jclepro.2021.128963
- Han, S. R., Li, P., Xiang, J. J., Luo, X. H., & Chen, C. Y. (2022). Does the institutional environment influence corporate social responsibility? Consideration of green investment of enterprises—Evidence from China. Environmental Science and Pollution Research International, 29(9), 12722–12739.https://doi.org/10.1007/s11356-020-09559-6
- Handajani, L., Rifai, A., & Husnan, L. H. (2019). Study of the initiation of green banking practices at state-owned bank. Jurnal Economia, 15(1), 1–16. https://doi.org/10.21831/economia.v15i1.21954
- Hanif, I., Aziz, B., & Chaudhry, I. S. (2019). Carbon emissions across the spectrum of renewable and nonrenewable energy use in developing economies of Asia. Renewable Energy, 143, 586–595. https://doi.org/10.1016/j.renene.2019.05.032
- Hardin-Ramanan, S., Chang, V., & Issa, T. (2018). A Green Information Technology governance model for large Mauritian companies. Journal of Cleaner Production, 198, 488–497. https://doi.org/10.1016/j.jclepro.2018.07.047
- Hmaittane, A., Bouslah, K., & M’Zali, B. (2019). Does corporate social responsibility affect the cost of equity in controversial industry sectors? Review of Accounting and Finance, 18(4), 635–662. https://doi.org/10.1108/RAF-09-2018-0184
- Hsu, C. C., Quang-Thanh, N., Chien, F. S., Li, L., & Mohsin, M. (2021). Evaluating green innovation and financial development performance: Mediating environmental regulation concerns. Environmental Science and Pollution Research International, 28(40), 57386–57397.https://doi.org/10.1007/s11356-021-14499-w
- Hu, J., Wang, K.-H., Su, C. W., & Umar, M. (2022). Oil price, green innovation and institutional pressure: A China’s perspective. Resources Policy, 78, 102788. https://doi.org/10.1016/j.resourpol.2022.102788
- Huang, W., Saydaliev, H. B., Iqbal, W., & Irfan, M. (2022). Measuring the impact of economic policies on Co 2 emissions: Ways to achieve green economic recovery in the post-Covid-19 era. Climate Change Economics, 13(03) https://doi.org/10.1142/S2010007822400103
- Huynh, T. L. D., Hille, E., & Nasir, M. A. (2020). Diversification in the age of the 4th Industrial Revolution: The role of artificial intelligence, green bonds and cryptocurrencies. Technological Forecasting and Social Change, 159, 120188. https://doi.org/10.1016/j.techfore.2020.120188
- Imran, M., Hayat, N., Saeed, M. A., Sattar, A., & Wahab, S. (2022, September 8). Spatial green growth in China: Exploring the positive role of investment in the treatment of industrial pollution. Environmental Science and Pollution Research, 1–4. https://doi.org/10.1007/s11356-022-22851-x
- Jiang, Z., Lyu, P., Ye, L., & Zhou, Y. (2020). Green innovation transformation, economic sustainability and energy consumption during China’s new normal stage. Journal of Cleaner Production, 273, 123044. https://doi.org/10.1016/j.jclepro.2020.123044
- Kaiser, L., & Welters, J. (2019). Risk-mitigating effect of ESG on momentum portfolios. The Journal of Risk Finance, 20(5), 542–555. https://doi.org/10.1108/JRF-05-2019-0075
- Kakoulaki, G., Kougias, I., Taylor, N., Dolci, F., Moya, J., & Jäger-Waldau, A. (2021). Green hydrogen in Europe – A regional assessment: Substituting existing production with electrolysis powered by renewables. Energy Conversion and Management, 228, 113649. https://doi.org/10.1016/j.enconman.2020.113649
- Karim, S., Naeem, M. A., Mirza, N., & Paule-Vianez, J. (2022). Quantifying the hedge and safe-haven properties of bond markets for cryptocurrency indices. The Journal of Risk Finance, 23(2), 191–205. https://doi.org/10.1108/JRF-09-2021-0158
- Khan, Z., Ali, S., Dong, K., & Li, R. Y. M. (2021). How does fiscal decentralization affect CO2 emissions? The roles of institutions and human capital. Energy Economics, 94, 105060. https://doi.org/10.1016/j.eneco.2020.105060
- Khan, Z., Hussain, M., Shahbaz, M., Yang, S., & Jiao, Z. (2020). Natural resource abundance, technological innovation, and human capital nexus with financial development: A case study of China. Resources Policy, 65, 101585. https://doi.org/10.1016/j.resourpol.2020.101585
- Li, S. S., & Lv, Z. (2021). Do spatial spillovers matter? Estimating the impact of tourism development on CO2 emissions. Environmental Science and Pollution Research, 28(25), 32777–32794. https://doi.org/10.1007/s11356-021-12988-6
- Li, X., Li, Z., Su, C.-W., Umar, M., & Shao, X. (2022). Exploring the asymmetric impact of economic policy uncertainty on China’s carbon emissions trading market price: Do different types of uncertainty matter? Technological Forecasting and Social Change, 178, 121601. https://doi.org/10.1016/j.techfore.2022.121601
- Li, X., Ozturk, I., Majeed, M. T., Hafeez, M., & Ullah, S. (2022). Considering the asymmetric effect of financial deepening on environmental quality in BRICS economies: Policy options for the green economy. Journal of Cleaner Production, 331, 129909. https://doi.org/10.1016/j.jclepro.2021.129909
- Li, Z., Ju, S., Duan, M., & Cai, S. (2020). Quantitative selection of leading industries of green economy in coastal cities based on industrial relevance. Journal of Coastal Research, 103(sp1), 566–569. https://doi.org/10.2112/SI103-115.1
- Li, Z., Liao, G., Wang, Z., & Huang, Z. (2018). Green loan and subsidy for promoting clean production innovation. Journal of Cleaner Production, 187, 421–431. https://doi.org/10.1016/j.jclepro.2018.03.066
- Lobato, M., Rodríguez, J., & Romero, H. (2021, May 25). A volatility-match approach to measure performance: The case of socially responsible exchange traded funds (ETFs). The Journal of Risk Finance, 22(1), 34–43. https://doi.org/10.1108/JRF-04-2020-0066
- Lv, C., Shao, C., & Lee, C.-C. (2021). Green technology innovation and financial development: Do environmental regulation and innovation output matter? Energy Economics, 98, 105237. https://doi.org/10.1016/j.eneco.2021.105237
- Mensah, C. N., Long, X., Dauda, L., Boamah, K. B., Salman, M., Appiah-Twum, F., & Tachie, A. K. (2019). Technological innovation and green growth in the Organization for Economic Cooperation and Development economies. Journal of Cleaner Production, 240, 118204. https://doi.org/10.1016/j.jclepro.2019.118204
- Mikhno, I., Koval, V., Shvets, G., Garmatiuk, O., & Tamošiūnienė, R. (2021). Green economy in sustainable development and improvement of resource efficiency. Central European Business Review, 10(1), 99–113. https://doi.org/10.18267/j.cebr.252
- Naqvi, B., Mirza, N., Rizvi, S. K. A., Porada-Rochoń, M., & Itani, R. (2021). Is there a green fund premium? Evidence from twenty seven emerging markets. Global Finance Journal, 50, 100656. https://doi.org/10.1016/j.gfj.2021.100656
- Ning, Q. Q., Guo, S. L., & Chang, X. C. (2021). Nexus between green financing, economic risk, political risk and environment: Evidence from China. Economic Research-Ekonomska Istraživanja, 35, 1–25. https://doi.org/10.1080/1331677X.2021.2012710
- Onishi, A. (2010). A new challenge to economic science: Global model simulation. Journal of Policy Modeling, 32(1), 1–46. https://doi.org/10.1016/j.jpolmod.2009.09.003
- Pesaran, M. H. (2007). A simple panel unit root test in the presence of cross‐section dependence. Journal of Applied Econometrics, 22(2), 265–312. https://doi.org/10.1002/jae.951
- Pesaran, M. H., Ullah, A., & Yamagata, T. (2008). A bias-adjusted LM test of error cross-section independence. The Econometrics Journal, 11(1), 105–127. https://doi.org/10.1111/j.1368-423X.2007.00227.x
- Prideaux, B., Thompson, M., & Pabel, A. (2020). Lessons from COVID-19 can prepare global tourism for the economic transformation needed to combat climate change. Tourism Geographies, 22(3), 667–678. https://doi.org/10.1080/14616688.2020.1762117
- Qiu, S., Wang, Z., & Geng, S. (2021). How do environmental regulation and foreign investment behavior affect green productivity growth in the industrial sector? An empirical test based on Chinese provincial panel data. Journal of Environmental Management, 287, 112282.https://doi.org/10.1016/j.jenvman.2021.112282
- Qu, C., Shao, J., & Cheng, Z. (2020). Can embedding in global value chain drive green growth in China’s manufacturing industry? Journal of Cleaner Production, 268, 121962. https://doi.org/10.1016/j.jclepro.2020.121962
- Rao, P., & Holt, D. (2005). Do green supply chains lead to competitiveness and economic performance? International Journal of Operations & Production Management, 25(9), 898–916. https://doi.org/10.1108/01443570510613956
- Rios, V., & Gianmoena, L. (2018). Convergence in CO2 emissions: A spatial economic analysis with cross-country interactions. Energy Economics, 75, 222–238. https://doi.org/10.1016/j.eneco.2018.08.009
- Rizvi, S. K. A., Mirza, N., Naqvi, B., & Rahat, B. (2020, July) Covid-19 and asset management in EU: A preliminary assessment of performance and investment styles. Journal of Asset Management, 21(4), 281–291. https://doi.org/10.1057/s41260-020-00172-3
- Rizvi, S. K. A., Yarovaya, L., Mirza, N., & Naqvi, B. (2020). The impact of COVID-19 on valuations of non-financial European firms. Heliyon, 8(6), e09486. https://doi.org/10.1016/j.heliyon.2022.e09486.
- Roodman, D. (2009). How to do xtabond2: An introduction to difference and system GMM in Stata. The Stata Journal: Promoting Communications on Statistics and Stata, 9(1), 86–136. https://doi.org/10.1177/1536867X0900900106
- Safi, A., Wang, Q. S., & Wahab, S. (2022, April 1). Revisiting the nexus between fiscal decentralization and environment: Evidence from fiscally decentralized economies. Environmental Science and Pollution Research International, 29(38), 58053–58064.https://doi.org/10.1007/s11356-022-19860-1
- Shabir, M., Ali, M., Hashmi, S. H., & Bakhsh, S. (2022). Heterogeneous effects of economic policy uncertainty and foreign direct investment on environmental quality: Cross-country evidence. Environmental Science and Pollution Research International, 29(2), 2737–2752.https://doi.org/10.1007/s11356-021-15715-3
- Shaikh, Z. (2018). Towards sustainable development: A review of green technologies. Trends in Renewable Energy, 4(1), 1–14. https://doi.org/10.17737/tre.2018.4.1.0044
- Srivastava, A. K., Dharwal, M., & Sharma, A. (2022). Green financial initiatives for sustainable economic growth: A literature review. Materials Today: Proceedings, 49, 3615–3618. https://doi.org/10.1016/j.matpr.2021.08.158
- Su, C.-W., Li, W., Umar, M., & Lobonţ, O.-R. (2022). Can green credit reduce the emissions of pollutants? Economic Analysis and Policy, 74, 205–219. https://doi.org/10.1016/j.eap.2022.01.016
- Su, C.-W., Mirza, N., Umar, M., Chang, T., & Albu, L. L. (2022). Resource extraction, greenhouse emissions, and banking performance. Resources Policy, 79, 103122. https://doi.org/10.1016/j.resourpol.2022.103122
- Su, C.-W., Umar, M., & Gao, R. (2022). Save the environment, get financing! How China is protecting the environment with green credit policies? Journal of Environmental Management, 323, 116178. https://doi.org/10.1016/j.jenvman.2022.116178
- Taghizadeh-Hesary, F., Zakari, A., Alvarado, R., & Tawiah, V. (2022). The green bond market and its use for energy efficiency finance in Africa. China Finance Review International, 12(2), 241–260. https://doi.org/10.1108/CFRI-12-2021-0225
- Umar, M., Ji, X., Kirikkaleli, D., & Xu, Q. (2020b). COP21 Roadmap: Do innovation, financial development, and transportation infrastructure matter for environmental sustainability in China? Journal of Environmental Management, 271, 111026. https://doi.org/10.1016/j.jenvman.2020.111026
- Umar, M., Ji, X., Kirikkaleli, D., Shahbaz, M., & Zhou, X. (2020a). Environmental cost of natural resources utilization and economic growth: Can China shift some burden through globalization for sustainable development? Sustainable Development, 28(6), 1678–1688. https://doi.org/10.1002/sd.2116
- Umar, M., Ji, X., Mirza, N., & Li, H. (2022). Crypto swings and the performance of carbon-intensive equity funds in China. Resources Policy, 78, 102786. https://doi.org/10.1016/j.resourpol.2022.102786
- Ünüvar, B. (2019). Financing the green economy. In S. Acar & E. Yeldan (Eds.), Handbook of green economics (pp. 163–181). Academic Press. https://doi.org/10.1016/b978-0-12-816635-2.00010-9
- Wahab, S., Imran, M., Safi, A., Wahab, Z., & Kirikkaleli, D. (2022, February 24). Role of financial stability, technological innovation, and renewable energy in achieving sustainable development goals in BRICS countries. Environmental Science and Pollution Research International, 29(32), 48827–48838.https://doi.org/10.1007/s11356-022-18810-1
- Wahab, S., Zhang, X., Safi, A., Wahab, Z., & Amin, M. (2021). Does energy productivity and technological innovation limit trade-adjusted carbon emissions? Economic Research-Ekonomska Istraživanja, 34(1), 1896–1912. https://doi.org/10.1080/1331677X.2020.1860111
- Wang, J., Wang, W., Ran, Q., Irfan, M., Ren, S., Yang, X., Wu, H., & Ahmad, M. (2022). Analysis of the mechanism of the impact of internet development on green economic growth: Evidence from 269 prefecture cities in China. Environmental Science and Pollution Research International, 29(7), 9990–10004.https://doi.org/10.1007/s11356-021-16381-1
- Wang, K.-H., Umar, M., Akram, R., & Caglar, E. (2021). Is technological innovation making world “Greener”? An evidence from changing growth story of China. Technological Forecasting and Social Change, 165, 120516. https://doi.org/10.1016/j.techfore.2020.120516
- Wang, Z., Shahid, M. S., Binh An, N., Shahzad, M., & Abdul-Samad, Z. (2022). Does green finance facilitate firms in achieving corporate social responsibility goals? Economic Research-Ekonomska Istraživanja, 35(1), 5400–5419. http://www.tandfonline.com/action/authorSubmission?journalCode=rero20&page=instructions. https://doi.org/10.1080/1331677X.2022.2027259
- Wu, Q., Zhou, J., Liu, S., Yang, X., & Ren, H. (2016). Multi-objective optimization of integrated renewable energy system considering economics and CO2 emissions. Energy Procedia, 104, 15–20. https://doi.org/10.1016/j.egypro.2016.12.004
- Yang, C.-H. (2021). A hybrid optimization decision model for a smart green energy industry park: Exploring the impact of the carbon tax policy in Taiwan. Computers & Industrial Engineering, 160, 107567. https://doi.org/10.1016/j.cie.2021.107567
- Yang, L., & Ni, M. (2022). Is financial development beneficial to improve the efficiency of green development? Evidence from the “Belt and Road” countries. Energy Economics, 105, 105734. https://doi.org/10.1016/j.eneco.2021.105734
- Yang, S., Chen, Z., Umar, M., & Khursheed, A. (2022). Environmental regulation and high-quality sustainable development of China’s economy–an empirical study based on a spatial durbin model and threshold model. Economic Research-Ekonomska Istraživanja, 35(1), 5699–5718. https://doi.org/10.1080/1331677X.2022.2035243
- Yoshino, N., Taghizadeh-Hesary, F., & Nakahigashi, M. (2019). Modelling the social funding and spill-over tax for addressing the green energy financing gap. Economic Modelling, 77, 34–41. https://doi.org/10.1016/j.econmod.2018.11.018
- Yu, W., Chavez, R., Feng, M., Wong, C. Y., & Fynes, B. (2020). Green human resource management and environmental cooperation: An ability-motivation-opportunity and contingency perspective. International Journal of Production Economics, 219, 224–235. https://doi.org/10.1016/j.ijpe.2019.06.013
- Yumei, H., Iqbal, W., Irfan, M., & Fatima, A. (2022). The dynamics of public spending on sustainable green economy: Role of technological innovation and industrial structure effects. Environmental Science and Pollution Research, 29(16), 22970–22988. https://doi.org/10.1007/s11356-021-17407-4
- Zhang, J., Kang, L., Li, H., Ballesteros-Pérez, P., Skitmore, M., & Zuo, J. (2020). The impact of environmental regulations on urban Green innovation efficiency: The case of Xi’an. Sustainable Cities and Society, 57, 102123. https://doi.org/10.1016/j.scs.2020.102123
- Zhao, P.-J., Zeng, L.-E., Lu, H.-Y., Zhou, Y., Hu, H.-Y., & Wei, X.-Y. (2020). Green economic efficiency and its influencing factors in China from 2008 to 2017: Based on the super-SBM model with undesirable outputs and spatial Dubin model. Science of the Total Environment, 741, 140026. https://doi.org/10.1016/j.scitotenv.2020.140026
- Zhao, X., Ma, X., Shang, Y., Yang, Z., & Shahzad, U. (2022). Green economic growth and its inherent driving factors in Chinese cities: Based on the Metafrontier-global-SBM super-efficiency DEA model. Gondwana Research, 106, 315–328. https://doi.org/10.1016/j.gr.2022.01.013
- Zheng, G. W., Siddik, A. B., Masukujjaman, M., & Fatema, N. (2021). Factors affecting the sustainability performance of financial institutions in Bangladesh: The role of green finance. Sustainability, 13(18), 10165. https://doi.org/10.3390/su131810165