
 ?Mathematical formulae have been encoded as MathML and are displayed in this HTML version using MathJax in order to improve their display. Uncheck the box to turn MathJax off. This feature requires Javascript. Click on a formula to zoom.
Abstract
Achieving carbon neutrality is a tedious challenge confronting African countries that have witnessed mounting environmental degradation. Renewable energy consumption (REC) and forestation play a critical role in dealing with the situation. Therefore, to address this concern, this study assesses the dynamic energy or environmental efficiency of 43 sampled African countries by proffering a new dynamic meta-frontier DEA model from 2010 to 2018. The bootstrap truncation regression model investigates the influence of forestation and REC on environmental efficiency in Africa. The dynamic environmental efficiency of the 43 concerned African countries is low (0.59), indicating vast room for improvement. The heterogeneity of dynamic environmental efficiency across the income groups is evident. The upper-middle-income group (UMIG) had the best performance, followed by the low-middle-income group (LMIG) and the low-income group (LIG). The technology gap ratio also confirmed the existence of a huge gap across the income groups in Africa. The bootstrap truncation regression results confirmed a U-shaped relationship between economic growth and dynamic environmental efficiency in Africa. Forestation and REC positively correlate to dynamic CO2 emission and energy efficiency in Africa. In contrast, financial development is negatively associated with CO2 emissions and Africa’s energy efficiency. The study’s findings will aid the sampled African countries in their quest to attain carbon neutrality, thereby promoting sustainability on the African continent.
JEL CODES:
1. Introduction
Globally, carbon dioxide (CO2) emissions derived from excessive energy consumption have been recognised to have caused environmental degradation. Accordingly, afforestation has been identified as a vital tool for reducing CO2 emissions (Begum et al., Citation2020; Favero et al., Citation2020). Forest-based actions have gained the attention of researchers and policymakers worldwide. For this reason, several economies globally have incorporated carbon sequestration based-policies in their quest to control CO2 emissions, all serving the purpose of the “Paris Agreement” (Forsell et al., Citation2016). The “Paris Agreement” champions reducing the “global average temperature to 1.5 °C by 2100” by proposing afforestation-based actions.
Sustainability has become a hot topic in Africa because of concerns about increasing CO2 emissions associated with the growing fossil energy utilisation and economic expansion activities. Indeed, from 2008 to 2018, Africa’s overall primary energy use increased by 2.4%, surpassing the annual global average rate of 1.6% (BP, Citation2020). During the same period, Africa’s total CO2 emissions have drastically risen by 2.0%, outperforming the world’s total mean value of 1.1%. From 2000 to 2016, Africa’s mean GDP growth rate was 4.6%, and its real GDP is projected to reach 3.9% and 4.1% in 2020 and 2021, respectively. Meanwhile, Africa’s urban population grew faster than the global average of 4.91 (Jiang et al., Citation2021). According to IEA (Citation2019), about 2040 million people are projected to stay in urban Africa by 2040, a figure outpacing the whole of the European Union’s current population.
More importantly, the African governments heavily depend on fossil fuels to power their economies (Ouedraogo, Citation2017). Consequently, the second contributing factor to greenhouse gas emissions on the African continent is energy utilisation after land use and forest degradation (Nyiwul, Citation2019). Although the continent contributes less to the world’s carbon emission at 4% (IEA, Citation2019), its ecosystem is heavily experiencing the catastrophic impact of climate change, and future effects are monumental (Stuch et al., Citation2021).
In response, African policymakers have wholeheartedly embraced the concept of carbon neutrality in their quest to promote sustainability on the continent. For instance, in 2015, the Africa Union promulgated the “Agenda 2063” in Ethiopia. One of the essential aims of “Agenda 2063” is to modernise Africa’s energy sector and ensure access to clean and affordable energy for all Africans. Another laudable policy is establishing a “sustainable energy fund for Africa (SEFA)”, which seeks to serve as succour for implementing renewable energy projects in Africa.
Several viable solutions are available to mitigate the dangerous effects of Green House Emissions (GHE). For example, the “Paris Agreement” advocates minimising CO2 emissions using afforestation and forest-based actions. African countries must follow the “Paris Agreement” stipulations to promote sustainability by reducing deforestation and avoiding forest degradation. Tree plants can retain carbon, emit oxygen during photosynthesis and have the capacity to store atmospheric carbon in the soil. Thus, the increase in afforestation can promote carbon storage in the African sub-region, substantially reducing global CO2 emissions.
Further, the forests play a critical role in ensuring the balance of the global climatic system by adequately absorbing and keeping carbon and other atmospheric gases (Li et al., Citation2021; Teng et al., Citation2021). Nevertheless, no scientific study in Africa precisely measures the dynamic impact of forestation on CO2 emissions reduction. Meanwhile, deforestation is one of the challenges militating against Africa’s economic prosperity. A specific study on the influence of forestation on CO2 emission reduction in Africa is lacking.
In addition, the global climate change trends have awakened the concerns for environmentally friendly technologies in both emerging and developed economies needed to sustain development (Anwar et al., Citation2021). The consumption of environmentally green technologies like renewable technology conserves the environment. Adding renewable energy to the energy mix can promote environmental degradation mitigation and energy security, thus boosting green growth and development (Luni & Majeed, Citation2020). More importantly, concerns about CO2 emissions and the skyrocketing fossil fuel prices have necessitated alternative energy sources like renewable energy worldwide (Dong & Pan, Citation2020). Therefore, promoting the availability of green technologies (renewable energy) and abating deforestation is the priority of economies worldwide. Essentially, African countries are also aiming at accomplishing these targets. The tasks are to improve the growing demand for renewable energy and to conserve the African forested area. Adopting a renewable energy mix can ensure reliability, affordability, and viable paths toward CO2 emissions reduction (Luni & Majeed, Citation2020). Empirically, several studies such (Cao et al., Citation2020; Chen et al., Citation2021; Forsell et al., Citation2016; Lesiv et al., Citation2019; Nilsson & Schopfhauser, Citation1995; Teng et al., Citation2021; Zomer et al., Citation2008), investigated carbon sequestration for a single country or regions but none of these prior studies examined the dynamic impact of forestation and renewable energy use on CO2 emission reduction in Africa. There is an urgent need to control CO2 emissions in Africa to safeguard environmental quality. The energy trilemma (Energy security, sustainability, and affordability) challenge needs to be improved in Africa.
Furthermore, promoting the adoption and utilisation of REC will enhance energy efficiency and provide cleaner energy sources, thus limiting fossil fuel utilisation in Africa. These advantages associated with RCE have made it necessary to gain much attention in the sustainability debate. More so, due to climate change challenges coupled with energy efficiency and energy security advocacy, most recent efficiency studies (Amowine et al., Citation2019, Citation2020; Ohene-Asare et al., Citation2020; Shen et al., Citation2022) in the African continent typically advocate for the attainment of a trade-off between these two critical policy outcomes—first, the accomplishment of energy security by raising the proportion of REC in the energy mix, which eventually aid in CO2 emission reduction. Second, efforts should be made toward the accomplishment of sustainable economic growth. Achieving these policy targets in a unified framework is a mounting challenge for African governments. However, climate change-minded scholars have started employing an integrated method to measure the causal nexus between economic growth, REC, and CO2 emissions (Amowine et al., Citation2019, Citation2020; Ohene-Asare et al., Citation2020; Shen et al., Citation2022). Although these efficiency studies are scanty and remain at the infant stage in Africa, the empirical study of the role of forests in storing atmospheric carbon (sequestration) is lacking in the energy-growth-environmental nexus on the continent.
Therefore, this study aims to empirically assess the impact of renewable energy consumption (REC) and forestation on CO2 emissions mitigation in Africa by adopting a dynamic DEA model from 2010 to 2018. The current study’s contributions are manifold in Africa. To the best of our knowledge, this study is the first to evaluate the impact of REC and forestation on CO2 emissions reduction drive in Africa. Most of the African continent’s recent efficiency studies (Amowine et al., Citation2019, Citation2020; Ohene-Asare et al., Citation2020) mainly focus on regional groups and do not provide empirical evidence in a comparative setting relating to income groups classification. Another primary concern with the current literature is that those studies in Africa typically ignored heterogeneity across the various income groups on the continent. Africa is mainly natural resources endowment continent, but the critical role of natural resource rent on energy and environmental efficiency is lacking. Given the above issues, we expand the literature on Africa’s energy and environmental efficiency by addressing these concerns in Africa. This profoundly helps to understand the role of forestation, natural resources endowment rent, and REC on Africa’s energy and environmental efficiency.
In addition, the present study provides insightful new conclusions and possible solutions toward climate change mitigation from developing African economies’ perspectives. In doing so, the results of this current study can influence policy formulation regarding afforestation and REC utilisation, thus helping to achieve sustainable development in Africa. Finally, this study intends to expand the energy efficiency literature and provide more nuanced policy recommendations for energy conservation and CO2 emission reduction in Africa.
The study is structured as follows. A literature review of the various driving factors on CO2 emission is captured in Section 2. The construction of the dynamic DEA model is displaced in Section 3. The study’s results are displayed in Section 4. The conclusions and policy implications of the study are shown in Section 5.
2. Literature review
2.1. The evaluation of energy efficiency in Africa
Estimating energy efficiency (EE) generally falls into one of these three frontiers. First is the single factor EE, often denoted by the energy intensity indicator (Pan et al., Citation2021). One limitation of the single-factor approach is that it does not account for production factors like labour and capital (Filippini & Hunt, Citation2015). To overcome this issue, total-factor EE, which considers several production inputs, has been introduced to assess efficiency (Amowine et al., Citation2021; Yang et al., Citation2018). Frontier techniques such as the stochastic frontier approach (SFA) and mathematical approach such as DEA are known statistical methods for measuring energy efficiency. One advantage of the SFA technique is that it can differentiate random noise from technical inefficiencies (Agradi et al., Citation2022). Adom et al. (Citation2021) employed the SFA framework to assess the energy efficiency in Africa, and Sun et al. (Citation2021) adopted it to estimate the EE of 24 OECD countries. Climate change-minded researchers mainly used SFA to analyse efficiency in Africa (Adom et al., Citation2021; Agradi et al., Citation2022; Namahoro et al., Citation2021). However, only a few climate change-minded scholars on the continent employ the DEA method (Amowine et al., Citation2021, Citation2019, Citation2020; Ohene-Asare et al., Citation2020). Meanwhile, unlike the SFA, the DEA framework can measure efficiency involving many inputs—outputs cases (Amowine et al., Citation2021).
The sustainability literature has revealed that improving energy inputs enhance GDP but inevitably increase CO2 emissions (undesirable output). The dynamic DEA, which considers both undesirable and carry-over factors, has been used lately for energy efficiency measures (Atta Mills et al., Citation2021; Teng et al., Citation2021).
2.2. Impact of REC on CO2 emission
Renewable energy sources (RES) are renowned as the panacea to help attain net-zero targets worldwide. REC is carbon-free, which leads to carbon neutrality (Stern & Valero, Citation2021). Reducing fossil fuel utilisation and transiting to renewable energy sources is necessary for tackling climate change menaces. Furthermore, Kenner and Heede (Citation2021) suggested that countries need to drastically reduce fossil fuel consumption and transit to renewables to prevent the global temperature from surpassing 1.5 °C above the pre-industrial era and accelerate carbon-free transformation. In the quest to attain carbon neutrality targets, Perlaviciute et al. (Citation2021) argued that renewable energies are the vehicle needed for plummeting global temperature to a 1.5 °C pathway and navigating to a net-zero society. The utilisation of REC is a worldwide phenomenon as governments devise pragmatic strategies to remove carbon from the community to accomplish net-zero targets adequately. In doing so, climate change-minded scholars have seen renewable energy sources as a viable way to achieve an emission reduction trajectory (Bistline & Blanford, Citation2021; Burandt, Citation2021). For instance, Adams and Acheampong (Citation2019) suggest that increased REC utilisation significantly reduces carbon emissions in Africa. Another study by Namahoro et al. (Citation2021) demonstrated that renewables are vital in curbing emissions in Africa.
Similarly, Danish and Ulucak (Citation2021) supported that REC leads to CO2 emission reduction in China and the United States. However, Adams and Nsiah (Citation2019) reported that renewable energy significantly reduces mounting CO2 emissions in sub-Sahara Africa. A similar finding was achieved by Juan et al. (Citation2021) and Iqbal et al. (Citation2021) for the BRICS and OECD countries, respectively.
2.3. Impact of forestation on CO2 emission
One of the viable ways to remove atmospheric carbon from society is through forests. Taeroe et al. (Citation2017) argued that forests have tremendous potential to reduce CO2 emissions by absorbing them. The authors investigated different types of European forests, such as plantations, managed forests, and those reserved for the sole purpose of carbon storage. They suggested that forests substantially reduce carbon emission compared to the reduction of CO2 emission if wood is employed as an alternative energy source. Meanwhile, in a study by Saranya et al. (Citation2016), forests can equally emit atmospheric carbon and other dangerous gases through forest depletion activities such as forest fires. Likewise, Ahmad et al. (Citation2018) investigated the effect of deforestation and forestation degradation activities in Pakistan from 1994 to 2016. Their finding suggests weak law enforcement, the cultural attitude of the people, and an increasing population with a partial forest protectionism policy are the main driving factors of deforestation in Pakistan from 1994 to 2016. In subtropical China, Li et al. (Citation2019) reported that forests play a crucial role in preserving biodiversity and reducing environmental pollution in China. More importantly, Teng et al. (Citation2021) studied the impact of affectation on CO2 emissions in China from 2007 to 2017 and proposed that afforestation is the best strategy to deal with climate change challenges. Further, Li et al. (Citation2021) investigated the effect of forests on climate change in Chinese provinces and concluded that forest investment and management lead to CO2 emission reduction. Also, Case et al. (Citation2021) studied the impact of forests on emissions in America, suggesting that extreme temperatures affect the carbon storage potential of forest trees. The vast majority of these studies indicated that no empirical research had shed light on African countries’ perspectives.
Meanwhile, Zomer et al. (Citation2008) demonstrated that Africa and South America are the most suitable place on Earth for forest-based plantations to sequester carbon since such regions have large vacant land. Yet most recent empirical efficiency studies (Amowine et al., Citation2021, Citation2019, Citation2020; Ohene-Asare et al., Citation2020) have neglected the role of forests in the African context. International commitments such as the “Clean Development Mechanism” (CDM) contained in the Kyoto Protocol, the Paris Agreement and the “sustainable development goals” (SDGs) all advocated for emission reduction through improved energy use and forests-based actions.
2.4. Impact of economic growth on CO2 emission
The nexus between growth and CO2 emission has been discussed immensely in the sustainability literature for over a decade from the perspective of the Environmental Kuznets Curve (EKC) theoretical framework (Bibi & Jamil, Citation2021). The EKC stipulates that increased economic growth can overturn ecological pollution once the economy attains a given income threshold. Thus, the theory hypothesis that the relationship between income and environmental quality is U-shaped. Many studies in the literature have validity to the EKC theory. For instance, Ohene-Asare et al. (Citation2020) validated the EKC for African countries from 2003 to 2011. Further, Amowine et al. (Citation2021) also showed that the EKC was valid for 44 African economies from 2010 to 2016. However, other studies on the African continent demonstrate invalid EKC. Also, Adu and Denkyirah (Citation2018) found no evidence supporting the EKC among West African countries. In a similar study by Erdoğan et al. (Citation2020), the EKC is validated for all the regions investigated except for Sub-Sahara Africa. Although several past studies investigated PGDP–CO2 emission nexus with the EKC theory, environmental pollution reduction variables such as forestation and REC are naturally not included. Hence, this latest study checks the validity of the EKC by adding these critical variables to the equation. More importantly, no study investigated EKC from the perspective of the income group classification in Africa in the DEA literature.
2.5. Impact of natural resources endowment rent on CO2 emission
Africa witnessed tremendous economic growth over the past two decades, yet her economy is predominantly agriculture and natural resources (Amowine et al., Citation2021). These sub-sectors are renowned drivers of CO2 emissions (Adedoyin et al., Citation2020). The African continent is the second in population, just behind Asia, having countries gifted with abundant natural resource endowment. Therefore, her supply of needed raw materials for the production of tangible goods which aid world economic prosperity cannot be overlooked. A recent debate in the sustainability literature is the effect of resource endowment rent transcends beyond the economic sphere, notably on growth and other significant welfare indicators. Recent studies have demonstrated that natural resource endowment rent (NRER) could pose severe ecological implications. For instance, Danish (Citation2020) revealed that, together with water productivity, and trade, NRER increases the level of CO2 emission in the world’s economy. This novel finding mirror those of Adedoyin et al. (Citation2020) that NRER raises CO2 emissions in the long run. Using the European Union (EU) countries as the object of the evaluation, similar empirical evidence is presented by (Bekun et al., Citation2019). This shows that the over-reliance on natural resources has dire implications for the environment, particularly if the country has inadequate resource conservation policies. In short, the empirical findings on the impact of resource reliance on CO2 emission trends are scanty. While it is now vigorously being investigated, it is still at the infancy level. The limitation is also more visible and prominent to the sampled African countries whose resource dependence position has not been explored in the sustainability literature, particularly using the DEA framework. This concern has been addressed in this study.
2.6. Impact of financial development on CO2 emission
Financial inclusion is an essential determinant of CO2 emission. For example, Amowine et al. (Citation2021) found financial development to impede ecological efficiency in Africa. Atta Mills et al. (Citation2021) obtained similar financial development findings to impact the Belt & Road economies’ energy efficiency negatively. Lahiani et al. (Citation2021) established those financial developments lead to renewable energy advancement to accomplish carbon neutrality in the United States. In China, Zhao and Yang (Citation2020) reported that financial development significantly aids CO2 emission reduction at the province level. In Sub-Saharan Africa, Aluko and Obalade (Citation2020) found empirical evidence to support the impact of financial development for 35 countries in that region. On the same African continent, Awan et al. (Citation2020) revealed that financial development has dire implications on CO2 emissions in North African countries. The critical role of financial development continues to generate mixed findings, and it’s super relevant to add it as a control variable in this study
2.7. The research gap
Notwithstanding the research mentioned above’s achievements, it has ignored two significant areas of interest. First, none of the abovementioned studies integrated REC, forestation, and energy efficiency in a single coherent study, particularly for African countries. Second, these past studies did not examine the dynamic CO2 emission and energy efficiency across Africa’s various income group levels. The measurement of heterogeneity provides a better and more comprehensive understanding of Africa’s dynamic energy efficiency across the income groups. Methodological-wise, this study built a new meta-dynamic DEA model for estimating the energy across the income groups and proffers the DEA statistical framework, unlike the SFA, which does not need any pre-conditions (assumptions) of the underlying production technology. Therefore, the current study addressed these concerns in the African sustainability literature.
3. Materials and methods
This study designed and formulated the dynamic DEA model by combining Färe and Grosskopf (Citation2010) directional distance function and the meta-frontier framework by O’Donnell et al. (Citation2008) to gauge the dynamic energy efficiency in Africa. Further, the bootstrap truncation regression technique is adopted to investigate the impact of REC and forestation on energy and CO2 emission efficiency in Africa. The study’s dynamic model is built and constructed as follows:
3.1. Dynamic DEA model
We assume that African countries are highly different across the various income groups. The management type, resource utilisation, and mode of production differ across Africa’s income groups. Past energy efficiency studies on the continent that fail to acknowledge these income disparities will likely impact policy formulations. The meta-frontier framework is employed to deal with the shortfall.
(1)
(1)
3.2. The group frontier
The following model can achieve the computation of group efficiency:
(2)
(2)
3.3. Meta-technology ratio and inefficiency decomposition in Africa
3.3.1. Meta-technology gap measurement
The meta-technology ratio (MTR) calculation is measured by EquationEq. (3)(3)
(3) . The ratio between the meta-frontier efficiency (MFE) relative to the group frontier efficiency (GFE) is defined as the MTR. It is shown as:
(3)
(3)
3.3.2. Dynamic energy inefficiency decomposition in Africa
This section explores the primary sources of the inefficiency of dynamic energy efficiency in Africa. According to Chiu et al. (Citation2012), the inefficiency can be decomposed into technology gap inefficiency (TGI) and group managerial inefficiency (GMI). The meta-frontier total inefficiency (MTI) estimated relative to the meta-frontier is the summation of TGI and GMI. Statistically, the closer the MTI is to unity, the more inefficiency the firm is. See EquationEq. (4)(4)
(4)
(4)
(4)
3.4. Input, good output, and bad output index efficiencies in Africa
Hu and Wang (Citation2006) utilised the “total-factor energy efficiency” (TFEE) index to solve any discriminatory bias associated with the basic energy efficiency parameters. The input indicators (are labour, population, and fossil fuel use), good outputs (GDP), and bad outputs (CO2 emission). The i and t denote area and time, respectively. The indicators efficiency models are expressed as follows.
(5)
(5)
The interpretation, should the target input be the same as the actual input, then a total overall efficiency (1) is accomplished. However, if the target input is less than the actual, the estimated efficiencies are less than a unit, which records an inefficiency situation.
The performance of an estimated DMU is 1 when the target good outputs are the same as the actual good outputs, which means total efficiency. The performance is not equal to 1 if the target good output exceeds the actual output, demonstrating total inefficiency.
The efficiency of an estimated DMU is 1 when the target bad output factor is the same as the actual, which shows total efficiency is attained. When the efficiency is less than a unit, the target bad output factor is far greater than the actual, indicating total inefficiency.
3.5. Econometric model construction and driving factors selection
This section introduces the regression technique and the influencing factors selection adopted in this study.
3.5.1. Bootstrap truncation regression for analysing the driving factors in Africa
The distribution of the efficiency estimates generated by the dynamic DEA model is truncated and not normally distributed. Thus, measurement based on the ordinary least squares (OLS) might lead to severe statistical bias (Luo et al., Citation2021; Ohene-Asare et al., Citation2020). Prior studies on the continent mainly adopt the Tobit and multiple regression framework to examine eco-efficiency determinants. However, Simar and Wilson (Citation2007) argued that the efficiency estimate derived from the dynamic DEA approach is highly serially biased. The application of Tobit regression might result in incorrect conclusions. The bootstrap truncation technique has been widely used to examine the influence of contextual variables on efficiency (Amowine et al., Citation2021). Therefore, this study adopts the bootstrap truncation framework to investigate the impact of REC and forestation on CO2 efficiency in Africa. The study proposes the following nonlinear model as follows:
(6)
(6)
Where denotes the corrected bootstrapped Africa dynamic energy efficiency.
and
represents the fixed effect and the error term at time t, respectively. All variables were utilised in natural logarithms form.
3.5.2. Index selection of influencing factors
The “Environmental Kuznets Curve” (EKC) is associated with per capita income and dynamic energy efficiency. (1) Per capita income (PGDP) is adopted as an index for economic growth (Amowine et al., Citation2021; Liu et al., Citation2020; Twum et al., Citation2021). PGDP2 is added to the regression equation to capture the non-linearity association between dynamic energy efficiency and economic growth. (2) Forestation (FO). Forests have tremendous potential to reduce CO2 emissions by absorbing them (Taeroe et al., Citation2017). Therefore, forestation should be essential for dynamic energy and CO2 emission efficiency analysis. (3) Renewable energy consumption (REC) is renowned for its low-carbon nature, which leads to carbon neutrality (Amowine et al., Citation2021; Stern & Valero, Citation2021). REC presents green technological innovation spillovers and influences dynamic energy efficiency. The other control variables, that is, Natural resource endowment rent (NRER), financial development (FINDEV), and the interaction term of financial development and renewable energy (FINDEV*REC), can directly influence energy efficiency and environmental pollution.
3.6. Data used
This study adopts annual balanced panel data for Forty-three (43) African countries from 2010 to 2018. As shown in , the data is sourced from the US energy administration and the World Bank Development Indicators (WDI). Purposely, the study uses energy consumption, labour, and population as the input indicators; the output factors include; GDP and environmental pollution (CO2 emission). Fixed asset deploys as the carryover parameter. Around 54 countries constituted the Africa sub-region, according to the World Bank. However, considering a balanced data panel and scalability, 43 African countries were selected for the concerned study variables. Specifically, we did not go past the study time frame since these countries had a lot of missing data; this necessitated the study to select 43 African countries from 2010 to 2018. Further, the study sample of 43 African countries was classified into three sub-groups according to gross national income (GNI); upper-middle-income countries (UMIC) (GNI: $4,096 to $12,695), lower-middle-income countries (LMIC) (GNI: $1,046 to $4,095) and low-income countries (LIC) (GNI: $1,045 or less) based on the “World Bank country and lending group categorisation” in 2021 employing the “World Bank Atlas method.” Thus, in the study, the UMIC consist of 6 countries, 20 LMIC and 17 LIC, all in the continent of Africa.
Table 1. Definition of the variable used.
More importantly, the sub-division into income levels examines the unique difference in the energy consumption structure, economic development, and the mode of production structure in Africa. The utilisation of resources, management, and production technologies differ across Africa’s income groups. Notably, the study is based on African countries simply because mounting ecological challenges are unceasingly impacting the subregion’s populations and environs. Consequently, preserving the African forests and the strategic investment in REC utilisation will ultimately help mitigate these environmental challenges in Africa. The African governments depend heavily on fossil fuels to power their economies. However, this raises pollution and ecological deterioration.
Additionally, developing economies like those in Africa can significantly invest in environmental entrepreneurship activities such as clean energy and the adaptation of green products like REC that immensely contribute to sustainability. Table S1 thus outlines the investigated African countries sampled from the perspective of the various income groups. and illustrate the definition and descriptive statistics of the different variables used.
Table 2. Descriptive statistics of the various variable used.
As illustrated in , the mean carbon emission for the entire study is higher in Upper-middle African countries than in the pool (Africa) and the other income groups. This means that studies that ignored income group classification might not be able to gauge this critical development. Policymakers should adopt carbon mitigation measures in the upper middle and the whole of Africa to achieve carbon neutrality. Again, the average energy consumption is higher in Upper Middle countries than in Africa and the other two income groups. This implies that higher fossil energy use in the upper-middle African countries might cause higher average CO2 emissions.
Interestingly, the low, middle group appeared to have higher mean GDP than the main panel and the other groups. The rest variables, such as population, labour, and fixed assets, varied with time. All the studies were normalised to conform with energy and CO2 emission values to ensure robustness. Those statistics were not reported but available upon request due to lack of space. The statistics displaced above confirmed that African countries differ in income group classification.
In , the average per capita GDP (PGDP) is higher in the upper-middle-income group, followed by the main panel (Africa), the low-middle-income group, and the low income had the least mean PGDP. The low-income group appeared to be investing more in REC, followed by the low-middle, the pool, and the upper-middle-income group. Forestation is more preserved in the low-income group, followed by the main panel, low-middle, and upper-middle-income. These African countries are advised to invest more in REC and afforestation-based products to aid the decarbonisation drive on the continent. Natural resource endowment rent and development followed the same trend.
Table 3. Summary statistics of the driving factors across the income groups in Africa.
4. Results and discussion
4.1. Meta-frontier dynamic energy efficiency in Africa from 2010 to 2018
shows the total meta-frontier efficiency from 2010 to 2018. shows average efficiency trends across the income groups in Africa, while demonstrates the average overall efficiency trend by country.
Figure 1. Average total meta-frontier efficiency across the income group in Africa.
Source: Krug (Citation2018).
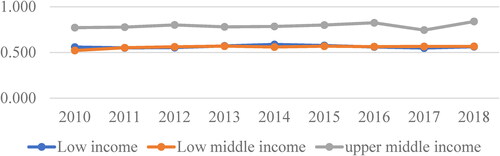
Figure 2. Average total meta-frontier efficiency scores by countries.
Source: Krug (Citation2018).
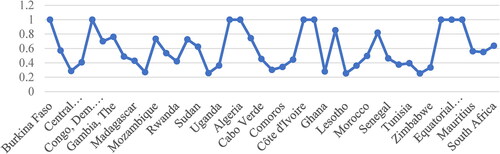
Table 4. Africa’s total dynamic meta-frontier efficiency from 2010 to 2018.
and show that only ten African countries have reached the production frontier with an average inefficiency of 0.407. Kenya and Nigeria have the relatively best performance and thus require minimum improvement to reach the contemptuous frontier. The other concerned countries have poor performance and need massive improvement to be efficient. This indicates that carbon emissions and other anthropogenic activities have dire consequences on efficiency and sustainable economic prosperity derived on the continent.
At the income group level (), the group categorisation shows that the upper-middle countries have substantial differences relative to the low-income and low-middle groups, indicating significant differences in the income group classification. In , there is evidence of heterogeneity among the three income groups. These findings demonstrate a slight heterogeneity relative to production technology and ecological management efforts in attaining carbon neutrality within these groups (low-income, low-middle, and upper-middle African countries). Meanwhile, these findings support significant heterogeneities among African countries at the continent level, as illustrated by Amowine et al. (Citation2021). More importantly, the continent’s transformation can be accomplished by neighbourhood sharing vital information and technology transfer and implementing similar energy improvement policies among the African regional groups (Adom, Citation2019). The overall average efficiency of this study was not high (0.593) during the entire study period, indicating that energy improvement is required in Africa. These results can be compared to those (Amowine et al., Citation2021; Ohene-Asare et al., Citation2020; Qu et al., Citation2022) measuring African energy and ecological efficiency. The impact of carryover factors and CO2 emissions have dire implications on efficiency in Africa. Therefore, in the context of carbon neutrality, the concerned African countries should reduce CO2 emissions and other anthropogenic activities to achieve carbon neutrality and sustainable economic development.
4.2. Group dynamic energy efficiency in Africa from 2010 to 2018
EquationEquation (2)(2)
(2) was adopted to compute the efficiency across the three income groups in Africa. presents the average dynamic energy efficiency across income groups in Africa from 2010 to 2018.
Table 5. Mean group dynamic energy efficiency in Africa from 2010 to 2018.
From , the Upper-middle-income group had the best overall average efficiency of 1 from 2010 to 2018, implying the best group in this study. Further, the average overall efficiency in the low-income group was 0.826—the second. The low-middle-income group followed closely with an average overall efficiency of 0.783. The results further confirmed the heterogeneity in these African countries regarding their income groups. The overall mean dynamic energy efficiency across the three income groups in Africa was 0.830, demonstrating that Africa’s energy efficiency at the income group level is higher than the meta efficiency in . The possible reason for the slightly higher efficiency at the group level is the recent implementation of REC projects across the various regional blocs on the African continent. Managerial implication - Policymakers should focus more on improving Africa’s energy to ensure sustainability.
4.3. The meta-technology ratio (MTR) in Africa
Based on the dynamic meta-frontier model in Section 3, this section measures the technology gap caused by income group heterogeneity. The MTR is an essential component of the meta-frontier concept as it measures the gap in production technology among the different production frontiers. Therefore, this study computed the MTR of the three income groups in Africa, and the results are shown in .
Table 6. The average meta-technology gap in Africa’s dynamic energy efficiency from 2010 to 2018.
From , the result provided evidence of substantial heterogeneity among these countries regarding their income status. The overall MTR for the selected African countries is 0.709, indicating that the concerned countries were inefficient. In , the average of MTRs of the upper-middle group appeared to be the best, followed by low middle-income group and the low-income group. None of these groups has MTRs of 1, implying massive improvement is required to boost efficiency at this stage. Managerial implication—energy utilisation technology level is more affected in the low and low-middle-income countries than the upper-middle-income countries, as evident in . Thus, policymakers should leverage improved technology to narrow the gap on the continent.
4.4. Dynamic energy inefficiency decomposition in Africa
Further, this study explores the primary sources of the inefficiency of the concerned African countries. We decomposed the energy inefficiency into technological gap inefficiency (TGI) and group managerial inefficiency (GMI) across the income groups in Africa. The results as shown in . The empirical outcome provides policymakers with in-depth information for improving the continent’s inefficiency.
Table 7. Technology and managerial inefficiency of Africa’s energy governance.
From , the main reason for Africa’s energy governance inefficiency was technical rather than managerial. Indeed, across the income groups in Africa, we observed that the total average inefficiency for the main panel (Africa) is 30.02% for the TGI, and that of GMI is 21.5%. TGI accounted for 29.8% of the inefficiency for the low-income group, while GMI is 19.7%. Additionally, low-middle-income group level, TGI is 28%, and GMI is 27.2%. In the same fashion, in the upper-middle-income group, GMI is 0%, meaning total efficiency, and TGI is 41.7% inefficiency. Hence, African countries should improve their technology level and efficiency.
4.5. Analysis of the inputs and outputs efficiency index within groups in Africa
4.5.1. Labour efficiency
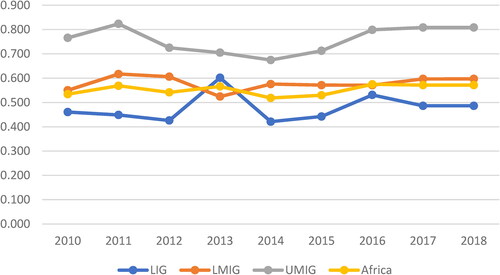
The labour efficiency is presented in as computed by Hu and Wang’s index. From 2010 to 2018, Africa’s average labour efficiency was 0.40 and showed a fluctuating trend. This indicates that labour needs to be appropriately optimised to improve efficiency. From 2014 to 2017, the mean labour efficiency of the upper-middle-income group appeared to be higher than the main panel (Africa). The low-middle income groups seemed to have the lower labour for the entire study period.
Figure 3. Mean labour efficiency across the income groups from 2010 to 2018 in Africa.
Source: Krug (Citation2018).
At the country level, three upper-middle countries have labour efficiency equal to 1 (Botswana, Equatorial Guinea, and Gabon), while low-middle countries (Angola, Côte d‘Ivoire, and Egypt) also have three countries that have reached the efficient frontier. We observed that two countries (Burkina Faso and Cong, Dem. Rep) were efficient for the low-income group. As shown in , none of the groups shows an increasing trend in labour efficiency, implying labour needs to be optimised to improve efficiency on the continent.
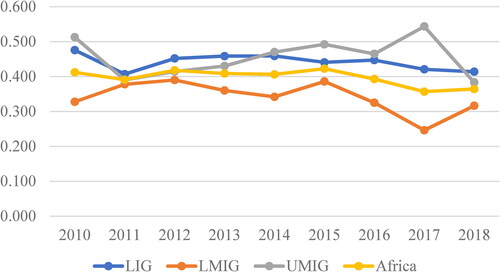
4.5.2. Energy efficiency
Africa’s energy utilisation efficiency demonstrates a fluctuating trend from 2010 to 2018, as displayed in . We observed that the mean energy use efficiency in the upper-middle group was higher than Africa’s average throughout the study period. Further, the mean energy use of the low-income group is lower than the main panel’s (Africa) mean. The average of the low-middle income groups appeared to be similar to the average of the main panel.
Figure 4. Mean energy efficiency within the income groups from 2010 to 2018 in Africa.
Source: Krug (Citation2018).
At the country level, we observed Burkina Faso and Congo Dem. Rep. belongs to the low-income group was efficient. Angola, Côte d‘Ivoire, and Egypt of the low-middle group also reached the frontier, while Botswana, Equatorial Guinea, Gabon, and South Africa were efficient for the upper-middle-income group. Although shows a download trend of energy use efficiency from 2010 to 2018, for 2014, there was a fluctuation. The implementation of REC will further enhance energy on the continent; thus, policymakers are advised to increase the share of renewables in the energy mix.
4.5.3. Fixed assets efficiency
shows Africa’s mean fixed assets efficiency has fluctuated from 2010 to 2018. The average fixed assets efficiency of the upper-middle-income group (UMIG) is higher than the mean of Africa for the entire study period. However, from 2014 to 2018, the average efficiency of the low-middle-income group (LMIG) is slightly bigger than the mean of Africa. The low-income group (LIG) appeared to have the least efficiency during the same period.
Figure 5. Mean fixed asset efficiency within the income groups from 2010 to 2018 in Africa.
Source: Krug (Citation2018).
At the country level, in Angola, Côte d‘Ivoire, and Egypt, the low middle-income group accomplished total efficiency during the study period, while Burkina Faso and Congo Dem. Rep of the low-income group was also efficient. Equatorial Guinea and Gabon also have total efficiencies for the upper-middle-income group for the study period. The UMIG appears to have more fixed-assets accumulation, translating into better efficiency in this section.
4.5.4. GDP efficiency
Africa’s economic growth efficiency has fluctuated from 2010 to 2018 in . The mean GDP efficiency of the upper-middle-income group year by year is higher than the mean of Africa. Contrarily, the low-income group has the lower average GDP efficiency for the whole study period except for 2017.
Figure 6. Mean GDP efficiency within the income groups in Africa from 2010 to 2018.
Source: Krug (Citation2018).
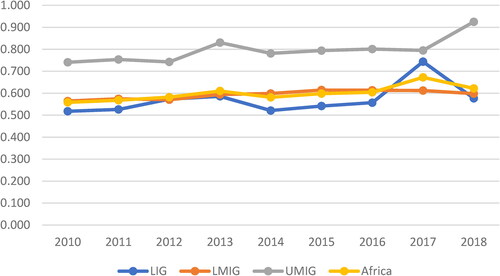
The economic growth efficiency of countries in Africa’s upper-middle-income groups has demonstrated an upward trend, increasing from 0.741 to 0.925. Among them, the economic efficiencies of South Africa, Botswana, Equatorial Guinea, and Gabon are equal to 1 in all the years, attaining optimal output. The rest of the income and Africa appeared to have a downward trend for the entire study period. The upper-middle-income group and the other groups must institute CO2 emission reduction measures to achieve sustainable economic prosperity.
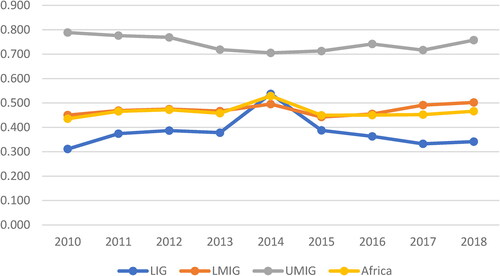
4.5.5. CO2 emission efficiency
Africa’s CO2 emission efficiency fluctuates, except for the upper-middle-income group from 2010 to 2018, as displaced in . The mean of the upper-middle-income group is higher than in Africa and the other groups. Surprisingly, the low-income group is the second-highest CO2 emission efficiency. The possible reason for this phenomenon is that most of these countries focused on economic prosperity regardless of the dire consequences of CO2 emissions. The middle-income group recorded the least efficiency in this category.
Figure 7. Average CO2 emission efficiency within the income groups in Africa from 2010 to 2018
Source: Krug (Citation2018).
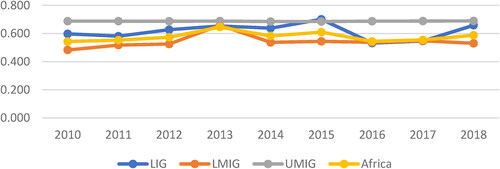
The CO2 emissions efficiency of countries in Africa’s upper middle income has revealed an upward from 0.688 in 2010 to 0.689 in 2018. Low income’s average CO2 emission efficiency trend increased from 0.598 in 2010 to 0.689. The low-middle-income group and Africa witnessed similar trends in CO2 emission efficiency. The position of this current study is to advocate for carbon neutrality in Africa. Thus, mitigating climatic changes should be the focus of governments and climate change scholars on the continent to redefine our shared sustainable future for all.
4.6. Driving factors of dynamic eco-efficiency in Africa
The study further examines the influence of REC and forestation on eco-efficiency in Africa within the EKC framework by adopting the bootstrap truncation modelling technique. The results of the regression estimation are shown in .
Table 8. Results of dynamic eco-efficiency in Africa.
In , the coefficient signs of InPGDP and InPGDP2 establish a U-shaped nexus between growth and eco-efficiency, confirming the EKC theory on the African continent. The impact of per capita income (PGDP) on environmental efficiency is negative at the beginning stages of development to a certain threshold (or critical point) beyond this point; its effect promotes environmental efficiency. Therefore, the nexus between economic growth-environmental efficiency is dynamic, implying that it can encourage or impede depending on the level of development. Ideally, citizens become mindful of their health when income improves and demand a better environment with strict laws and regulations to safeguard the environment. This result confirmed the findings Ohene-Asare et al. (Citation2020) and Amowine et al. (Citation2021) investigating energy efficiency and ecological efficiency in Africa, respectively. Managerially, African governments must consider energy efficiency issues in their quest for economic prosperity. This indicates the need for development via sustainable energy utilisation. One viable solution path to attaining this could be by providing clean and affordable REC, which is known for its low carbon nature.
Renewable energy consumption (REC) is significantly positive and promotes dynamic energy on the African continent. REC is renowned for its low carbon nature and vital green products to curb CO2 emissions in Africa. The utilisation and continuous strategic investment in REC will automatically aid these concerned African countries in attaining carbon neutrality. This result confirmed the findings of Amowine et al. (Citation2021) and Twum et al. (Citation2021) measuring environmental efficiency in Africa and Asia-Pacific, respectively. However, our study findings are not supported by Anwar et al. (Citation2021) employing the SFA framework to investigate the REC-forestation nexus for the Belt and Road countries. Adding clean and affordable energy such as REC to the energy mix is one of the pillars of the SDGs. The SDGs also advocate for incorporating environmentally friendly innovations and investment in green technologies by 2030. REC utilisation in Africa will inevitably lead to more exploiting works in RES. Renewable energy development will translate into economic prosperity and reduce CO2 emissions (Anwar et al., Citation2021). African countries are gifted and endowed in terms of RES, and the SEFA should serve as a vital tool to expand the renewable energy sector on the continent. For instance, Morocco has built one of the world’s most significant solar facilities to help accomplish its 52% renewable energy mix target by 2030. The 6000-acre solar complex provides clean energy for about 2 million of the population. The result of the study thus calls on the African continent’s government to continue investing in the REC sector. This will undoubtedly help the African continent to reduce CO2 emissions and limit its fossil fuel utilisation, thus boosting sustainability in Africa.
Forestation is positively corrected to dynamic energy efficiency for African countries. Forest is notable for its significant impact improving on the environment simply due to its abilities in carbon sequesters. Forests can capture atmospheric carbon and store it in the soil. As a result, conserving the African forested area is essential for mitigating CO2 emissions in our common interest of redefining our future towards sustainability. These findings are supported by Li et al. (Citation2021), measuring the role of forests in controlling CO2 emissions in China. A related study Anwar et al. (Citation2021) found forests to affect CO2 emissions for the Belt and Road countries negatively. Forests are renowned for improving ecological sustainability. Stern (Citation2006) emphasised that avoiding deforestation in any region or country is the most viable way to mitigate CO2 emissions in the atmosphere. It has been estimated that deforestation account for 25% of CO2 emissions among the total GHG emissions (Batavia & Nelson, Citation2018). Given this, the African forests must be conserved and protected to play their vital role in CO2 emissions mitigation and carbon storage to boost global sustainability drive. The findings of this study call for more investment in afforestation-based projects by African governments as forests is the cheaper and natural viable way to reduce CO2 emissions from the atmosphere.
Natural resources endowment rent (NRER) is negatively correlated to dynamic energy efficiency and insignificantly impacts energy efficiency in African economies. Although NRER does not affect dynamic energy efficiency on the continent in this study, it is paramount to emphasise the over-exploitation of the continent’s natural resources will leads to biodiversity depletion and promote unsustainable development. NRER comprises the summation of oil rents, coal rents, mineral rents, natural gas rents, and forest rents. These essential resources on the continent must be utilised effectively to promote sustainability in Africa
Financial development is significantly negative and impedes dynamic energy efficiency on the African continent. These results collaborated with the findings of Amowine et al. (Citation2021) and Atta Mills et al. (Citation2021), studying dynamic ecological and energy efficiency for the African countries and Belt & Road economies, respectively. As Amowine et al. (Citation2021) stated, a sophisticated financial system can aid channel funds for eco-friendly investment in green technologies and renewable projects in Africa, eventually promoting environmental sustainability. Government authorities in Africa are advised to develop the financial system as the results of this study showed the sector could stimulate CO2 emission on the continent. Developed economies have sturdily entrenched and robust financial systems as an innovative strategy to aid in CO2 emission reduction. Thus, fundamental changes are required in the mode of operations of Africa’s financial and private sectors to achieve carbon neutrality targets.
From , based on the interaction term between financial development and renewable energy utilisation, the interaction term is significantly positive and promotes energy efficiency on the African continent. The result indicates that the effect of the interaction term on energy efficiency is conducive; hence it enhances environmental sustainability in Africa. More importantly, understanding the interaction role of financial development and REC in controlling CO2 emission is crucial since it instinctively aids policymakers on the continent to be aware of the priorities of carbon neutrality goals and how to accomplish them.
4.7. Robustness test
Ma et al. (Citation2021) suggested that the study period could be shortened to check the robustness of the initial regression results. Thus, the study’s period was shortened from 2012 to 2018, and we re-run the regression estimation again. The empirical outcomes are displayed in . The result demonstrates that the key explanatory variables did not change, confirming the robustness of the study’s conclusion.
5. Conclusion and policy implications
The present study is motivated by reality since human activities in developed and developing economies have increased CO2 emissions into the atmosphere, causing several climate-related challenges. The current commitments in pledges from the EU and other countries around the globe aim to maintain the average global temperature from surpassing 1.5 °C and accomplish net-zero targets by 2050. Forestation and renewable energy utilisation are argued to have a crucial role with policymakers and international climate-change-minded bodies towards CO2 emissions reduction. However, past efficiency studies did not broadly investigate the influence of REC and forestation on dynamic energy efficiency for African countries. Second, those past studies did not examine the dynamic CO2 emission and energy efficiency across Africa’s various income group levels. Accordingly, this study was undertaken to examine the role of forestation and renewable energy utilisation on CO2 emission and energy efficiency in Africa. The countries were divided into three income groups in Africa to account for the heterogeneity. The dynamic meta-frontier DEA model was adopted to measure the energy efficiency across the income groups in Africa from 2010 to 2018. The truncation bootstrap regression approach discusses the influence of forestation and renewable energy utilisation on CO2 emission and energy efficiency in Africa.
The study’s results after the implementation of the various models are as follows: first, by taking into account the dynamic meta-frontier approach incorporating environmental undesirable output factor (CO2 emissions), the overall average dynamic energy efficiency of the 43 selected African countries is low (0.59) throughout 2010–2018. This result indicates that Africa’s dynamic energy efficiency during the study was not high. At the income group level, the dynamic energy efficiency of the upper-middle-income group (UMIG) had the best performance, followed by the low-middle-income group (LMIG) and the low-income group (LIG). This result confirms the presence of substantial heterogeneity among African countries in terms of their income groups’ classification status.
Further, the MTRs result reveals a substantial gap among the African income group levels. The UMIG had the highest efficiency, followed by the LMIG and the LIG levels. The decomposition of the inefficiency levels into technology and managerial reveals Africa’s energy inefficiency stemmed from technology rather than managerial. Thus, African countries should improve their technology level and efficiency.
In the second stage of the analysis, the study investigates the driving factors of dynamic energy efficiency utilising the bootstrap truncation modelling approach. The main indicators are forestation and REC. The results confirmed a U-shaped relationship between economic growth and African dynamic energy efficiency. Forestation and renewable energy utilisation are significantly corrected to dynamic energy in Africa. The other control indicators influenced the concerned African countries’ efficiency to a certain degree.
The study has several vital policy recommendations for the concerned African countries as follows:
The study found that forestation and REC positively impact CO2 emission and energy efficiency. Therefore, to reduce CO2 emissions and stabilise climate change on the continent, governments should focus more on clean energy and strategically improve investment in green technology. African countries need to drastically reduce fossil fuel utilisation and transit to REC in their quest to achieve a net-zero-carbon continent. Also, the conservation of African forests needs to be protected. Climate change-minded scholars should also advocate for protectionism policies to conserve the African forests and make it a top priority in the energy-growth-environmental nexus debate.
The difference at the income group level can be narrowed by promoting financial inclusion and sharing technological advantages between neighbours at the regional level, setting an example for sustainable economic improvement in all the income groups in Africa. Priorities CO2 emission reduction on the continent and improve resource utilisation efficiency among the investigated countries. Also, policymakers need to promote financial projects on the continent. This could facilitate more financial sectors supporting clean energy drives, leading to a better output for long-term environmental sustainability in Africa.
REC drastically reduces CO2 emission in this study. The study recommends governments on the continent incorporate renewables and energy efficiency improvement concepts into their national plans and budgets as well as exploration, design, and implementation of continental programs to significantly aid the world’s transition to a net-zero world.
Finally, governments on the continent must continue to play a critical role in providing the enabling environment for innovators of clean energy technologies to attain carbon neutrality. Provide palliative incentives such as tax holidays for new companies interested in setting up renewable exploratory plants on the continent. Governments across the various income groups should implement unprecedented reforms to reduce the catastrophic effects of climate change on the continent and promote environmental sustainability for all. Other advanced statistical testing approaches and current data availability could be adopted to expand this study in the future.
The study is interventional critical. It proffers novel recommendations for the attainment of carbon neutrality on the African continent as well as the “Paris Agreement” and the “Sustainable development Goals,” emphasising the accomplishment of net-zero targets through forests-based actions and energy efficiency improvement, respectively. It is essential for climate change-minded scholars and international bodies interested in environmental sustainability.
References
- Adams, S., & Acheampong, A. O. (2019). Reducing carbon emissions: The role of renewable energy and democracy. Journal of Cleaner Production, 240, 118245. https://doi.org/10.1016/j.jclepro.2019.118245
- Adams, S., & Nsiah, C. (2019). Reducing carbon dioxide emissions: Does renewable energy matter? The Science of the Total Environment, 693, 133288. https://doi.org/10.1016/j.scitotenv.2019.07.094
- Adedoyin, F. F., Alola, A. A., & Bekun, F. V. (2020). The nexus of environmental sustainability and agro-economic performance of Sub-Saharan African countries. Heliyon, 6(9), e04878. https://doi.org/10.1016/j.heliyon.2020.e04878
- Adom, P. K. (2019). An evaluation of energy efficiency performances in Africa under heterogeneous technologies. Journal of Cleaner Production, 209, 1170–1181. https://doi.org/10.1016/j.jclepro.2018.10.320
- Adom, P. K., Agradi, M., & Vezzulli, A. (2021). Energy efficiency-economic growth nexus: What is the role of income inequality? Journal of Cleaner Production, 310, 127382. https://doi.org/10.1016/j.jclepro.2021.127382
- Adu, D. T., & Denkyirah, E. K. (2018). Economic growth and environmental pollution in West Africa: Testing the environmental Kuznets curve hypothesis. The Kasetsart Journal Social Sciences, 40, 281–288.
- Agradi, M., Adom, P. K., & Vezzulli, A. (2022). Towards sustainability: Does energy efficiency reduce unemployment in African societies? Sustainable Cities and Society, 79, 103683. https://doi.org/10.1016/j.scs.2022.103683
- Ahmad, A., Liu, Q. I. J., Nizami, S. M., Mannan, A., & Saeed, S. (2018). Carbon emission from deforestation, forest degradation and wood harvest in the temperate region of Hindukush Himalaya, Pakistan between 1994 and 2016. Land Use Policy, 78, 781–790. https://doi.org/10.1016/j.landusepol.2018.07.009
- Aluko, O. A., & Obalade, A. A. (2020). Financial development and environmental quality in sub-Saharan Africa: Is there a technology effect? The Science of the Total Environment, 747, 141515. https://doi.org/10.1016/j.scitotenv.2020.141515
- Amowine, N., Li, H., Boamah, K. B., & Zhou, Z. (2021). Towards ecological sustainability: Assessing dynamic total-factor ecology efficiency in Africa. International Journal of Environmental Research and Public Health, 18(17), 9323. https://www.mdpi.com/1660-4601/18/17/9323 https://doi.org/10.3390/ijerph18179323
- Amowine, N., Ma, Z., Li, M., Zhou, Z., Azembila Asunka, B., & Amowine, J. (2019). Energy efficiency improvement assessment in Africa: An integrated dynamic DEA approach. Energies, 12(20), 3915. https://www.mdpi.com/1996-1073/12/20/3915 https://doi.org/10.3390/en12203915
- Amowine, N., Ma, Z., Li, M., Zhou, Z., Yaw Naminse, E., & Amowine, J. (2020). Measuring dynamic energy efficiency in Africa: A slack-based DEA approach. Energy Science & Engineering, 8(11), 3854–3865. https://doi.org/10.1002/ese3.782
- Anwar, M. A., Nasreen, S., & Tiwari, A. K. (2021). Forestation, renewable energy and environmental quality: Empirical evidence from Belt and Road Initiative economies. Journal of Environmental Management, 291, 112684. https://doi.org/10.1016/j.jenvman.2021.112684
- Atta Mills, E. F. E., Dong, J., Yiling, L., Baafi, M. A., Li, B., & Zeng, K. (2021). Towards sustainable competitiveness: How does financial development affect dynamic energy efficiency in Belt & Road economies? Sustainable Production and Consumption, 27, 587–601. https://doi.org/10.1016/j.spc.2021.01.027
- Awan, A. M., Azam, M., Saeed, I. U., & Bakhtyar, B. (2020). Does globalization and financial sector development affect environmental quality? A panel data investigation for the Middle East and North African countries. Environmental Science and Pollution Research International, 27(36), 45405–45418. https://doi.org/10.1007/s11356-020-10445-4
- Batavia, C., & Nelson, M. P. (2018). Translating climate change policy into forest management practice in a multiple-use context: The role of ethics. Climatic Change, 148(1-2), 81–94. https://doi.org/10.1007/s10584-018-2186-2
- Begum, R. A., Raihan, A., & Said, M. N. M. (2020). Dynamic impacts of economic growth and forested area on carbon dioxide emissions in Malaysia. Sustainability, 12(22), 9375. https://www.mdpi.com/2071-1050/12/22/9375 https://doi.org/10.3390/su12229375
- Bekun, F. V., Alola, A. A., & Sarkodie, S. A. (2019). Toward a sustainable environment: Nexus between CO2 emissions, resource rent, renewable and nonrenewable energy in 16-EU countries. The Science of the Total Environment, 657, 1023–1029. https://doi.org/10.1016/j.scitotenv.2018.12.104
- Bibi, F., & Jamil, M. (2021). Testing environment Kuznets curve (EKC) hypothesis in different regions. Environmental Science and Pollution Research International, 28(11), 13581–13594. https://doi.org/10.1007/s11356-020-11516-2
- Bistline, J. E. T., & Blanford, G. J. (2021). The role of the power sector in net-zero energy systems. Energy and Climate Change, 2, 100045. https://doi.org/10.1016/j.egycc.2021.100045
- BP. (2020). BP statistical review of world energy. https://www.bp.com/en/global/corporate/energy-economics/statistical-review-of-world-energy.html.
- Burandt, T. (2021). Analyzing the necessity of hydrogen imports for net-zero emission scenarios in Japan. Applied Energy, 298, 117265. https://doi.org/10.1016/j.apenergy.2021.117265
- Cao, X-l., Li, X-s., & Breeze, T. D. (2020). Quantifying the carbon sequestration costs for Pinus elliottii afforestation project of China greenhouse gases voluntary emission reduction program: A case study in Jiangxi Province. Forests, 11(9), 928. https://www.mdpi.com/1999-4907/11/9/928 https://doi.org/10.3390/f11090928
- Case, M. J., Johnson, B. G., Bartowitz, K. J., & Hudiburg, T. W. (2021). Forests of the future: Climate change impacts and implications for carbon storage in the Pacific Northwest, USA. Forest Ecology and Management, 482, 118886. https://doi.org/10.1016/j.foreco.2020.118886
- Chen, X., Zhang, X., Wu, X., & Lu, C.-C. (2021). The environmental health and energy efficiency in China: A network slacks-based measure. Energy & Environment, 33(1), 170–188.
- Chiu, C.-R., Liou, J.-L., Wu, P.-I., & Fang, C.-L. (2012). Decomposition of the environmental inefficiency of the meta-frontier with undesirable output. Energy Economics, 34(5), 1392–1399. https://doi.org/10.1016/j.eneco.2012.06.003
- Danish, & Ulucak, R. (2021). Renewable energy, technological innovation and the environment: A novel dynamic auto-regressive distributive lag simulation. Renewable and Sustainable Energy Reviews, 150, 111433. https://doi.org/10.1016/j.rser.2021.111433
- Danish. (2020). Moving toward sustainable development: The relationship between water productivity, natural resource rent, international trade, and carbon dioxide emissions. Sustainable Development, 28(4), 540–549. https://doi.org/10.1002/sd.2007
- Dong, F., & Pan, Y. (2020). Evolution of renewable energy in BRI countries: A combined econometric and decomposition approach. International Journal of Environmental Research and Public Health, 17(22), 8668. https://www.mdpi.com/1660-4601/17/22/8668 https://doi.org/10.3390/ijerph17228668
- Erdoğan, S., Yıldırım, S., Yıldırım, D. Ç., & Gedikli, A. (2020). The effects of innovation on sectoral carbon emissions: Evidence from G20 countries. Journal of Environmental Management, 267, 110637. https://doi.org/10.1016/j.jenvman.2020.110637
- Färe, R., & Grosskopf, S. (2010). Directional distance functions and slacks-based measures of efficiency. European Journal of Operational Research, 200(1), 320–322. https://doi.org/10.1016/j.ejor.2009.01.031
- Favero, A., Daigneault, A., & Sohngen, B. (2020). Forests: Carbon sequestration, biomass energy, or both? Science Advances, 6(13), eaay6792. https://doi.org/10.1126/sciadv.aay6792
- Filippini, M., & Hunt, L. C. (2015). Measurement of energy efficiency based on economic foundations. Energy Economics, 52, S5–S16. https://doi.org/10.1016/j.eneco.2015.08.023
- Forsell, N., Turkovska, O., Gusti, M., Obersteiner, M., Den Elzen, M., & Havlik, P. (2016). Assessing the INDCs’ land use, land use change, and forest emission projections. Carbon Balance and Management, 11(1), 1–17. https://doi.org/10.1186/s13021-016-0068-3
- Hu, J.-L., & Wang, S.-C. (2006). Total-factor energy efficiency of regions in China. Energy Policy, 34(17), 3206–3217. https://doi.org/10.1016/j.enpol.2005.06.015
- IEA. (2019). Africa energy outlook. International Energy Agency. https://www.iea.org/africa2019
- Iqbal, N., Abbasi, K. R., Shinwari, R., Guangcai, W., Ahmad, M., & Tang, K. (2021). Does exports diversification and environmental innovation achieve carbon neutrality target of OECD economies? Journal of Environmental Management, 291, 112648. https://doi.org/10.1016/j.jenvman.2021.112648
- Jiang, S., Zhang, Z., Ren, H., Wei, G., Xu, M., & Liu, B. (2021). Spatiotemporal characteristics of urban land expansion and population growth in Africa from 2001 to 2019: Evidence from population density data. ISPRS International Journal of Geo-Information, 10(9), 584. https://www.mdpi.com/2220-9964/10/9/584 https://doi.org/10.3390/ijgi10090584
- Juan, L., Shen, Y., Li, X., & Hasnaoui, A. (2021). BRICS carbon neutrality target: Measuring the impact of electricity production from renewable energy sources and globalization. Journal of Environmental Management, 298, 113460. https://doi.org/10.1016/j.jenvman.2021.113460
- Kenner, D., & Heede, R. (2021). White knights, or horsemen of the apocalypse? Prospects for Big Oil to align emissions with a 1.5 °C pathway. Energy Research & Social Science, 79, 102049. https://doi.org/10.1016/j.erss.2021.102049
- Krug, J. H. (2018). Accounting of GHG emissions and removals from forest management: a long road from Kyoto to Paris. Carbon balance and management, 13(1), 1–11.
- Lahiani, A., Mefteh-Wali, S., Shahbaz, M., & Vo, X. V. (2021). Does financial development influence renewable energy consumption to achieve carbon neutrality in the USA? Energy Policy, 158, 112524. https://doi.org/10.1016/j.enpol.2021.112524
- Lesiv, M., Shvidenko, A., Schepaschenko, D., See, L., & Fritz, S. (2019). A spatial assessment of the forest carbon budget for Ukraine. Mitigation and Adaptation Strategies for Global Change, 24(6), 985–1006. https://doi.org/10.1007/s11027-018-9795-y
- Li, Y., Bao, W., Bongers, F., Chen, B., Chen, G., Guo, K., Jiang, M., Lai, J., Lin, D., Liu, C., Liu, X., Liu, Y., Mi, X., Tian, X., Wang, X., Xu, W., Yan, J., Yang, B., Zheng, Y., & Ma, K. (2019). Drivers of tree carbon storage in subtropical forests. The Science of the Total Environment, 654, 684–693. https://doi.org/10.1016/j.scitotenv.2018.11.024
- Li, Z., Mighri, Z., Sarwar, S., & Wei, C. (2021). Effects of forestry on carbon emissions in China: Evidence from a dynamic spatial Durbin model [Original research]. Frontiers in Environmental Science, 9, 760675. https://doi.org/10.3389/fenvs.2021.760675
- Liu, Z., Zhang, H., Zhang, Y.-J., & Qin, C.-X. (2020). How does income inequality affect energy efficiency? Empirical evidence from 33 Belt and Road Initiative countries. Journal of Cleaner Production, 269, 122421. https://doi.org/10.1016/j.jclepro.2020.122421
- Luni, T., & Majeed, M. T. (2020). Improving environmental quality through renewable energy: Evidence from South Asian economies. International Journal of Energy and Water Resources, 4(3), 335–345. https://doi.org/10.1007/s42108-020-00073-6
- Luo, Y., Lu, Z., Muhammad, S., & Yang, H. (2021). The heterogeneous effects of different technological innovations on eco-efficiency: Evidence from 30 China’s provinces. Ecological Indicators, 127, 107802. https://doi.org/10.1016/j.ecolind.2021.107802
- Ma, D., Li, G., & He, F. (2021). Exploring PM2.5 environmental efficiency and its influencing factors in China. International Journal of Environmental Research and Public Health, 18(22), 12218. https://www.mdpi.com/1660-4601/18/22/12218 https://doi.org/10.3390/ijerph182212218
- Namahoro, J. P., Wu, Q., Zhou, N., & Xue, S. (2021). Impact of energy intensity, renewable energy, and economic growth on CO2 emissions: Evidence from Africa across regions and income levels. Renewable and Sustainable Energy Reviews, 147, 111233. https://doi.org/10.1016/j.rser.2021.111233
- Nilsson, S., & Schopfhauser, W. (1995). The carbon-sequestration potential of a global afforestation program. Climatic Change, 30(3), 267–293. https://doi.org/10.1007/BF01091928
- Nyiwul, L. M. (2019). Climate change mitigation and adaptation in Africa: Strategies, synergies, and constraints. In T. Sequeira & L. Reis (Eds.), Climate change and global development: Market, global players and empirical evidence (pp. 219–241). Springer International Publishing. https://doi.org/10.1007/978-3-030-02662-2_11
- O’Donnell, C. J., Rao, D. S. P., & Battese, G. E. (2008). Metafrontier frameworks for the study of firm-level efficiencies and technology ratios. Empirical Economics, 34(2), 231–255. https://doi.org/10.1007/s00181-007-0119-4
- Ohene-Asare, K., Tetteh, E. N., & Asuah, E. L. (2020). Total factor energy efficiency and economic development in Africa. Energy Efficiency, 13(6), 1177–1194. https://doi.org/10.1007/s12053-020-09877-1
- Ouedraogo, N. S. (2017). Africa energy future: Alternative scenarios and their implications for sustainable development strategies. Energy Policy, 106, 457–471. https://doi.org/10.1016/j.enpol.2017.03.021
- Pan, X., Wei, Z., Han, B., & Shahbaz, M. (2021). The heterogeneous impacts of interregional green technology spillover on energy intensity in China. Energy Economics, 96, 105133. https://doi.org/10.1016/j.eneco.2021.105133
- Perlaviciute, G., Steg, L., & Sovacool, B. K. (2021). A perspective on the human dimensions of a transition to net-zero energy systems. Energy and Climate Change, 2, 100042. https://doi.org/10.1016/j.egycc.2021.100042
- Qu, J., Li, A., & N’Drin, M. G.-R. (2022). Measuring technology inequality across African countries using the concept of efficiency Gini coefficient. Environment, Development and Sustainability, 1–32. https://doi.org/10.1007/s10668-022-02236-3
- Saranya, K., Reddy, C. S., & Rao, P. P. (2016). Estimating carbon emissions from forest fires over a decade in Similipal Biosphere Reserve, India. Remote Sensing Applications: Society and Environment, 4, 61–67. https://doi.org/10.1016/j.rsase.2016.06.001
- Shen, Z., Shao, A., Chen, J., & Cai, J. (2022). The club convergence of green productivity across African countries. Environmental Science and Pollution Research International, 29(3), 4722–4735. https://doi.org/10.1007/s11356-021-15790-6
- Simar, L., & Wilson, P. W. (2007). Estimation and inference in two-stage, semi-parametric models of production processes. Journal of Econometrics, 136(1), 31–64. https://doi.org/10.1016/j.jeconom.2005.07.009
- Stern, N. (2006). Review on the economics of climate change, HM Treasury, UK. http://www.sternreview.org.uk.
- Stern, N., & Valero, A. (2021). Innovation, growth and the transition to net-zero emissions. Research Policy, 50(9), 104293. https://doi.org/10.1016/j.respol.2021.104293
- Stuch, B., Alcamo, J., & Schaldach, R. (2021). Projected climate change impacts on mean and year-to-year variability of yield of key smallholder crops in Sub-Saharan Africa. Climate and Development, 13(3), 268–282. https://doi.org/10.1080/17565529.2020.1760771
- Sun, H., Edziah, B. K., Kporsu, A. K., Sarkodie, S. A., & Taghizadeh-Hesary, F. (2021). Energy efficiency: The role of technological innovation and knowledge spillover. Technological Forecasting and Social Change, 167, 120659. https://doi.org/10.1016/j.techfore.2021.120659
- Taeroe, A., Mustapha, W. F., Stupak, I., & Raulund-Rasmussen, K. (2017). Do forests best mitigate CO2 emissions to the atmosphere by setting them aside for maximization of carbon storage or by management for fossil fuel substitution? Journal of Environmental Management, 197, 117–129. https://doi.org/10.1016/j.jenvman.2017.03.051
- Teng, X., Liu, F-p., & Chiu, Y-h (2021). The change in energy and carbon emissions efficiency after afforestation in China by applying a modified dynamic SBM model. Energy, 216, 119301. https://doi.org/10.1016/j.energy.2020.119301
- Twum, F. A., Long, X., Salman, M., Mensah, C. N., Kankam, W. A., & Tachie, A. K. (2021). The influence of technological innovation and human capital on environmental efficiency among different regions in Asia-Pacific. Environmental Science and Pollution Research International, 28(14), 17119–17131. https://doi.org/10.1007/s11356-020-12130-y
- U.S. (2020). Energy information administration. https://www.eia.gov/international/data/world.
- WDI. (2020). World Bank Development Indicators database (online). https://data.worldbank.org/ Accessed 30 Nov
- Yang, Z., Wang, D., Du, T., Zhang, A., & Zhou, Y. (2018). Total-factor energy efficiency in China’s agricultural sector: Trends, disparities and potentials. Energies, 11(4), 853. https://www.mdpi.com/1996-1073/11/4/853 https://doi.org/10.3390/en11040853
- Zhao, B., & Yang, W. (2020). Does financial development influence CO2 emissions? A Chinese province-level study. Energy, 200, 117523. https://doi.org/10.1016/j.energy.2020.117523
- Zomer, R. J., Trabucco, A., Bossio, D. A., & Verchot, L. V. (2008). Climate change mitigation: A spatial analysis of global land suitability for clean development mechanism afforestation and reforestation. Agriculture, Ecosystems & Environment, 126(1–2), 67–80. https://doi.org/10.1016/j.agee.2008.01.014