Abstract
We report the effect of the introduction of a fungal glutamate dehydrogenase gene (gdhA) into forage rice (cv. Momiroman) by analyzing the transgenic rice plants in terms of growth, source function, and nitrogen contents. NADP (H)-dependent glutamate dehydrogenase activities in the gdhA-transgenic lines were markedly higher than those in non-transgenic control plants. Plant growth analysis at the seedling stage revealed that the leaf area and shoot and root dry weights of the high gdhA-expressors were higher than those of control plants under both high (high N) and low nitrogen (low N) conditions. These results suggested that the source ability was enhanced by the gdhA introduction. This was supported by the fact that the net photosynthesis rate at the heading stage was also higher in transgenic than in control leaves. Furthermore, under both high and low N conditions, the nitrogen contents in the shoots and roots, at seedling and grain-harvest stages, were significantly higher in high gdhA-expressors than in control plants, indicating that nitrogen uptake was higher in transgenic than in control plants. At the harvest stage, the high gdhA-expressors exhibited greater panicle and spikelet numbers per plant compared with control plants, resulting in higher grain weight, under the high N conditions. In addition, gdhA expression in forage rice significantly enhanced their tolerance to salt stress compared to control plants. The present study showed that the introduction of a fungal gdhA into forage rice could lead to higher source ability, better growth and higher grain weight by enhancing nitrogen uptake efficiency.
Continuous growth of the global population and the subsequent increase in food demand have led to a demand for increasing agricultural production. To meet this increased demand, current agricultural practices rely heavily on nitrogenous fertilizers in the form of ammonium (NH) or nitrate (NO
). However, crop plants can utilize only 30–50% of the applied nitrogen. The unused nitrogen is inevitably leached into the underground water system, and diffuses into the atmosphere causing severe environmental problems which might lead to global warming (Bates et al., Citation2008) and potentially induce health problems such as gastric cancer and methemoglobinemia in humans (Luo et al., Citation2006; Umar et al., Citation2007). Therefore, there is a need to improve the ability of crop plants to utilize nitrogenous fertilizers by promoting nitrogen uptake, assimilation, and metabolism.
The main form of nitrogen available for crop plants such as rice (Oryza sativa L.) in irrigated paddy fields is NH. Assimilation of NH
into amino acids is performed through the cooperative activity of two enzymes, glutamine synthetase (GS), and glutamate synthase (GOGAT), referred to together as the GS/GOGAT cycle in higher plants (Lea & Miflin, Citation1974). The ATP-dependent condensation of NH
with glutamate is catalyzed by GS to produce glutamine. GOGAT transfers the amide nitrogen of glutamine to 2-oxoglutarate (2-OG) to form two glutamate molecules. Since the discovery of the GS/GOGAT cycle in higher plants in the 1970s, the role of glutamate dehydrogenase (GDH; EC 1.4.1.2–4) in NH
assimilation has been a matter of controversy. GDH catalyzes the reversible amination of 2-OG with NH
to form glutamate in the presence of NAD(P)H as a cofactor (Wootton, Citation1983). There are at least two distinct enzymes for GDH: NAD(H)–GDH (EC 1.4.1.2) and NADP(H)–GDH (EC 1.4.1.4). In comparison with NAD(H)–GDH, very little has been reported on NADP(H)–GDH in plants, and its role in plant metabolism remains obscure. In higher plants, the biosynthetic function of GDH seems improbable because GDH has a low affinity for NH
(Harrison et al., Citation2000). However, in micro-organisms such as bacteria or Ascomycota, both NADP(H)–GDH and GS play important roles in NH
assimilation (Kinghorn & Pateman, Citation1973). Some reports show that the affinity of GDH for NH
is considerably higher in micro-organisms than in higher plants (Miflin & Lea, Citation1980; Noor & Punekar, Citation2005; Srivastava & Singh, Citation1987; Wang & Tian, Citation2001). Mutants of Aspergillus nidulans lacking GDH activity showed severe reduction in growth after the supply of a source of nitrogen, whereas inactivation of GOGAT had no effect on the growth phenotype (Kinghorn & Pateman, Citation1973; Macheda et al., Citation1999). These results suggest that both GDH and GS play essential roles in the synthesis of glutamate and glutamine, respectively, during NH
assimilation in micro-organisms. The presence of NADP(H)–GDH in micro-organisms led to the hypothesis that the introduction of this gene into higher plants might enhance plants’ nitrogen assimilation. Some transgenic plants have been generated using the bacterial or fungal NADP(H)–GDH gene (Ameziane et al., Citation2000; Kisaka & Kida, Citation2003), some of which had enhanced biomass and yield. Kisaka and Kida (Citation2003) reported that in tomato overexpressing the gdhA gene for NADP(H)–GDH from A. nidulans, the level of total free amino acids in fruits was 2–3-fold higher than in controls. Abiko et al. (Citation2010) introduced a gdhA gene isolated from A. niger in food rice (cv. Yamahoushi) and found that its overexpression resulted in elevated dry weight, nitrogen content, and grain yield in transgenic plants under high nitrogen conditions.
Rice is one of the most important food crops in the world and the most important grain with regard to human nutrition and caloric intake. Recently, rice has been used for feeding livestock as well as for human food. In 2011, the Japanese proportion of self-sufficiency in forage crops was only 26% of the total digestible nutrients consumed (MAFF, Citation2013). The Japanese government has been encouraging cultivation of feed rice, which will then be available for use in livestock diets (Sittiya et al., Citation2011). In Japan, forage rice, a new variety for whole-crop silage has been developed. This has high biomass production and high lodging resistance. Therefore, forage rice could be cultivated with a higher nitrogen loading than used for common rice cultivation. However, this may further increase environmental pollution due to leaching of nitrogen unused as mentioned above, as well as through emission of nitrogen oxide into air (Vitousek et al., Citation1997). Decreasing nitrogen fertilizer inputs by improving feed crop nitrogen use efficiency will be essential for future sustainable agriculture. Of feed rice, cv. Momiroman seems to be most suitable cultivar due to its high grain yield and its lodging resistance is superior, being evaluated as ‘very strong.’ According to yield trial tests by the National Institute of Crop Science, its yield of rough brown rice was 35–40% more than that of cv. Nipponbare and 8–15% more than the high yielding cv. Takanari. Total digestible nutrient yield per unit of whole plant of Momiroman at the yellowing–ripe stage was about 8% more than that of Nipponbare. Therefore, Momiroman is a potential superior cultivar for forage rice and whole-crop silage (Hirabayashi et al., Citation2010). In the present study, we examined the effects of the introduction of a fungal GDH gene into Momiroman by analyzing the transgenic rice plants in terms of growth, source function, and nitrogen contents. In addition, since it has been reported that transgenic plants expressing fungal or bacterial GDH showed improved tolerance to abiotic stresses (Du et al., Citation2014; Lightfoot et al., Citation2007), we examined the effect of exogenously introduced NADP(H)–GDH on salt tolerance capacity of the control and transgenic plants at the three-leaf stage using 50, 100, and 150 mM sodium chloride (NaCl) solutions. The present study demonstrated that the introduction of a fungal GDH gene into forage rice led to higher source ability, better growth, and higher grain weight, by enhancing nitrogen uptake efficiency and salt tolerance.
Materials and methods
Plant materials and growth
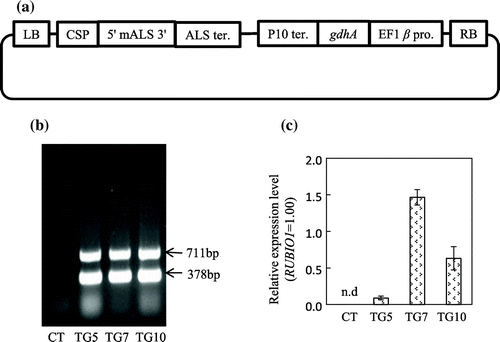
The full-length cDNA for NADP(H)-dependent GDH was isolated from A. niger by reverse transcription-PCR (RT-PCR) (Abiko et al., Citation2010). Information on the complete nucleotide sequences and amino acid sequences for A. niger gdhA was obtained from public databases (GenBank Accession Number Y15784). To express introduced gdhA constitutively within transgenic rice plants, we used a rice elongation factor-1 beta promoter (EF1β; Gene Locus Os04g0118400) and a rice prolamin 10 terminator (P10; Os03g0766000). PCR-amplified cDNA for gdhA, DNA for the EF1β promoter, and DNA for the P10 terminator were subcloned appropriately into a plasmid vector, pUC19 (Takara Bio, Shiga, Japan). The resultant EF1β promoter–gdhA–P10 terminator was amplified by PCR and introduced into pSTARA R-4 (Inplanta Innovations, Yokohama, Japan) with substitution of promoter and terminator region of mutated acetolactate synthase (mALS) gene to produce a binary vector for rice transformation. The resultant construct (Figure (a)) contained the mALS gene, regulated by callus specific promoter (CSP;Os10g0207500), which confers resistance to bispyribac-sodium (BS), an ALS-inhibiting herbicide, and thus can be used as a selectable marker for rice transformation (Kawai et al., Citation2007). The constructed plasmid was introduced into forage rice cv. Momiroman by Agrobacterium-mediated transformation (Toki et al., Citation2006). The BS-resistant, regenerated rice plants were grown in a glasshouse. T1 seeds were obtained from more than 10 independent lines. Three transgenic lines (TG5, TG7 and TG10) were selected for further analyses, based on the results of genomic PCR and quantitative RT-PCR analysis (Figure (b) and (c)) and the abundance of seeds produced.
Figure 1. Generation of transgenic rice plants expressing the gdhA gene. (a) Plasmid construct for the transformation. LB, left border; RB, right border; CSP, callus specific promoter; mALS, mutated acetolactate synthase gene; ALS ter., ALS terminator; EF1β pro, elongation factor 1beta promoter; P10ter, prolamin 10 terminator. (b) Genomic PCR analysis of control (CT) and transgenic (TG5, TG7 and TG10) lines. The gdhA gene, 711 bp; mALS gene, 378 bp. (c) Quantitative RT-PCR was analysis of gdhA transcripts in the leaves. RT-PCR was performed with RNA from the leaves of the T3 generations of CT, TG5, TG7, and TG10 lines. Values are expressed as the means ± SD of eight replicates, after normalization with internal control gene (RUBIQ1). The letters ‘n.d.’ indicates ‘not detected.’
Seeds of transgenic (T2; all the plants used for analyses were checked by a genomic PCR with regard to the introduction of gdhA) and control rice plants were sown on 10 May, and grown hydroponically in 20-liter containers with Yoshida nutrient solution in a greenhouse (day/night cycle of 14/10 h and 25/20 °C). For high nitrogen (high N) treatment, the Yoshida nutrient solution ingredients were diluted to 1/4 strength, resulting in a final concentration of 360 μM nitrogen (180 μM NH4NO3). For low nitrogen (low N) treatment, the Yoshida nutrient solution ingredients were also diluted to 1/4 strength with the exception of nitrogen, which was further reduced to 1/16, resulting in a final concentration of 90 μM nitrogen. To enable seedlings to gradually adapt to the change of nitrogen, the seeds were initially sown in water; after 6 d, the water was changed to 1/16 Yoshida nutrient solution for 3 d; then, the concentration of Yoshida solution was raised to 1/4 for 6 d; after that, the Yoshida solution was changed back to water for 3 d. Then, 18-d-old seedlings (3-leaf stage) were transferred to a corresponding diluted Yoshida nutrient solution (high or low N conditions). The nutrient solution was daily adjusted to pH 5.0, and the solution was exchanged every 3 d. Plants were sampled after 10 and 24 d of nitrogen supplementation. The samples for RT-PCR were divided into leaf blades, stems, and roots and immediately frozen in liquid nitrogen and kept at –80 °C until use. The samples for biomass analysis were divided into leaf blades, stems, and roots.
In addition, we examined the effect of exogenously introduced NADP(H)–GDH on salt tolerance capacity of control and transgenic plants at the three-leaf stage. The plants were subjected to salt stress by, respectively, adding 50, 100, and 150 mM NaCl to 1/4 Yoshida nutrient solution for 5 d. The NADP(H)–GDH activities, dry weight, nitrogen content, and nitrogen concentration were measured.
Genomic PCR and RT-PCR analyses of transgenic rice plants
Genomic DNA was extracted from the leaves of control and transgenic lines by a modified cetyltriethyl ammnonium bromide method (Murray & Thompson, Citation1980). Amplification by PCR was carried out using two pairs of primers, gdhA-specific primers: 5′-TCCATCCTCAAGTTCCTTGG-3′ and 5′- CGGAAACTTCGTTCTGGGTA-3′; CSP- and mALS-specific primers: 5′- ATCGGCATCGAGACCTATCC-3′ and 5′-TGTCGCTGGTGGTTCTTACG-3′, with 35 cycles of incubation at 94 °C for 30 s, 58 °C for 90 s and 72 °C for 90 s, with a final extension at 72 °C for 5 min.
Total RNA was extracted from the fully expanded, upper-most leaves of 6-week-old seedlings (6–8 leaf stage). Total RNA was purified by RNease Plant Mini kit (Qiagen, Valencia, CA, USA), according to the manufacturer’s instructions. After elimination of DNA with TURBO DNase (Invitrogen, Carlsbad, CA, USA), total RNA was quantified by spectrophotometric analysis. First strand cDNA was synthesized from the total RNA samples (200 ng) using SuperScript III reverse-transcriptase (Life Technologies Japan, Tokyo, Japan), and then an aliquot of the first-strand cDNA mixture was used as the template for real-time quantitative PCR analysis. Each PCR (10 μL of total volume) was performed with 1 μL of cDNA mixtures, 5 μL of Platinum SYBR Green qPCR SuperMix-UDG with ROX (Invitrogen, Foster, CA, USA), and gdhA specific primer combination; 5′-TCAAGAATGCTCTCACTGGC-3′ as the forward and 5′-TGAAGGAAACACAGAAGCGA-3′ as the reverse primer. The conditions used for quantitative PCR with a real-time PCR machine (ABI7300 model; Applied Biosystems, Foster, CA, USA) were 50 °C for 2 min, 95 °C for 2 min, and 40 cycles of 95 °C for 15 s and 60 °C for 31 s. The amount of product was quantified using a standard curve after normalization with transcripts from an internal control gene RUBIQ1 (Os06g0681400).
Enzyme assays
The frozen shoots and roots of seedlings were powdered under liquid nitrogen and homogenized using an extraction buffer: 100 mM HEPES–NaOH (pH 7.5), 1 mM EDTA (pH 7.5), 1 mM PMSF, 10% glycerol (v/v), 0.2% 2-mercaptoethanol (v/v), 0.2% Triton X-100 (v/v) and 0.2% PVPP. The homogenized tissues were centrifuged at 15,000 rpm for 20 min at 4 °C. The supernatants were then desalted using Sephadex G-25 (GE Healthcare, Buckinghamshire, UK) and NADP(H)–GDH enzyme activities were measured by the methods described by Abiko et al. (Citation2010). The aminating activity of NADP(H)–GDH was determined in a reaction mixture (1.0 mL of final volume) containing 100 mM Tris–HCl, 10 mM NH4Cl, 10 mM 2-OG, and 0.1 mM β-NADPH at pH 8.0. The deaminating activity of NADP(H)–GDH was determined in a reaction mixture (1.0 mL final volume) containing 100 mM Tris–HCl, 100 mM L-glutamate, and 0.4 mM β-NADP+ at pH 9.3. The reaction was routinely started by the addition of coenzyme (β-NADPH or β-NADP+, respectively). The NADP(H)–GDH activities were measured by monitoring the change in absorbance at 340 nm with a spectrophotometer (DU800, Beckman Coulter, Fullerton, CA, USA). Soluble protein was measured by Bradford protein assay (Bradford, Citation1976), using a Protein Assay Kit (Bio-Rad Laboratories, Hercules, CA, USA) and bovine serum albumin as a standard.
Measurement of dry weight, nitrogen, and carbon contents
Leaf blades, stems, and roots of 10- and 24-d-old seedlings were harvested and dried at 80 °C for 3 d. Dried samples were weighed and ground with Multi-Beads Shocker (Yasui-Kikai, Osaka, Japan). The nitrogen and carbon contents of samples were measured using an NC analyzer (vario MAX CN model; Elementar, Hanau, Germany) according to the manufacturer’s instructions.
In addition, to evaluate nitrogen uptake efficiency at the seedling stage, two-week-old control and three different transgenic plants were treated for 4 h under high and low N conditions, and then nitrogen contents remained in the culture solution were determined.
Measurement of photosynthetic rates
Photosynthetic rate (Pn) was measured in the attached upper-most, fully expanded leaves using a CIRAS-3 Portable Photosynthesis System (PP Systems, MA, USA). All measurements were performed at 28 °C and 75% relative humidity, with the cuvette flow constant at 300 mL min−1. To obtain a light response curve, the leaf chamber CO2 concentration was maintained at 390 μmol mol−1, and Pn was measured at the following photosynthetic photon flux densities: 2000, 1,500, 1,000, 500, 300, 200, 100, 50, 20, and 0 μmol m−2 s−1.
Statistical analysis
Data were analyzed using one-way ANOVA (SPSS 13.0 for Windows7; SPSS, Chicago, IL, USA). Significant differences were determined based on p < 0.05.
Results
Expression level and GDH activities of transgenic rice plants expressing gdhA
Transgenic lines expressing gdhA under the control of the EF1β promoter were first confirmed by PCR analysis using gdhA (amplified fragment 711 bp) and ALS (the selection marker, amplified fragment 378 bp) specific primers and further identified by semi-quantitative RT-PCR (Figure (b) and (c)). These results indicated that gdhA was successfully introduced and expressed in three independent transgenic lines (TG5, TG7, and TG10), although the expression level was lower in TG5 than in TG7 and TG10.
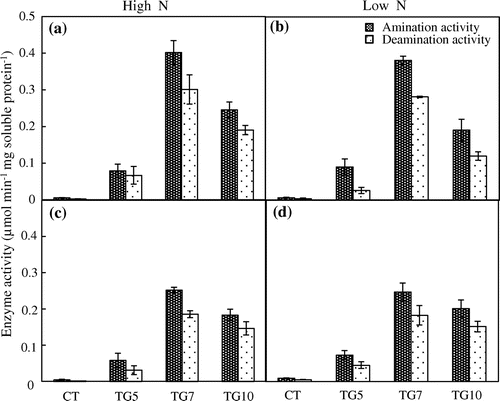
In addition to molecular confirmation, GDH activities were measured in the shoot and root of control and transgenic rice plants. The GDH activities were markedly higher in transgenic lines than in control line in both the aminating and deaminating directions, regardless of nitrogen conditions (Figure ). Furthermore, the in vitro aminating activity of GDH was higher than its deaminating activity in the shoots and roots of transgenic lines in both high and low N conditions. The GDH activities were higher in TG7 and TG10 than in TG5 regardless of nitrogen conditions (Figure ). We called the former two ‘high gdhA-expressors’ and the latter ‘low gdhA-expressors.’
Figure 2. NADP(H)–GDH activities. Aminating (black bars) and deaminating (white bars) activities of NADP(H)–GDH in the shoot (a, b) and root (c, d) were measured in control (CT) and transgenic (TG5, TG7 and TG10) lines under high (a, c) and low (b, d) N conditions after 24 d treatment. Data represent the mean values ± SD (n = 3). Statistical analysis of the data was performed by one-way ANOVA.
Effect of gdhA expression on growth, nitrogen content, and nitrogen uptake efficiency at the seedling stage
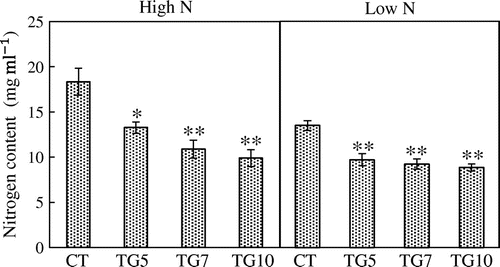
We examined the growth of the control and transgenic lines under high and low N conditions. The control plants grew normally with bright green leaves in Yoshida nutrient solutions containing 360 μM nitrogen, indicating that there was sufficient nitrogen and other nutrients for the seedlings. However, for 90 μM nitrogen, control plants exhibited elongated roots and light-green leaves, suggesting that there was insufficient nitrogen for normal growth (Figure ). Plant growth analysis at the seedling stage revealed that the leaf area and leaf, stem, and root dry weights were significantly higher for high gdhA-expressors than for control in both high and low N plants, while low gdhA-expressors showed higher dry weight only under high N conditions (Figures and ). The stem nitrogen concentrations were higher for high gdhA-expressors than control line under low N conditions, but were opposite under high N conditions (Figure ). The nitrogen contents in leaves, stems, and roots were significantly higher for high gdhA-expressors than control line under both high and low N conditions (Figure ). The nitrogen contents remaining in the Yoshida nutrient solution after the treatment for the three transgenic lines were significantly lower than that for control line under both high and low N conditions, indicating that the transgenic lines took up more nitrogen than did the control line (Figure ).
Figure 3. Phenotype of control (CT) and transgenic (TG10) lines under high and low N conditions after 10 d treatment. Bars = 5 cm.
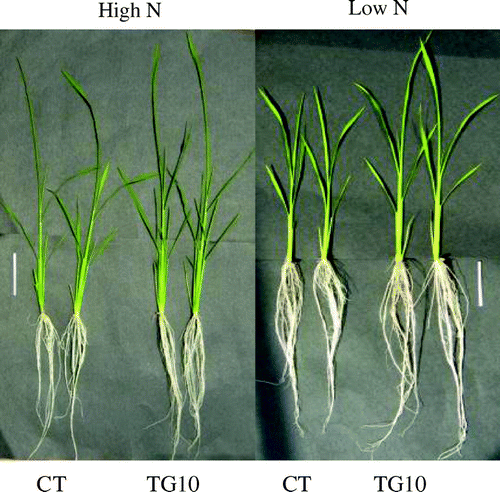
Figure 4. Leaf area of control (CT) and transgenic (TG5, TG7 and TG10) lines under high and low N conditions at the seedling stage. Data represent the mean values ± SD (n = 9). Statistical analysis of the data was performed by one-way ANOVA. Asterisks indicate that the mean values of TG5, TG7, and TG10 lines are significantly different from that of CT at p < 0.05 (*) and p < 0.01 (**). The letters ‘ns’ indicate not significantly different from CT at p < 0.05.
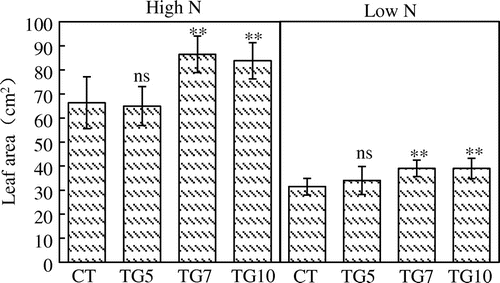
Figure 5. Dry weight of control (CT) and transgenic (TG5, TG7 and TG10) lines under high and low N conditions at the seedling stage. Data represent the mean values ± SD (n = 9). Statistical analysis of the data was performed by one-way ANOVA. Asterisks indicate that the mean values of TG5, TG7 and TG10 lines are significantly different from that of CT at p < 0.05 (*) and p < 0.01 (**). The letters ‘ns’ indicate not significantly different from CT at p < 0.05.
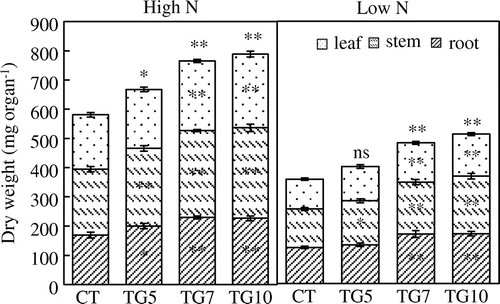
Figure 6. Nitrogen concentration of control (CT) and transgenic (TG5, TG7 and TG10) lines under high and low N conditions at the seedling stage. Data represent the mean values ± SD (n = 4). Statistical analysis of the data was performed by one-way ANOVA. Asterisks indicate that the mean values of TG5, TG7 and TG10 lines are significantly different from that of CT at p < 0.05 (*) and p < 0.01 (**). The letters ‘ns’ indicate not significantly different from CT at p < 0.05.
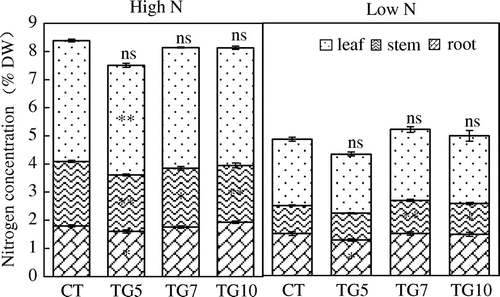
Figure 7. Nitrogen contents of control (CT) and transgenic (TG5, TG7, and TG10) lines under high and low N conditions at the seedling stage. Data represent the mean values ± SD (n = 4). Statistical analysis of the data was performed by one-way ANOVA. Asterisks indicate that the mean values of TG5, TG7, and TG10 lines are significantly different from that of CT at p < 0.05 (*) and p < 0.01 (**). The letters ‘ns’ indicate not significantly different from CT at p < 0.05.
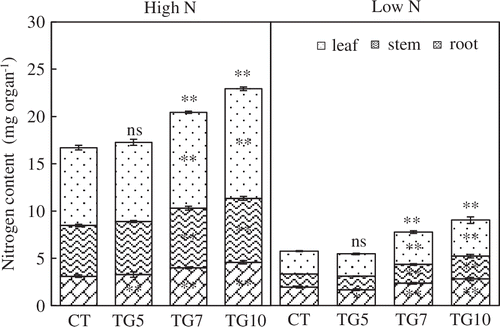
Figure 8. Nitrogen contents of control (CT) and transgenic (TG5, TG7, and TG10) lines remained in the culture solution after 4 h high and low N treatment at the seedling stage. Data represent the mean values ± SE (n = 5). Statistical analysis of the data was performed by one-way ANOVA. Asterisks indicate that the mean values of TG5, TG7 and TG10 lines are significantly different from that of CT at p < 0.05 (*) and p < 0.01 (**).
Effect of gdhA expression on tolerance of salt stress at the seedling stage
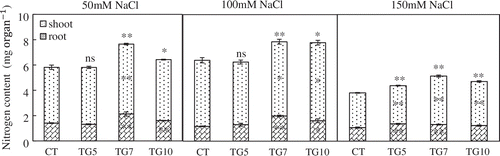
According to previous reports, transgenic plants expressing fungal or bacterial GDHs can show improved drought or herbicide tolerance (Ameziane et al., Citation2000; Du et al., Citation2014; Lightfoot et al., Citation2007; Nolte et al., Citation2004). Therefore, the introduction of NADP(H)-GDH from micro-organisms could improve plant tolerance under stress conditions. To examine the tolerance of transgenic rice plants to salt, the seedlings of control and transgenic lines at the three-leaf stage were subjected to salt stress. The NADP(H)–GDH activities were significantly higher for transgenic than control plants under high salt conditions. Moreover, amination activity was higher than deamination activity in shoots of transgenic lines (Figure ). The transgenic lines remained healthy with green leaves and stems, whereas leaves of control exhibited chlorosis following NaCl treatment, especially for 150 mM NaCl (Figure ). The dry weights of high gdhA-expressors were significantly higher than control line in all NaCl treatments, and dry weights for low gdhA-expressors were also significantly higher than control line under the 150 mM NaCl treatment. Compared with control conditions, the dry weight of control line dropped to 60.3%, while the TG5, TG7, and TG10 dropped to 63.2, 73.6, and 65.9%, respectively, with 150 mM NaCl treatment (Table ). The nitrogen concentration of low gdhA-expressors was higher than control line with 150 mM NaCl treatment, but there were no differences between the other lines and control regardless of NaCl treatment. The nitrogen content was significantly higher for high gdhA-expressors than control line in all NaCl treatments, and was also significantly higher for low gdhA-expressors than control line under 150 mM NaCl treatment (Figures and ).
Figure 9. Aminating (black bars) and deaminating (white bars) activities of NADP (H)–GDH in the shoot were measured in control (CT) and transgenic (TG5, TG7, and TG10) lines after 1 week treatment under different salt stress conditions. Data represent the mean values ± SD (n = 3). Statistical analysis of the data was performed by one-way ANOVA.
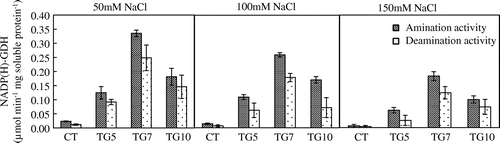
Figure 10. Phenotypic of control (CT) and transgenic (TG5, TG7 and TG10) lines after 1 week treatment under different salt stress conditions. Bars = 5 cm.
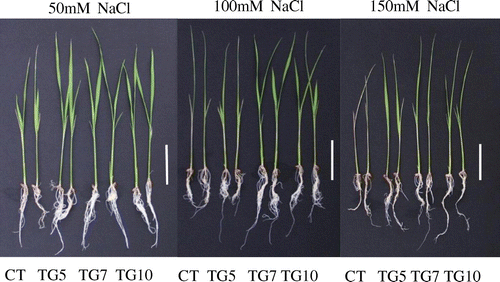
Table 1. Effect of different salt stress on dry weight mg of rice seedlings.
Figure 11. Nitrogen concentration of control (CT) and transgenic (TG5, TG7, and TG10) lines under different salt stress conditions. Data represent the mean values ± SD (n = 4). Statistical analysis of the data was performed by one-way ANOVA. Asterisks indicate that the mean values of TG5, TG7 and TG10 lines are significantly different from that of CT at p < 0.05 (*) and p < 0.01 (**). The letters ‘ns’ indicate not significantly different from CT at p < 0.05.
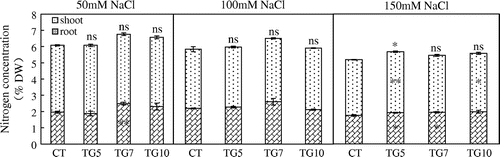
Figure 12. Nitrogen contents of control (CT) and transgenic (TG5, TG7 and TG10) lines under different salt stress conditions. Data represent the mean values ± SD (n = 4). Statistical analysis of the data was performed by one-way ANOVA. Asterisks indicate that the mean values of TG5, TG7, and TG10 lines are significantly different from that of CT at p < 0.05 (*) and p < 0.01 (**). The letters ‘ns’ indicate not significantly different from CT at p < 0.05.
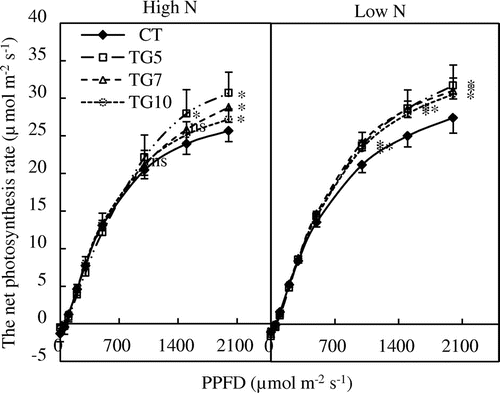
Effect of gdhA expression on the Pn at the heading stage
The increases in dry weight implied an increase in carbon assimilation, which could be mainly due to enhanced Pn. To validate this hypothesis, the light responses of Pn were measured for both transgenic and control lines. The results show that the Pn under high light intensity was higher in all transgenic leaves than in control leaves, regardless of nitrogen conditions at the heading stage (Figure ).
Figure13. The light response curves of Pn of control (CT) and transgenic (TG5, TG7 and TG10) lines under high and low N conditions at the heading stage. Data represent the mean values ± SD (n = 4). Statistical analysis of the data was performed by one-way ANOVA. Asterisks indicate that the mean values of TG5, TG7, and TG10 lines are significantly different from that of CT at p < 0.05 (*) and p < 0.01 (**). The letters ‘ns’ indicate not significantly different from CT at p < 0.05.
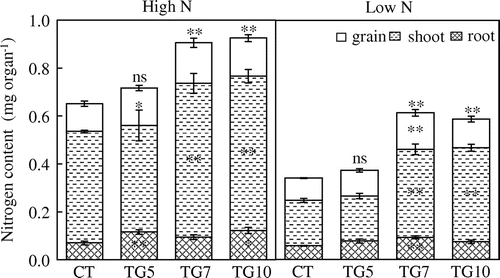
Effect of gdhA expression on nitrogen content and concentration at the harvest stage
The nitrogen concentrations of transgenic lines did not differ from control line (Figure ). In both high and low N plants, the nitrogen contents of high gdhA-expressors were significantly higher than those of control line, while there was only a slight increase in N content in the low gdhA-expressors at the harvest stage (Figure ).
Figure 14. Nitrogen concentration of control (CT) and transgenic (TG5, TG7, and TG10) lines under high and low N conditions at the harvest stage. Data represent the mean values ± SD (n = 4). Statistical analysis of the data was performed by one-way ANOVA. Asterisks indicate that the mean values of TG5, TG7, and TG10 lines are significantly different from that of CT at p < 0.05 (*) and p < 0.01 (**). The letters ‘ns’ indicate not significantly different from CT at p < 0.05.
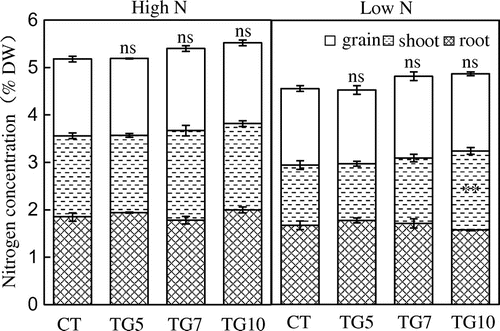
Figure15. Nitrogen contents of control (CT) and transgenic (TG5, TG7, and TG10) lines under high and low N conditions at the harvest stage. Data represent the mean values ± SD (n = 4). Statistical analysis of the data was performed by one-way ANOVA. Asterisks indicate that the mean values of TG5, TG7, and TG10 lines are significantly different from that of CT at p < 0.05 (*) and p < 0.01 (**). The letters ‘ns’ indicate not significantly different from CT at p < 0.05.
Under high N conditions, high gdhA-expressors exhibited higher panicle numbers and spikelet numbers per plant, resulting in higher grain weight compared with control line. In TG7, similar enhancement was also observed under low N conditions. In high gdhA-expressors, the nitrogen uptake efficiencies were estimated to be higher than that in control and TG5 (Table ).
Table 2. The agronomic traits and nitrogen uptake efficiency of control (CT) and transgenic lines (TG5, TG7, and TG10) under high and low N conditions.
Discussion
GDH is a family of enzymes catalyzing reversible deamination of L-glutamate to 2-OG, directly connected to the TCA cycle (Fisher, Citation1985) and thereby playing a key role in providing a link between carbon and nitrogen metabolism. GDHs are ubiquitous and present in bacteria as well as in most sub-cellular compartments of the eukaryotic cell. This enzyme family has drawn much attention because assimilation of ammonium via GDH is more energy-efficient than via GOGAT (Fd-GOGAT and NADH-GOGAT) (Helling, Citation1998; Windass et al., Citation1980). In this study, we successfully produced transgenic forage rice plants that expressed a fungal NADP(H)–GDH (gdhA) under the control of a constitutive EF1β promoter (Figure ). Introduction of gdhA led to a significant increase in the NADP(H)–GDH activity in transgenic lines, with especially the high gdhA-expressors (TG7 and TG10) showing higher activity. The amination activities in shoots and roots of transgenic plants were considerably higher than the deamination activities under both nitrogen treatment conditions (Figure ). Our results are consistent with those of several previous studies that showed high NADP(H)–GDH activities in transgenic rice or potato by the introduction of a gdh gene from fungi or bacteria (Abiko et al., Citation2010; Du et al., Citation2014; Egami et al., Citation2012; Zhou et al., Citation2014).
Introduction of an exogenous GDH gene into tobacco (Mungur et al., Citation2005) or crop plants may improve NH assimilation, raise biomass production, and enhance the absorption and utilization of nitrogen. Some transgenic crops have already been generated using a fungal NADP(H)–GDH gene, such as NiGDH of Neurospora intermedia (Wang & Tian, Citation2001) and gdhA of A. nidulans (Kisaka & Kida, Citation2003) – these transgenic plants showed high nitrogen utilization efficiency. Previously, our research group reported expression of a gdhA isolated from A. niger in transgenic food rice (‘Yamahoushi’) plants and that the shoot dry weight and nitrogen content were elevated only under high N conditions (500 μM) (Abiko et al., Citation2010). The present study using transgenic forage rice (‘Momiroman’) plants showed that the shoot dry weight and nitrogen content of high gdhA-expressors were significantly higher than control plants under both high (360 μM) and low (90 μM) nitrogen conditions at seedling stage (Figures and ). Although the different outcomes between the two studies may result from the rice cultivar used as host and/or the promoter used to drive the transgene, there are two possible explanations for this finding. First, that Abiko et al. (Citation2010) used 50 μM, but we used 90 μM as the low N condition; and, second, they used NH
as the sole nitrogen source, while we used both NO
and NH
. Some research has shown that partial NO
nutrition can improve growth and nitrogen uptake efficiency of rice (Duan et al., Citation2007; Herbert et al., Citation1999). In addition, Abiko et al. (Citation2010) observed no significant differences in root dry weight and nitrogen content between the transgenic lines and the control line, while our results showed that the root dry weight and nitrogen content of high gdhA-expressors were also significantly higher than control plants under both high and low nitrogen conditions (Figures and ). Expression of gdhA in transgenic rice plants results in direct assimilation of NH
absorbed from the roots (Abiko et al., Citation2010), and NH
metabolism can enhance by the presence of NO
(Herbert et al., Citation1999). Data shown in Figure appear to indicate that the ability for nitrogen uptake in the roots is higher in high gdhA-expressors than in control plants. Collectively, our results suggest that introduction of gdhA led to improved growth, dry weight and nitrogen content under low N conditions at the seedling stage by enhancing nitrogen uptake efficiency.
By 2009, 35% of all paddy fields in Japan had been abandoned (MAFF, Citation2011). A shift from rice to alternative crops such as soybean, barley, buckwheat, and colza has been promoted by the Japanese Government. However, many paddy fields are not suitable for upland crops owing to difficulty in draining excess water from the soil. Forage rice is an alternative that can adequately maintain productivity of paddy fields (Asada et al., Citation2013). However, paddy fields with appreciable soil salinity are a major problem for forage rice (Hammecker et al., Citation2012) and the salt tolerance of forage rice has not been reported. Some research has shown that the NH concentration in plant tissues increases under salt stress (Bourgeais-Chaillou et al., Citation1992; Lutts et al., Citation1999). NADH–GDH activity was enhanced with increased NH
concentration, alleviating the toxic effect of NH
accumulation in tissues (Zhou et al., Citation2004). Another report showed that leaf GS and GOGAT activities were not affected by NaCl (Nguyen et al., Citation2005). In the present study, the NADP(H)–GDH activity decreased with increased NaCl concentrations, but the NADP(H)–GDH activities of transgenic lines were significantly higher than control line under different NaCl treatments (Figure ). The dry weight and nitrogen content of high gdhA-expressors were significantly higher than those of control line under different salt stress conditions; and low gdhA-expressors also showed similar enhancement under 150 mM NaCl treatment (Figure and Table ). Our data indicated that transgenic plants expressing fungal gdhA significantly enhanced their tolerance to salt stress compared to control line. Overall, the transgenic lines with higher tolerance to salt stress maintained higher NADP(H)-GDH activity, which played an important role in decreasing the NH
accumulation in tissues under salt stress.
Egami et al. (Citation2012) introduced a fungal gdhA, encoding NADP(H)-GDH, from A. nidulans into potato and found that transgenic plants had enhanced photosynthetic rates, biomass production, and carbon and nitrogen contents compared with non-transgenic plants. In our study, leaf areas were markedly larger for the high gdhA-expressors than control line at the seedling stage (Figure ). At the heading stage, the photosynthetic rates were higher under high light intensity for transgenic lines than for control under high and low N conditions (Figure ). These results suggest that transgenic lines had an enhanced capability for photosynthesis. The gdhA transgenic tobacco plants grown in the field produced significantly higher grain weight than did control plants (Ameziane et al., Citation2000). Abiko et al. (Citation2010) found that the introduction of a fungal gdhA gene encoding NADP(H)-dependent GDH into rice led to better growth and yields. Zhou et al. (Citation2014) reported that grain yields of PcGDH transgenic plants underwent no apparent changes, yet the 1,000-grain weights and panicle numbers were augmented significantly compared with control plants. In most studies, yield data were obtained from field trials, but hydroponic experiments are a more effective way to reduce the influence of factors or substances other than that of nitrogen. The hydroponic experimental data from our study indicate that the high gdhA-expressors exhibited higher panicle numbers and spikelet numbers per plant, resulting in higher grain weight compared with control line under high N conditions. In TG7, similar enhancement effects were also observed under the low N conditions. In conclusion, the results suggest that the introduction of a fungal GDH gene into forage rice plants led to higher source ability, dry matter production, and grain weight by enhancing the nitrogen uptake efficiency. Therefore, gdhA introduction may be useful in improving forage rice cultivars to more effectively utilize nitrogenous fertilizers, on which current agricultural practices rely heavily. It is important to note that the impact of gdhA introduction differs according to the expression level of the foreign gene: in TG5, the low gdhA-expressor, the NADP(H)-GDH activity, nitrogen content, and nitrogen uptake efficiency were considerably lower than those observed in the two high gdhA-expressors (TG7 and TG10), although dry matter production during seedling stage and photosynthetic capacity at the heading stage were higher than control line. Further study is required concerning the relationship between the expression level of introduced gdhA and its metabolic and physiological impacts, including the effect on the GS/GOGAT cycle and nitrogen utilization.
Abbreviations
GDH, Glutamate dehydrogenase; GOGAT, Glutamate synthase; GS, Glutamine synthetase; 2-OG, 2-Oxoglutarate; RT-PCR, reverse transcription polymerase chain reaction.
Funding
This work was supported by JSPS KAKENHI [grant number 23248004].
Disclosure statement
No potential conflict of interest was reported by the authors.
Acknowledgments
We thank Takayuki Asano and Tomohiro Kurai, The University of Tokyo, for their expertise in making the construct for rice transformation.
References
- Abiko, T., Wakayama, M., Kawakami, A., Obara, M., Kisaka, H., Miwa, T., Aoki, N., & Ohsugi, R. (2010). Changes in nitrogen assimilation, metabolism, and growth in transgenic rice plants expressing a fungal NADP(H)-dependent glutamate dehydrogenase (gdhA). Planta, 232, 299–311.10.1007/s00425-010-1172-3
- Ameziane, R., Bernhard, K., & Lightfoot, D. A. (2000). Expression of the bacterial gdhA gene encoding a NADPH glutamate dehydrogenase in tobacco affects plant growth and development. Plant Soil, 221, 47–57.10.1023/A:1004794000267
- Asada, K., Nishimura, T., Kato, C., Toyota, K., & Hosomi, M. (2013). Phyto-purification of livestock-derived organic waste by forage rice under subtropical climate. Paddy and Water Environment, 11, 559–571.10.1007/s10333-012-0349-8
- Bates, B. Z., Kundzewicz, S. W., & Palutik, J. (2008). Observed and projected changes in climate as they relate to water. In I. P. C. C. Secretariat (Ed.), Climate change and water (pp. 13–31). Geneva: IPCC Secretariat.
- Bourgeais-Chaillou, P., Perez-Alfocea, F., & Guerrier, G. (1992). Comparative effects of N–sources on growth and physiological responses of soyabean exposed to NaCI–stress. Journal of Experimental Botany, 43, 1225–1233.10.1093/jxb/43.9.1225
- Bradford, M. M. (1976). A rapid and sensitive method for the quantitation of microgram quantities of protein utilizing the principle of protein-dye binding. Analytical Biochemistry, 72, 248–254.10.1016/0003-2697(76)90527-3
- Duan, Y. H., Zhang, Y. L., Ye, T., Fan, X. R., Xu, G. H., & Shen, Q. R. (2007). Responses of rice cultivars with different nitrogen use efficiency to partial nitrate nutrition. Annals of Botany, 99, 1153–1160.10.1093/aob/mcm051
- Du, C. Q., Lin, J. Z., Yang, Y. Z., Liu, H., Li, C. Y., Zhou, Y. B., Li, Y. X., Tang, D. Y., Zhao, X. Y., & Zhu, Y. H. (2014). Molecular cloning, characterization and function analysis of a GDH gene from Sclerotinia sclerotiorum in rice. Molecular Biology Reports, 41, 3683–3693.10.1007/s11033-014-3233-3
- Egami, T., Wakayama, M., Aoki, N., Sasaki, H., Kisaka, H., Miwa, T., & Ohsugi, R. (2012). The effects of introduction of a fungal glutamate dehydrogenase gene (gdhA) on the photosynthetic rates, biomass, carbon and nitrogen contents in transgenic potato. Plant Biotechnology, 29, 57–64.10.5511/plantbiotechnology.12.0127a
- Fisher, H. F. (1985). L-Glutamate dehydrogenase from bovine liver. Methods in Enzymology, 113, 16–27.10.1016/S0076-6879(85)13006-5
- Hammecker, C., Maeght, J. L., Grunberger, O., Siltacho, S., Srisruk, K. & Noble, A. (2012). Quantification and modelling of water flow in rain-fed paddy fields in NE Thailand: Evidence of soil salinization under submerged conditions by artesian groundwater. Journal of Hydrology, 456, 68–78.10.1016/j.jhydrol.2012.06.005
- Harrison, J., Brugie`re, N., Phillipson, B., Ferrario-Mery, S., Becker, T., Limami, A., & Hirel, B. (2000). Manipulating the pathway of ammonia assimilation through genetic engineering and breeding: Consequences on plant physiology and plant development. Plant Soil, 221, 81–93.10.1023/A:1004715720043
- Helling, R. B. (1998). Pathway choice in glutamate synthesis in Escherichia coli. Journal of Bacteriology, 180, 4571–4575.
- Herbert, J. K., Siddiqi, M. Y., Glass, A. D. M., & Kirk, G. J. D. (1999). Nitrate-ammonium synergism in rice. A subcellular flux analysis. Plant Physiology, 119, 1041–1045.
- Hirabayashi, H., Nemoto, H., Ando, I., Kato, H., Oota, H., Satou, H., Takeuchi, Y., Ishii, T., Maeda, H., Imbe, T., Ideta, O., Hirayama, M., Okamoto, M., Nishimura, M., Yagi, T., & Kaji, R. (2010). ‘Momiroman’, a new rice cultivar for feed use. Bulletin of the National Institute of Crop Science, 11, 31–47*.
- Kawai, K., Kaku, K., Izawa, N., Shimizu, T., Fukuda, A., & Tanaka, Y. (2007). A novel mutant acetolactate synthase gene from rice cells, which confers resistance to ALS-inhibiting herbicides. Journal of Pesticide Science, 32, 89–98.10.1584/jpestics.G06-40
- Kinghorn, J. R., & Pateman, J. A. (1973). NAD and NADP L-glutamate dehydrogenase activity and ammonium regulation in Aspergillus nidulans. Journal of General Microbiology, 78, 39–46.10.1099/00221287-78-1-39
- Kisaka, H., & Kida, T. (2003). Transgenic tomato plant carrying a gene for NADP-dependent glutamate dehydrogenase (gdhA) from Aspergillus nidulans. Plant Science, 164, 35–42.10.1016/S0168-9452(02)00325-4
- Lea, P. J., & Miflin, B. J. (1974). Alternative route for nitrogen assimilation in higher plants. Nature, 251, 614–616.10.1038/251614a0
- Lightfoot, D. A., Mungur, R., Ameziane, R., Nolte, S., Long, L., Bernhard, K., Colter, A., Jones, K., Iqbal, M. J., Varsa, E., & Yong, B. (2007). Improved drought tolerance of transgenic Zea mays plants that express the glutamate dehydrogenase gene (gdhA) of E. coli. Euphytica, 156, 103–116.10.1007/s10681-007-9357-y
- Luo, J. K., Sun, S. B., Jia, L. J., Chen, W., & Shen, Q. R. (2006). The mechanism of nitrate accumulation in pakchoi (Brassica campestris L.ssp. Chinensis (L.)). Plant Soil, 282, 291–300.10.1007/s11104-005-6094-7
- Lutts, S., Majerus, V., & Kinet, J. M. (1999). NaCl effects on proline metabolism in rice (Oryza sativa) seedlings. Plant Physiology, 105, 450–458.10.1034/j.1399-3054.1999.105309.x
- Macheda, M. L., Hynes, M. J., & Davis, M. A. (1999). The Aspergillus nidulans gltA gene encoding glutamate synthase is required for ammonium assimilation in the absence of NADP-glutamate dehydrogenase. Current Genetics, 34, 467–471.10.1007/s002940050421
- Ministry of Agriculture, Forestry and Fisheries. (2011). FY2010 Annual report on food, agriculture and rural areas in Japan, summary. Retrieved September 18, 2015, from http://www.maff.go.jp/e/annual_report/2010/pdf/e_all.pdf
- Ministry of Agriculture, Forestry and Fisheries. (2013). Shiryo wo meguru jousei. Tokyo: Author. Retrieved September 18, 2015, from http://www.maff.go.jp/j/chikusan/sinko/lin/l_siryo/pdf/siryou_data_2506.pdf**
- Miflin, B. J., & Lea, P. J. (1980). Ammonia assimilation. In B. J. Miflin (Ed.), The biochemistry of plants (vol. 5 pp. 169–202). New York, NY: Academic Press.
- Mungur, R., Glass, A. D. M., Goodenow, D. B., & Lightfoot, D. A. (2005). Metabolite fingerprinting in transgenic Nicotiana Tabacum altered by the Escherichia coli Glutamate Dehydrogenase Gene. Journal of Biomedicine and Biotechnology, 2, 198–214.10.1155/JBB.2005.198
- Murray, M. G., & Thompson, W. F. (1980). Rapid isolation of high molecular weight plant DNA. Nucleic Acids Research, 8, 4321–4325.10.1093/nar/8.19.4321
- Nguyen, H. T. T., Shim, I. S., Kobayashi, K., & Usui, K. (2005). Regulation of ammonium accumulation during salt stress in rice (Oryza sativa L.) seedlings. Plant Production Science, 8, 397–404.10.1626/pps.8.397
- Nolte, S. A., Young, B. G., Mungur, R., & Lightfoot, D. A. (2004). The glutamate dehydrogenase gene gdhA increased the resistance of tobacco to glufosinate. Weed Research, 44, 335–339.10.1111/wre.2004.44.issue-4
- Noor, S., & Punekar, N. S. (2005). Allosteric NADP-glutamate dehydrogenase from aspergilli: Purification, characterization and implications for metabolic regulation at the carbon–nitrogen interface. Microbiology, 151, 1409–1419.10.1099/mic.0.27751-0
- Sittiya, J., Yamauchi, K., & Morokuma, M. (2011). Chemical composition, digestibility of crude fiber and gross energy, and metabolizable energy of whole paddy rice of momiroman. The Journal of Poultry Science, 48, 259–261.10.2141/jpsa.011033
- Srivastava, H. S., & Singh, R. P. (1987). Role and regulation of L-glutamate dehydrogenase activity in higher plants. Phytochemistry, 26, 597–610.10.1016/S0031-9422(00)84749-4
- Toki, S., Hara, N., Ono, K., Onodera, H., Tagiri, A., Oka, S., & Tanaka, H. (2006). Early infection of scutellum tissue with Agrobacterium allows high-speed transformation of rice. The Plant Journal, 47, 969–976.10.1111/tpj.2006.47.issue-6
- Umar, S., Iqbal, M., & Abrol, Y. P. (2007). Are nitrate concentrations in leafy vegetables within safe limits? Current Science, 92, 355–360.
- Vitousek, P. M., Aber, J. D., Howarth, R. W., Likens, G. E., Matson, P. A., Schindler, D. W., Schlesinger, W. H., & Tilman, D. G. (1997). Human alteration of the global nitrogen cycle: sources and consequences. Ecological Applications, 7, 737–750.
- Wang, F., & Tian, B. (2001). Neurospora NADP glutamate dehydrogenases and its expression in E. coli and transgenic plant. Chinese Science Bulletin, 46, 137–140.
- Windass, J. D., Worsey, M. J., Pioli, E. M., Pioli, D., Barth, P. T., Atherton, K. T., Dart, E. C., Byrom, D., Powell, K., & Senior, P. J. (1980). Improved conversion of methanol to single-cell protein by Methylophilus methylotrophus. Nature, 287, 396–401.10.1038/287396a0
- Wootton, J. C. (1983). Re-assessment of ammonium-ion affinities of NADP-specific glutamate dehydrogenases. Activation of the Neurospora crassa enzyme by ammonium and rubidium ions. Biochemical Journal, 209, 527–531.10.1042/bj2090527
- Zhou, W., Sun, Q. J., Zhang, C. F., Yuan, Y. Z., Zhang, J., & Lu, B. B. (2004). Effect of salt stress on ammonium assimilation enzymes of the roots of rice (Oryza sativa) cultivars differing in salinity resistance. Acta Botanica Sinica, 46, 921–927.
- Zhou, Y. B., Liu, H., Zhou, X. C., Yan, Y. Z., Du, C. Q., Li, Y. X., Liu, D. R., Zhang, C. S., Deng, X. L., Tang, D. Y., Zhao, X. Y., Zhu, Y. H., Lin, J. Z., & Liu, X. M. (2014). Over-expression of a fungal NADP(H)-dependent glutamate dehydrogenase PcGDH improves nitrogen assimilation and growth quality in rice. Molecular Breeding, 34, 335–349.10.1007/s11032-014-0037-z