ABSTRACT
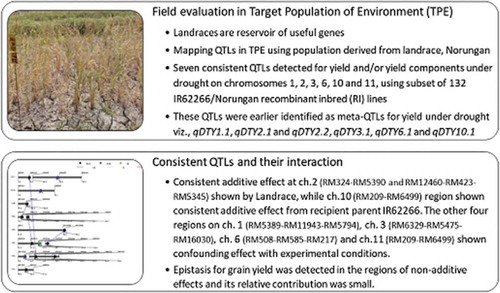
A total of 36 colocated QTLs associated with plant production traits were mapped using IR62266/Norungan recombinant inbred lines under drought and non-stress conditions in target populations of environment. Multi-model composite interval mapping and multi-environment analysis detected seven consistent QTLs for plant production traits on chromosomes 1, 2, 3, 6, 10 and 11. QTLs for plant height, number of tillers, biomass, spikelet fertility and grain yield under drought identified on chr. 1 (RM5389-RM11943-RM5794), chr. 2 (RM324-RM5390 and RM12460-RM423-RM5345), chr. 3 (RM6329-RM5475-RM16030), chr. 6 (RM508-RM585-RM217), chr. 10 (RM7361-RM8207) and chr. 11 (RM209-RM6499) in this study have been reported as meta-QTLs for yield under drought. Consistent positive allelic contribution from the landrace, Norungan was shown at the two QTLs on chr. 2, while IR62266 showed consistent positive allelic effect at the QTL on chr. 10. At other four regions the effect was confounded with the stress condition, for instance the region on chr. 3 identified for straw yield showed additive effect from Norungan in all stress trials, while in the non-stress trials the positive allele came from IR62266. Epistasis for grain yield was detected in the regions of non-additive effects and its relative contribution was small. Relatively small percentage of grain yield variation was explained by additive x environment interaction (0.28 - 1.77%), but was larger than that explained by additive effect QTL across environments (0.05 - 0.35%). These consistent QTLs may have genes evolutionarily conserved in response to drought and could be ideal candidates for rice yield improvement in water-limited environments.
GRAPHICAL ABSTRACT
Introduction
Rice (Oryza sativa L.) is a staple food crop for more than half of world’s population, cultivated over 167 million ha globally (Food Agriculture Organization (FAO), Citation2018). Rainfed lowland and upland rice occupy 31 and 12% of the global rice-growing area, respectively (Kamoshita et al., Citation2008), where yields are seriously affected by water deficit. Drought is thus the major environmental constraint to rice production and yield stability in rainfed areas. Asia is the most drought-affected region from 2003 to 2013, with 40% of total crop and livestock production losses amounting to 28 USD billion (Food Agriculture Organization, Citation2015). In Asia nearly, 46 Mha rainfed lowland and 10 Mha upland rice suffer from drought stress (Pandey et al., Citation2007). In India alone, 14.4 and 6.0 Mha of rainfed lowland and upland rice are affected by drought, respectively (Mahajan et al., Citation2017).
Drought, in general reduces the accumulation of biomass and shortens the life cycle of the plants (Blum, Citation2005) causing yield reduction ranging 13–35% (Jongdee et al., Citation2006). The recent predictions in global climate change suggest a further increase in water deficits in coming decades (Wassmann et al., Citation2009), leading to an increased frequencies and intensities of drought. It has been reported that by 2025, the irrigated wetland rice (13Mha) in Asia may experience physical water scarcity, whereas the irrigated dry-season rice (22Mha) may suffer from economic water scarcity (Tuong & Bouman, Citation2003).
Rainfed rice yields an average of 1.5 t/ha compared with 3.1 t/ha in irrigated rice (Rosegrant et al., Citation2002). Low yields, large yield gap, risk of crop failure, and insecurity of livelihoods are predominant in rainfed rice ecosystems (Hossain & Narciso, Citation2004), which in turn increases the economic vulnerability of poor rice producers in less-favored rainfed environments, where more than 30% of the population is already considered extremely poor, living on less than USD 1.90 per day (Mottaleb et al., Citation2017). The development of rice cultivars with inbuilt drought resistance is thus important in increasing productivity and yield stability as well as alleviating poverty in communities’ dependent on rainfed production (Venuprasad et al., Citation2009).
Sufficient progress in breeding for drought tolerance has been made in recent years, however, is still limiting with a lack of reliable and efficient screening techniques (Mohanty et al., Citation2016). Direct selection for yield under stress in managed stress environments (MSEs) (Babu et al., Citation2003; Venuprasad et al., Citation2007) and target populations of environment (TPEs) (Kumar et al., Citation2008) is considered promising to improve drought tolerance in rice. A TPE is the set of all environments, farms, and future seasons in which an improved variety will be grown (Fischer et al., Citation2012). However, direct selection for yield under drought in MSE and TPEs is difficult because of differences in the timing and severity of drought over seasons (Prince et al., Citation2015). Alternatively, quantitative trait loci (QTL) mapping followed by marker-assisted breeding (MAB) could be an effective approach to identify genomic regions linked to crop performance in stressful environments and pyramiding desirable alleles to improve drought resistance in crops (Ashraf, Citation2010). Large number of QTLs associated with several drought-resistance traits (Kamoshita et al., Citation2008) and yield under drought have been identified in rice, but only few have been successfully deployed in MAB till date (Sandhu & Kumar, Citation2017), due to large intervals and lack of repeatability across environments and genetic backgrounds (Bernier et al., Citation2007). Identifying large consistent effect meta-QTLs for yield and secondary traits under drought will hasten MAB for drought resistance.
India is one of the centers of diversity of rice (McNally et al., Citation2009), harboring drought-tolerant landraces adapted to local ecosystems. These landraces endowed with genes of agronomic value such as drought tolerance offer great scope in increasing genetic variability in breeding program (Vikram et al., Citation2016). Populations involving local landrace of indica ecotypes and indica accessions will results in superior indica lines with adaptation to local target rainfed environment. Novel QTLs for yield and yield components can be identified by utilizing genetic variation among indica ecotypes (Suji et al., Citation2012). Recently, fewer QTLs for drought resistance have been detected using populations derived from landraces in managed stress environments (Sandhu & Kumar, Citation2017). However, identifying consistent meta-QTLs for drought resistance using locally adapted landraces under drought stress predominant in TPE is essential (Lafitte et al., Citation2006) due to heterogeneity in soil physico-chemical properties and drought scenarios across different TPEs. Identifying consistent QTLs for drought resistance, especially using populations derived from locally adapted rice lines (Atlin et al., Citation2006) will improve the efficacy of MAB.
Previously, using same mapping population we have identified genomic regions that can be called as QTL hot spots and fine mapped one large effect QTL for yield under drought (Suji et al., Citation2012; Muthukumar et al., Citation2015). However, the average distances between marker were fairly large with several chromosome breakpoints rendering them less practical for any downstream marker trait association (Pootakham et al., Citation2015) and usually the hotspot regions undergo more recombination than the other regions (Smith, Citation1994). The utility of the linkage map information is often limited to the genetic background of the mapping population (Galeano et al., Citation2011). Further to find genes of interest and marker-assisted selection through fine mapping, map-based cloning and comparative genomics study requires good genetic map with greater genome coverage (Galeano et al., Citation2011) providing validation of marker order.
Further, the consistency of the identified genomic regions, epistasis interaction and QTL x Environment interaction under different stress are important in dissecting complex quantitative trait like drought resistance beside elucidating the contribution of single gene/QTL. The genetic architecture of a complex trait consists of the actions of genes at a single locus as well as the interlocus interactions and gene x environment interactions (Qi et al., Citation2016).
Thus, the present study was conducted with an objective of saturating the genetic linkage map and identifying consistent large-effect QTLs, to detect additive and epistatic effect QTLs and their interaction with environment for plant production traits under drought using rice lines derived from local landrace, Norungan adapted to TPE. The landrace, Norungan is traditionally grown in rainfed TPE over considerable area by subsistence farmers because of its inherent adaptation to drought and flooding. Identifying consistent QTLs for drought resistance in this landrace will help in rainfed rice improvement.
Materials and methods
Mapping population
Norungan (NG), an indica landrace well adapted to rainfed ecosystem from Tamil Nadu, India is drought resistant with its deep and thick roots with superior hardpan penetration ability (Babu et al., Citation2001) IR62266-42-6-2 (IR62266), a lowland indica ecotype, efficient in extracting water from depth due to capacity for osmotic adjustment (Babu et al., Citation1999; Siopongco et al., Citation2009) and has a thin root system (Babu et al., Citation2001). These two lines were used as parents in developing a recombinant inbred population. A subset of 132, out of the total 232 recombinant inbred (RI) lines from the cross IR62266 x Norungan was used in the present study for mapping consistent QTLs for phenology, plant production and yield traits under drought stress in TPE and non-stress environment.
Field trials
Field trials were conducted under upland conditions in experimental fields of Tamil Nadu Agricultural University, India at Agricultural Research Station, Paramakudi, India during rainfed seasons (September–January) 2013–14 (DS2013) and 2014–15 (DS2014) located in rainfed TPE. The site, soil, and drought stress characteristics, and rainfall of the experimental locations are summarized in and Supplementary Figure 1, respectively.
Table 1. Site, soil, and drought stress characteristics during cropping season of field trials conducted in rainfed target populations of environment in Paramakudi (DS2011, DS2012, DS2013, and DS2014) and managed irrigated environment in Coimbatore (NS2012), India
Drought stress experiments in TPE (DS2013, DS2014)
A subset of 143 F10 RI lines along with parents was evaluated for drought response. The rice lines were planted in plots of 2.0 × 0.4 m2 with three replications in randomized complete block design. Briefly, seeds were hand dibbled into the dry soil before monsoon with a seed rate of 80 kg ha−1. NPK fertilizers were applied at the rate of 50:25:25 kg ha−1. Insect and weed control measures were applied periodically, as required. Stress plots were completely rainfed from sowing to harvest.
The DS2013 trial received a total rainfall of 217 mm during the crop growth as against long-term average rainfall of 475 mm for this site. There was no rainfall right from emergence up to harvest and the rice lines experienced very severe drought stress. Due to very acute drought, the bore wells dried and no irrigation could be given even to save the plants. During DS2014 the rainfall was normal with total rainfall of 483 mm, evenly distributed during the cropping season and was considered normal rainfed year with no visual symptoms of drought stress.
Data on days to 50% flowering (DFF) were recorded as the number of days from emergence to flowering in 50% plants in a plot for each RI line. Data on plant height (PH), number of total (NTT) and productive tillers (NPT), panicle length (PL), and spikelet fertility (SF) (ratio of number of filled grains/total number of grains (filled + unfilled (chaff grains)) per panicle expressed as percentage and yield per plant were recorded from three randomly selected hills per RI line in each replication. All the plants in each plot were harvested at maturity and grain yield (GY) and straw yield (SY) were recorded after sun drying. Total above-ground biomass (TB) was computed by summing grain and straw yields. Harvest index (HI) was calculated as the ratio of grain weight to total above ground biomass for each RI line.
Drought score (DS) was recorded during peak stress in DS2013 trial using a scale of 0–9 based on the intensity of leaf drying, leaf rolling standardized for rice (IRRI (International Rice Research Institute), Citation1996). The soil water table depth was measured at two days’ interval using eight piezometers (15 x 100 cm) made of polyvinyl carbonate that were installed across the field in DS2014. Due to acute drought in DS2013, piezometers could not be installed in dry and hardened soil.
Statistical analysis of phenotypic data
Analysis of variance for each trait in different trials was done as mixed models using PROC MIXED procedure of SAS V. 9.4 (SAS Institute Inc, Citation1990). The broad sense heritability (H) of different traits was estimated within a year for each treatment. The required variance components for calculating heritability were obtained as explained by Fehr (Citation1987). The SAS programme PROC VARCOMP with REML method was used for broad sense heritability calculation. The linear relationship, correlation, and summary statistics for each trial were calculated using PROC CORR and PROC SUMM programme in SAS.
Genotyping
Fresh leaf samples of each RI lines and parents were collected from field-grown young seedlings and freeze-dried. DNA was extracted from the leaf tissues using cetyl trimethyl ammonium borate buffer (Gawel & Jarret, Citation1991). The quantity and quality of DNA was assessed in 0.8% agarose gel and quantified by using NanoDrop® ND-1000 Spectrophotometer. Sample concentration values in ng/µl based on absorbance at 260 nm were determined. The DNA concentration was adjusted to 50 ng/µl from the spectrophotometer absorbance values. Polymerase chain reactions (PCR) were performed in a volume of 15 µl in thermal cycler (BIO-RAD, USA and Eppendorf Master Cycler Gradient, Eppendorf, Germany). The reaction mixture contained each primer of 1 µM concentration (Sigma Aldrich, USA and Eurofins Genomics, Bangalore, India), 100 µM deoxy nucleotide, 1X Taq buffer, 0.02 U Taq polymerase (Bangalore Genei, India) and 50 ng of template DNA. After 5 min of initial denaturation at 94°C, the PCR involved 36 cycles of amplification, each cycle comprising 1 min denaturation at 94°C, 1 min annealing at 57°C, 1 min extension at 72°C, and the final extension step of 5 min at 72°C. The amplified products were separated on 3% Metaphor agarose gels and 6% PAGE (Bio-Whittaker Molecular Applications, Vallensbaek Strand, Denmark) (Sambrook & Russell, Citation2006).
Parental polymorphism and Genetic Linkage map construction
A framework genetic map comprising 114 markers was constructed previously in this laboratory using the total 232 RI lines of this mapping population (Muthukumar et al., Citation2015; Suji et al., Citation2012). In the present study, the parents, IR62266 and Norungan, were further screened using 388 additional rice microsatellite markers and 96 were found to be polymorphic between the parents. These 96 polymorphic markers were used in saturating linkage map and in genotyping the subset of 132 RI lines used in this study. The genotypic data generated with 132 RI lines were tested for χ2 goodness of fit against a 1:1 segregation ratio and was used in reconstruction of the linkage map with additional markers using their physical position in reference to rice variety, Nipponbare. The linkage map was reconstructed using Map Manager QTX software (Manly et al., Citation2001) using the Haldane mapping function. The reconstructed map covers a total length of 1408.02 cM with an average marker distance of 6.70 cM (Supplementary Figure 2).
QTL analysis
QTL analysis for five trials was carried out with the line mean of each trait using the composite interval mapping (CIM) approach in WinQTLCART v2.5 (Wang et al., Citation2005). Genome-wide significant threshold at p < 0.05 was calculated by running 1000 permutation from which logarithm of the odds ratio LOD score of ≤2.5 was observed for trait analysis. Model six was selected with control marker numbers (Cofactors) of 5 and window size of 10 cM. The forward regression method was used for selecting the control markers. QTLs were searched with walk speed of 1 cM. The additive effect and phenotypic variance explained by each QTL (R2) at maximum LOD score is reported. QTLs with LOD score of 2.5 and above are reported. The data from (DS2011, DS2012 and NS2012) Muthukumar et al. (Citation2015) was reanalyzed for QTL detection with possibility of new QTLs detection using improved genetic map.
Multi environment, epistasis and QTL interaction analysis
Multiple environment trial (MET) analysis was carried out using all five field trials data, three field trials (two drought stress (DS2011, DS2012) and one non-stress (NS2012)) from previous study (Muthukumar et al., Citation2015) and two field trials (DS2013, DS2014) from current study. Multi-model composite interval mapping (MCIM) of QTLNetwork2.1 (Yang et al., Citation2008) was performed and stable QTLs across environments were identified. Epistatic QTL and QTL interaction was performed based on methodology summarized by Yang et al. (Citation2007) following 2D genome scan and running 1000 permutations.
Results
Phenotypic variation in plant phenology and production traits
Significant variation in phenotypic response was observed among the RI lines and parents for various traits under drought stress in TPE and non-stress (irrigated) conditions. The phenotypic mean and range for various traits along with standard deviation and broad-sense heritability for the field trials are presented in . The traits observed showed a normal distribution among the lines in all the trials. Transgressive segregation was observed among RI lines over the parents for most traits (data not shown).
Table 2. Mean, range, and broad sense heritability of 132 RI lines and parents for phenology and plant production traits under field trials conducted in rainfed target populations of environment in Paramakudi (DS2013 and DS2014), India
Norungan flowered earlier than IR62266 in DS2013 and DS2014 trials. The reduced plant height and an average drought score of 4.6 in DS2013 indicated the intense drought severity as compared to DS2014. Mean grain yield across RI lines was 966 and 3964 kg ha-1 in DS2013 and DS2014, respectively. Mean grain yield under drought stress was reduced by 75% in DS2013 compared to DS2014.
Phenotypic correlation among traits
Phenotypic correlations among traits for each trial are presented in Supplementary Table 1. In all the trials, grain yield has significant positive correlations with plant height, number of total tillers and productive tillers, panicle length, spikelet fertility, straw yield, total biomass, and harvest index. Grain yield was strongly correlated with harvest index (0.70 in DS2013) and total biomass (0.71 in DS2013) under drought stress. However, grain yield was negatively correlated (−0.26) with days to 50% flowering under drought stress in DS2013.
Genetic map construction and QTLs mapped for plant production traits
To saturate the existing genetic linkage map constructed with 114 SSR markers (Muthukumar et al., Citation2015), a set of 338 SSR markers spread throughout the genome were additionally used in parental polymorphism screening in this study. Out of 388 SSR markers, 96 were polymorphic (24.8% polymorphism). Hence, a total of 210 markers, distributed over 12 chromosomes, were used in reconstruction of the linkage map in this study.
A total of 68 genomic regions were identified for various traits under drought stress and non-stress conditions. Results of CIM and putative QTLs identified under stress and non-stress conditions with peak or nearest marker(s) linked to various traits are given in . The QTLs explained phenotypic variance ranging from 6.05% to 54.66% in drought stress trials and 4.72 to 53.33% in non-stress trial across various traits measured.
Table 3. QTLs identified for phenology and production traits in IR62266/Norungan RI lines field trials conducted in rainfed target populations of environment in Paramakudi (DS2011, DS2012, DS2013, and DS2014) and irrigated non-stress environment in Coimbatore (NS2012), India
QTLs for DFF
Eleven genomic regions were identified on chromosome 2, 3, 4, 6, 9, and 11 by using CIM (). These QTLs were detected in DS trials with large phenotypic variance ranged from 7.35 to 50.67%. The large phenotypic variance (50.67%) was at RM5963 on Chromosome 6 with a positive allele from IR62266. The positive allelic effect from IR62266 was also reported at RM12460 (DS2014) on chromosome 2, RM3533 (DS2013), RM24334 (DS2014) on chromosome 9 and RM202 and RM209 (DS2011) on chromosome 11. While the allelic effect at RM3387 (DS2013) on chromosome 3, RM6314 (DS2012) on chromosome 4, RM204 (DS2011), RM8270 (DS2012), and RM225 (DS2014) on chromosome 6, came from Norungan.
QTLs for PH
Eleven genomic regions were linked to plant height on chromosome 1, 5, 6, 7, and 10 in both stress and non-stress conditions (). The phenotypic variance was ranged from 4.72 to 53.33%. The large phenotypic value (53.33% in NS2012, 51.8% in DS2014) was at RM11943 on chromosome 1 with positive allele from IR62266. Four regions, RM5389 (DS2011, DS2012), RM414 (DS21014, NS2012) RM11943 (DS2014, NS2012) on chromosome 1 and RM18828 (DS2014, NS2012) on chromosome 5 were consistent for two trials. The positive allele at peak marker RM5389, RM414, and RM18828 was coming from Norungan. The region with peak marker RM5389 was identified in drought stress while RM414 and RM18828 were identified in a non-stress environment shows they are environment responsive.
QTLs for SF
A total of 10 major effect regions (R2 > 10) were identified to be linked with spikelet fertility on Chromosome 1, 2, 6, and 7 (). Four QTL regions on chromosome 2 and 6, and one each on chromosome 1 and 7. All the four QTL regions on chromosome 2, RM5345, RM318 in DS2012 and RM3501, RM324 in DS2014 showed allelic effect from IR62266 while all the four regions on chromosome 6, RM6917, RM8270, and RM5957 in DS2014 and RM585 in DS2013 on chromosome 6 showed allelic effect from Norungan.
QTLs for GY
A total of 14 genomic regions, six in DS2011 (RM585, RM6194, RM3826, RM209, RM28089), five in DS2012 (RM9, RM4404, RM32, RM3308, RM197), two in DS2014 (RM3392, RM16030) and one each DS2013 (RM7426) and NS2012 (RM18828) were identified for grain yield. The positive allele at QTLs, RM9 on chromosome 1, RM16030 and RM4404 on chromosome 3, RM32 and RM3308 on chromosome 4, RM3826 on chromosome 7, RM209 on chromosome 11 and RM28089 on chromosome 12 with large phenotypic variance ranging from 7.05% to 25.71% came from landrace Norungan. While the yield increasing allele was contributed by IR62266 at RM7426, RM3392, RM585, and RM6194.
QTLs for HI
Eight genomic regions were linked to harvest index and mapped to chromosomes 2, 3, 6, 8, and 12. A majority of four QTLs, RM6194 (DS2011), RM5963 (DS2012), RM225 (DS2013), and RM6359 (DS2014) were on chromosome 6 while one each RM12460 (DS2014) on chromosome 2, RM4404 (DS2012) on chromosome 3, RM1345 (DS2013) on chromosome 8 and RM28089 (DS2011) on chromosome 12. The positive allele at RM4404 (DS2012) on chromosome 3, RM6359 (DS2014) on chromosome 6, and RM28089 (DS2011) on chromosome 12, was from donor parent Norungan while all other regions IR62266 has positive allelic effect.
Co-located Multi environment and additive effect QTLs across trials
Multi-environment trial (MET) analysis using multi-model composite interval mapping (MCIM) detected a total of 23 additive effect QTLs for seven traits, viz., days to 50% flowering (1), plant height (4), number of total tillers (4), number of productive tillers (2), spikelet fertility (1), grain yield (4), straw yield (3), total biomass (4) () across five seasons. The regions identified using MCIM also showed to be linked to several traits in single trial or single trait in different trials, which can be referred to as pleiotropic effect of genomic region. For instance, the region RM5389-RM5794 on chromosome 1 was identified for several traits (). The markers RM11943-RM1361-RM3520-RM414-RM5794 between co-localized region RM5389-RM5794 on chromosome 1 has been detected for additive effect QTL using MCIM for plant height, number of productive tillers, straw yield, and total biomass () showing stability of the genomic regions for plant production traits with allelic contribution from landrace except at RM11943-RM1361 for plant height.
Table 4. Additive QTLs identified for phenology and production traits in IR62266/Norungan RI lines on multiple environment basis
MCIM analysis identified RM423-RM5345 on chromosome 2 for grain yield with significant large additive effect (210.55 kg/ha-1) from donor parent but with low phenotypic variance (Ra2 = 0.29%) (). The large significant additive effect from donor parent was observed in non-stress trial (Data not shown) while in all other rainfed trial at TPE the allelic effect was from IR62266 showing environment-specific allelic expression. The loci with RM423 has showed both additive and additive x environment interaction effect (both A and AE) (). Another region, RM324-RM5390 on chromosome 2 was identified to be linked with number of total tillers with additive effect from Norungan and significant expression only in DS2011 which also shows environment specificity ().
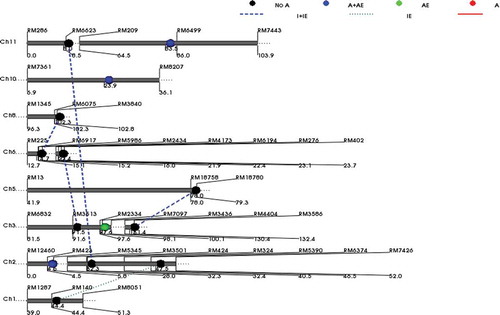
Figure 1. Epistatic interactions among QTLs for grain yield across 5 trials
The genomic region RM16030-RM4404 on Chromosome 3 is colocated for yield traits with additive effect from donor parent (). MCIM analysis also identified the distal region, RM6329-RM5475-RM16030 associated with spikelet fertility and straw yield (). The region RM6329-RM5475 linked to spikelet fertility showed an additive effect from Norungan. While the region RM5475-RM16030 linked to straw yield showed an additive effect from IR62266. Interestingly for straw yield all the drought stress trial (DS2011, DS2012, DS2013), the allelic effect is from Norungan while for non-stress (NS2012, DS2014) the allelic effect is from IR62266 (Data not shown). MCIM analysis also identified another region RM2334-RM7097 on chromosome 3 to be linked with grain yield with additive allelic effect (28%) from IR62266. The higher phenotypic variance explained by additive x environment (Rae2 = 1.56%) than that of phenotypic variance across environment (Ra2 = 0.26%) shows environment interaction at RM2334-RM7097 region ().
The region on chromosome 6 between RM585-RM217 was previously identified to be linked to grain yield under drought found to have consistent large effect (R2 31.2 to 37.9%) and hence was fine mapped to 94 kb in same TPE using these RI lines in this laboratory. In this study, one or more markers located within this QTL region are detected to be linked to days to 50% flowering, spikelet fertility, grain yield, straw yield, and harvest index under drought (). MCIM analysis identified the region RM4173-RM6194-RM276 to be linked with days to 50% flowering and number of total tillers (, Supplementary Figure 3). For flowering, the positive allele came from landrace Norungan while for number of total tillers positive allele came from IR62266.
MCIM analysis identified RM7361-RM8207-RM304 on chromosome 10 as an additive effect QTL for grain yield and total biomass with additive effect from recipient parent, IR62266. The region showed environment interaction for both the traits and explained higher additive x environment interaction variance (Rae2 = 1.77% (GY), 0.99% (TB)) than that of additive effect across environments (Ra2 = 0.35% (GY), 0.08% (TB)) (). For both the traits, IR62266 contributed positive allele in non-stress condition only while Norungan contributed positive allele for all the stress trials in TPE (Data not shown).
The region RM209-RM6499 was identified for plant height, grain yield, and total biomass using MCIM analysis (). The additive allelic contribution for grain yield was from IR62266 while Norungan contributed for plant height and total biomass. Though the phenotypic variation was small, the phenotypic variation for grain yield and total biomass explained by additive x environment interaction (Rae2 = 1.43 (GY), 1.11 (TB)) was larger than that explained by additive effect QTL across environments (Ra2 = 0.05 for both traits) showing the interaction of complex traits with environment.
Epistatic QTLs, epistatic x environment interaction
A total of 16 pairs of significant epistatic QTLs (P< 0.01) were identified by the combined analysis of the multi-environment phenotypic values of stress (DS) and non-stress (NS) trials (). The phenotypic variance explained by each QTL across environment (Raa2) was relatively smaller and ranged from 0.04 to 1.03%, than the phenotypic variation explained by each QTL x environment interaction (Raae2) ranged from 0.08 to 2.00% indicating importance of QTL x environment interaction for drought tolerance.
Table 5. Epistasis QTLs identified for phenology and production traits in IR62266/Norungan RI lines on multiple environment basis
2D genome scan revealed epistatic interaction of different plant production traits. The peak marker RM4472 positioned at 88.6 cM on chromosome 2 has epistatic (I) and epistatic x environment effect (IE) interaction with the RM5957 on chromosome 6 positioned at 90.8 cM for days to 50% flowering (Supplementary Figure 3).
Similarly, significant epistatic interaction was observed for plant height (Supplementary Figure 4). The peak marker RM11943 on chromosome 1 (140 cM) has both additive and additive x environment interaction effect (both A and AE) and has an epistasis x environment interaction effect (IE) with region on chromosome 11 (77.5 cM). Another peak marker RM10916 on chromosome 1 positioned at 55.7 cM has epistatic x environment interaction effect (IE) with region near to RM5746on chromosome 12 (18.2 cM), while only epistatic main effect (I) with other region between RM28048 and RM28076 positioned at50.6 cM on same chromosome 12 (Supplementary Figure 4).
We also observed positive interaction between major consistent QTLs (). A total of five pairs of epistatic QTLs were detected for grain yield, among them only four pairs of epistatic QTLs showed significant aa interaction (P< 0.01). The additive epistatic effect was from donor parent, landrace Norungan at one epistatic QTL interaction locus while at other three locus effect was from recipient parent, IR62266 (). The donor parent epistatic locus, RM424-RM324 on chromosome 2 positioned at 32.3 cM has both epistatic (I) and epistatic x environment interaction effect (IE) with region RM286-RM6623 on chromosome 11 (8 cM). Similarly, two epistatic QTLs on chromosome 3, RM6832-RM3513 positioned at 91.5 cM and RM4404-RM3586 positioned at 131 cM also has both epistatic (I) and epistatic x environment interaction effect (IE) with region RM6194-RM276 on chromosome 6 (22.4 cM) and RM18758-RM18780 on chromosome 5 (78 cM), respectively. Another epistatic QTL region RM225-RM6917 on chromosome 6 (14.7 cM) has both epistatic (I) and epistatic x environment interaction effect (IE) with region RM6075-RM3840 on chromosome 8 (102 cM). The region on chromosome 1 positioned at 44.4 cM have epistatic x environment interaction effect (IE) with region on chromosome 2 positioned at 47.5 cM (). The epistatic locus where positive allele came from donor Norungan showed lower aae (epistasis x environment effect) phenotypic variation compared to aa (epistasis effect) phenotypic variation and it was reverse for locus where positive allele came from IR62266. The locus where positive allele came from IR62266 has greater phenotypic variance explained by epistasis x environment than that of explained by epistasis across environment indicating epistatic effects were affected by environment ().
Discussion
The expression of genetic variability for drought-tolerance traits requires a mapping population to be exposed to natural drought stress predominant in TPE (Muthukumar et al., Citation2015). Identifying major and consistent QTLs for drought tolerance using populations derived from locally adapted rice lines under drought predominant in TPE and the use of those QTLs in marker-assisted breeding could be an effective strategy.
Variation for phenology and plant production traits
In this study, the landrace, Norungan, was used as a donor to identify consistent large-effect QTLs for plant production traits under drought stress in TPE. The drought tolerant donor performed better compared to IR62266 in terms of grain yield in all the trials indicating spill over effect of elite line suggesting potential yield as a strong determinant of yield even under stress. DS2013 considered as a severe drought year with the 75% mean yield reduction in DS2013 compared to DS2014 which received normal and evenly distributed rainfall with no visible symptoms of drought in the rice lines.
The landrace, Norungan flowered earlier than IR62266 in severe drought stress trial DS2013. Rice is very sensitive to drought especially during reproductive stage. Early flowering is a drought escape mechanism generally noticed in rice landraces (Ghimire et al., Citation2012) and drought tolerant donors.
Genetic map reconstruction
The low level of polymorphism (24.8%) despite a relatively large number of SSR markers (210) used, resulted in poor genome coverage and large gaps in the linkage map. This low polymorphism is due to the fact that both parents are indica ecotypes. Low level of polymorphism had already been noticed between the parents in intra-sub-specific (Ali et al., Citation2000) and even in inter-sub-specific crosses of rice (McCouch et al., Citation1988).
The discontinuity in linkage groups was reduced with saturation of linkage map and resulted in continuous linkage group, thus helped to reduce unlinked markers and improve the resolution of the linkage map and validating marker order.
Consistent QTLs for plant production traits
For MAB to be effective, it is desirable to identify consistent large effect QTLs for plant production traits across seasons and environments. The region RM5389-RM5794 on chromosome 1 consistently identified for plant production traits. The region including marker RM5389, RM11943, and RM5794, on ch.1 is a QTL hotspot for tolerance against different abiotic stresses in rice (Kamoshita et al., Citation2008; Vikram et al., Citation2011). This region is also consistently associated with yield under drought (qDTY1.1) in different populations of rice (Ghimire et al., Citation2012; Prince et al., Citation2015; Rajurkar et al., Citation2019; Venuprasad et al., Citation2012; Vikram et al., Citation2011). Meta-QTLs (MQTL1.3, MQTL1.4) for yield under drought have been mapped in this region (Swamy et al., Citation2011) and drought responsive genes underlying this genomic region have been identified using rice lines derived from drought tolerant landrace, Dhagaddeshi and drought susceptible IR20 (Borah et al., Citation2017).
The region RM423-RM5345 on chromosome 2 identified using MCIM analysis with large significant additive effect from donor parent for grain yield. The marker RM12460 just above to this region was also identified for HI and DFF in DS2014. This region RM12460-RM423-RM5345 on chromosome 2 was reported for grain yield under drought (qDTY2.2) from drought tolerant Aday sel previously (Swamy et al., Citation2013). High and consistent additive effect of qDTY2.2 under severe lowland drought stress and aerobic conditions on GY was reported by Dixit et al. (Citation2012). This region (qDTY2.2) was consistently linked to grain yield under drought (Shamsudin et al., Citation2016). The qDTY2.2 region has been reported previously to have an effect on other drought-related traits apart from GY, including drought tolerance index, canopy temperature, osmotic adjustment, and leaf water content (Robin et al., Citation2003; Yue et al., Citation2005). Similarly, QTLs for root traits viz. root length (MacMillan et al., Citation2006) and root thickness (Champoux et al., Citation1995) have been reported within and near to qDTY2.2 region, respectively. Colocation of QTLs for yield and secondary traits suggests importance of this region in rice yield improvement under drought (Swamy et al., Citation2013).
Another region RM324-RM5390 on chromosome 2 identified to be linked with number of total tillers with additive effect from Norungan with significant expression only in moderate stress showing environment specificity. The marker RM324 was also identified for spikelet fertility with separate year QTL analysis in DS2014. The distal marker RM7426 to region RM324-RM5390 was identified for grain yield, straw yield, and biomass in DS2013. Using separate year analysis, for all the traits, at marker RM324 and RM7426 allelic contribution came from IR62266. The region RM324-RM7426 on chromosome 2 was earlier reported as one of the major QTLs (qDTY2.1) for drought tolerance under lowland and upland environments using Apo and Swarna recombinant lines (Venuprasad et al., Citation2009). Venuprasad et al. (Citation2009) also reported allelic effect of both the parents in stress and non-stress condition indicating requirement of opposite alleles to optimize performance under stress and non-stress condition. Further, Dixit et al. (Citation2012) fine mapped qDTY2.1 region to 1.6 cM and showed segments of donor and recipient parents are present in the qDTY2.1 region with differential expression under varying level of stress condition. The study by Dixit et al. (Citation2012) also showed varying additive effect under moderate and severe stress at qDTY2.1 with peak marker RM324, showing environment specificity of this region with peak marker RM324. The different allelic effect also indicates different physiological mechanism, such as high osmotic adjustment from IR62266 with response to severity of stress, conferring effect on yield and biomass.
The region RM6329-RM5475-RM16030 on chromosome 3 was identified for spikelet fertility and straw yield while another region RM2334-RM7097 was identified for grain yield using MCIM analysis. The regions, RM6329-RM5475 for spikelet fertility and RM5475-RM16030 for straw yield and RM2334-RM7097 for grain yield showed shifting allelic effect from either of parent under drought stress and non-stress. The shifting allelic effect from parent suggest the plasticity of genomic region to environment and their adaptation to respective environment. CIM analysis also reported, distal region RM16030-RM4404 on Chromosome 3 colocated for yield traits with additive effect from donor parent. The consistent region with RM16030 for GY was earlier identified as qDTY3.1 with large effect (R2 = 31%) on yield in both lowland drought and aerobic environments and reported shifting allelic effect from drought tolerant Apo and high yielding Swarna under stress and non-stress condition, respectively (Venuprasad et al., Citation2009). Swamy et al. (Citation2011) reported meta QTL (MQTL3) with large effect (R2 = 20%) on grain yield in this region. Shamsudin et al. (Citation2016) pyramided qDTY2.1 and qDTY3.1 into elite Malaysian cultivars MR219 and MRQ74 using MAB and reported yield advantage under drought in MAB derived lines.
One or more markers located within previously fine mapped region RM585-RM217 on chromosome 6 were reported to be linked to several traits in this study. MCIM analysis also identified the region RM4173-RM6194-RM276 to be linked with days to 50% flowering and number of total tillers. The markers, RM6194 and RM4173 were also found to be colocated for yield and plant production traits using CIM. Interestingly, allelic effect for days to 50% flowering came from donor parent Norungan while all other plant production traits and grain yield the allelic effect is from IR62266. The allelic effect from IR62266 at RM4173 for number of total tillers complements each other in both, CIM and MCIM analysis. The positive allelic effect for flowering shows drought escape mechanism which is also evidenced from early flowering in Norungan than IR62266 in both rainfed trials. While the allelic effect from IR62266 for grain yield, harvest index, plant height, number of total tillers and number of productive tillers shows drought adaptation with higher osmotic adjustment in IR62266. Selectively combining early flowering, drought adaptation traits and high yield potential through molecular breeding may help increase rice production under water limited environment.
The region on chromosome 10 between RM7361-RM8207-RM304 identified for grain yield and total biomass as additive effect QTL using MCIM analysis. This region was reported for grain yield under drought (qDTY10.1) in earlier study (Swamy et al., Citation2013; Vikram et al., Citation2011) and also reported to be a meta QTL for yield under drought (MQTL10.1) (Swamy et al., Citation2011). The additive effect for grain yield and biomass is from recipient parent, IR62266. Recipient parent, IR62266 showed an allelic effect in non-stress trial while all rainfed trials in TPE the additive effect is from Norungan, which suggest environment specificity and allelic plasticity of this region. Allelic plasticity in terms of qDTY10.1 is reported earlier, the recipient parent (MTU1010) contributing allele in stress and non-stress condition (Vikram et al., Citation2011) while allelic effect from donor parent (Aday sel) in stress condition (Swamy et al., Citation2013). The marker RM7361 was linked to plant height and number of productive tillers in DS2014 using CIM analysis and allelic effect was from Norungan, confirming the environment specificity and allele plasticity of the region for plant production traits.
MCIM analysis identified the region RM209-RM6499 on chromosome 11 colocated for plant height, grain yield, and total biomass. The allelic effect for grain yield was from IR62266 while for plant height and biomass allelic contribution was from Norungan. CIM analysis also identified RM209 to be colocated with 50% flowering, grain yield, straw yield, and biomass. The allelic effect at RM209 for grain yield in DS2011 was from donor parent using CIM analysis, MCIM analysis complements the allelic effect from donor parent, Norungan for grain yield and total biomass in all rainfed trials in TPE, suggesting environment-specific allelic contribution of the region. The region with marker RM209 on chromosome 11 was earlier reported as a QTL region affecting grain yield under drought stress by affecting net photosynthetic rate, stomatal conductance, transpiration rate (Zhao et al., Citation2008). The consistency of RM209 for plant production traits with positive allele contribution from drought tolerant Norungan in rainfed environment and its association with photosynthetic traits shows the significance of this region in drought adaptation in rainfed rice.
The region on chromosome 12 with marker RM28089 colocated for grain yield and harvest index in DS2011 with positive allele contribution from donor, drought tolerant parent, Norungan. The marker RM28089 was also reported for a major drought grain yield QTL on chromosome 12, (qDTY12.1), with positive allele for qDTY12.1 contribution by the tolerant parent IR74371-46-1-1. (Bernier et al., Citation2007).
Additive and epistatic QTLs, and environment interaction
The higher phenotypic variation explained by QTL x environment interaction indicated QEI as an important component of drought tolerance. The phenotypic variance explained was 0.04–1.03%, while variance explained by QTL x environment interaction was 0.08–2.00%. Similar low phenotypic variance was observed for yield-related traits under low temperature in rice (Yang et al., Citation2017). In the present study, the phenotypic variance of epistatic QTLs (Raa2) ranged from 0.04% to 1.03% while phenotypic variance of additive QTLs (Ra2) ranged from 0.05% to 2.50%. The relative lower phenotypic variance of epistatic QTLs than that of the additive QTLs indicate the minor role of epistasis in plant traits, similar minor role of epistasis was reported in rice yield traits under low temperature (Yang et al., Citation2017).
Epistasis for grain yield was detected in the regions of non-additive effects and its relative contribution was small. Relative small percentage of grain yield variation was explained by additive x environment interaction (Rae2 = 0.28–1.77%), but it was larger than that explained by additive effect QTL across environments (Ra2 = 0.05–0.35%) showing environment interaction with complex trait like grain yield. Epistatic interaction for traits related to drought tolerance and major grain yield QTLs under drought was observed previously (Sandhu et al., Citation2014). The lower Rae2 (0.28%) or Raae2 (0.27%) compared to Ra2 (0.29%) or Raa2 (0.34%) at region RM423-RM5345 and RM424-RM324, respectively, which linked with grain yield on chromosome 2, and where donor drought tolerant parent Norungan contributed positive allele, suggest donor parent adaptation to environment with lower phenotypic variance explained by additive/epistasis x environment interaction. The interaction between different traits and non-additive QTLs could be useful in improvement of more than one trait simultaneously and will help genomic dissection of complex traits.
Conclusion
Six genomic regions linked to plant production traits under drought in TPE and non-stress conditions have been detected with combined analysis using rice lines derived from locally adapted landrace in this study. The region RM5389-RM5794 on chromosome 1 linked with straw yield and total biomass seemed to be a QTL hotspot colocated with plant height, and number of productive tillers. The region RM423-RM5345 on chromosome 2, linked to grain yield with positive allele from landrace Norungan. Similarly, RM6329-RM5475-RM16030 on chromosome 3 linked with spikelet fertility and straw yield harbors MQTLs (MQTL3) for grain yield. The region on chromosome 6, PSM202-RM508 linked with total biomass. QTLs for several secondary traits under drought have been reported earlier at this genomic region in rice. The region RM7361-RM8207 on chromosome 10 associated with yield and colocated with plant height, number of productive tillers. Further, this QTL region was identified as yield QTL (qDTY10.1) in rice. The region RM209-RM6499 on chromosome 11 was also associated with yield and affect yield through their linkages with DFF, number of productive tillers, and biomass. These six regions identified using combined analysis are earlier identified as yield QTLs under drought and their detection using this unique mapping population derived from locally adapted landrace further validates these QTLs. These QTLs may be robust candidates for yield improvement in rice under water-limited environments through map-based cloning of underlying genes and MAB strategies.
PPS2020_006RP-File005.doc
Download MS Word (1.1 MB)PPS2020_006RP-File004.doc
Download MS Word (57 KB)Acknowledgments
The research was supported by Department of Biotechnology (DBT), Government of India, New Delhi and Monsanto’s Beachell Borlaug International Scholars Program. The funding agencies have no role in experimental design, data collection, analysis and interpretation and in the writing of the manuscript; and the decision to submit the manuscript for publication. The comments and suggestions by two anonymous reviewers and editor are thankfully acknowledged.
Disclosure statement
The authors declare that they have no conflict of interest.
Supplementary materials
Supplemental data for this article can be accessed here.
References
- Ali, M. L., Pathan, M. S., Zhang, J., Bai, G., Sarkarung, S., & Nguyen, H. T. (2000). Mapping QTLs for root traits in a recombinant inbred population from two indica ecotypes in rice. Theoretical and Applied Genetics, 101(5), 756–766. https://doi.org/10.1007/s001220051541
- Ashraf, M. (2010). Inducing drought tolerance in plants. Recent advances. Biotechnology Advances, 28(1), 169–183. https://doi.org/10.1016/j.biotechadv.2009.11.005
- Atlin, G. N., Lafitte, H. R., Tao, D., Laza, M., Amante, M., & Courtois, B. (2006). Developing rice cultivars for high-fertility upland systems in the Asian tropics. Field Crops Research, 97(1), 43–52. https://doi.org/10.1016/j.fcr.2005.08.014
- Babu, R. C., Nguyen, B. D., Chamarerk, V., Shanmugasundaram, P., Chezhian, P., Jeyaprakash, P., … Wade, L. J. (2003). Genetic analysis of drought resistance in rice by molecular markers. Crop Science, 43(4), 1457–1469. https://doi.org/10.2135/cropsci2003.1457
- Babu, R. C., Pathan, M. S., Blum, A., & Nguyen, H. T. (1999). Comparison of measurement methods of osmotic adjustment in rice cultivars. Crop Science, 39(1), 150–158. https://doi.org/10.2135/cropsci1999.0011183X003900010024x
- Babu, R. C., Shashidhar, H. E., Lilley, J. M., Thanh, N. D., Ray, J. D., Sadasivam, S., … Nguyen, H. T. (2001). Variation in root penetration ability, osmotic adjustment and dehydration tolerance among accessions of rice adapted to rainfed lowland and upland ecosystems. Plant Breeding, 120(3), 233–238. https://doi.org/10.1046/j.1439-0523.2001.00578.x
- Bernier, J., Kumar, A., Ramaiah, V., Spaner, D., & Atlin, G. (2007). A large-effect QTL for grain yield under reproductive-stage drought stress in upland rice. Crop Science, 47(2), 507–516. https://doi.org/10.2135/cropsci2006.07.0495
- Blum, A. (2005). Drought resistance, water-use efficiency, and yield potential—are they compatible, dissonant, or mutually exclusive? Crop & Pasture Science, 56(11), 1159–1168. https://doi.org/10.1071/AR05069
- Borah, P., Sharma, E., Kaur, A., Chandel, G., Mohapatra, T., Kapoor, S., & Khurana, J. P. (2017). Analysis of drought-responsive signalling network in two contrasting rice cultivars using transcriptome-based approach. Scientific Reports, 7, 42131. https://doi.org/10.1038/srep42131
- Champoux, M. C., Wang, G., Sarkarung, S., Mackill, D. J., O’Toole, J. C., Huang, N., & McCouch, S. R. (1995). Locating genes associated with root morphology and drought avoidance in rice via linkage to molecular markers. Theoretical and Applied Genetics, 90(7–8), 969–981. https://doi.org/10.1007/BF00222910
- Dixit, S., Swamy, B. M., Vikram, P., Ahmed, H. U., Cruz, M. S., Amante, M., … Kumar, A. (2012). Fine mapping of QTLs for rice grain yield under drought reveals sub-QTLs conferring a response to variable drought severities. Theoretical and Applied Genetics, 125(1), 155–169. https://doi.org/10.1007/s00122-012-1823-9
- Fehr, W. R. (1987). Principles of cultivar development. Volume 1. Theory and technique. Macmillan publishing company.
- Fischer, K. S., Fukai, S., Kumar, A., Leung, H., & Jongdee, B. (2012). Field phenotyping strategies and breeding for adaptation of rice to drought. Frontiers in Physiology, 3, 282. https://doi.org/10.3389/fphys.2012.00282
- Food Agriculture Organization. (2015). The impact of natural hazards and disasters on agriculture and food and nutrition security: A call for action to build resilient livelihoods. FAO.
- Food Agriculture Organization (FAO) (2018). Rice market monitor. http://www.fao.org/economic/est/publications/rice-publications/rice-market-monitor/RMM-April18.I9243EN/i9243en.pdf
- Galeano, C. H., Fernandez, A. C., Franco-Herrera, N., Cichy, K. A., McClean, P. E., Vanderleyden, J., & Blair, M. W. (2011). Saturation of an intra-gene pool linkage map: Towards a unified consensus linkage map for fine mapping and synteny analysis in common bean. PLoS One, 6(12), e28135. https://doi.org/10.1371/journal.pone.0028135
- Gawel, N. J., & Jarret, R. L. (1991). A modified CTAB DNA extraction procedure for Musa and Ipomoea. Plant Molecular Biology Reporter, 9(3), 262–266. https://doi.org/10.1007/BF02672076
- Ghimire, K. H., Quiatchon, L. A., Vikram, P., Swamy, B. M., Dixit, S., Ahmed, H., … Kumar, A. (2012). Identification and mapping of a QTL (qDTY 1.1) with a consistent effect on grain yield under drought. Field Crops Research, 131, 88–96. https://doi.org/10.1016/j.fcr.2012.02.028
- Hossain, M., & Narciso, J. (2004). Global rice economy: Long-term perspectives. In FAO rice conference (Vol. 4). Rome, Italy, 12–13.
- IRRI (International Rice Research Institute). (1996). Standard evaluation system for rice. IRRI.
- Jongdee, B., Pantuwan, G., Fukai, S., & Fischer, K. (2006). Improving drought tolerance in rainfed lowland rice: An example from Thailand. Agricultural Water Management, 80(1), 225–240. https://doi.org/10.1016/j.agwat.2005.07.015
- Kamoshita, A., Babu, R. C., Boopathi, N. M., & Fukai, S. (2008). Phenotypic and genotypic analysis of drought-resistance traits for development of rice cultivars adapted to rainfed environments. Field Crops Research, 109(1), 1–23. https://doi.org/10.1016/j.fcr.2008.06.010
- Kumar, A., Bernier, J., Verulkar, S., Lafitte, H. R., & Atlin, G. N. (2008). Breeding for drought tolerance: Direct selection for yield, response to selection and use of drought-tolerant donors in upland and lowland-adapted populations. Field Crops Research, 107(3), 221–231. https://doi.org/10.1016/j.fcr.2008.02.007
- Lafitte, H. R., Li, Z. K., Vijayakumar, C. H. M., Gao, Y. M., Shi, Y., Xu, J. L., … Maghirang, R. (2006). Improvement of rice drought tolerance through backcross breeding: Evaluation of donors and selection in drought nurseries. Field Crops Research, 97(1), 77–86. https://doi.org/10.1016/j.fcr.2005.08.017
- MacMillan, K., Emrich, K., Piepho, H. P., Mullins, C. E., & Price, A. H. (2006). Assessing the importance of genotype × environment interaction for root traits in rice using a mapping population II: Conventional QTL analysis. Theoretical and Applied Genetics, 113(5), 953–964. https://doi.org/10.1007/s00122-006-0357-4
- Mahajan, G., Kumar, V., & Chauhan, B. S. (2017). Rice production in India. In Rice production worldwide (pp. 53–91). Springer, Cham.
- Manly, K. F., Cudmore, R. H., Jr, & Meer, J. M. (2001). Map Manager QTX, cross-platform software for genetic mapping. Mammalian Genome, 12(12), 930–932. https://doi.org/10.1007/s00335-001-1016-3
- McCouch, S. R., Kochert, G., Yu, Z. H., Wang, Z. Y., Khush, G. S., Coffman, W. R., & Tanksley, S. D. (1988). Molecular mapping of rice chromosomes. Theoretical and Applied Genetics, 76(6), 815–829. https://doi.org/10.1007/BF00273666
- McNally, K. L., Childs, K. L., Bohnert, R., Davidson, R. M., Zhao, K., Ulat, V. J., … Stokowski, R. (2009). Genomewide SNP variation reveals relationships among landraces and modern varieties of rice. Proceedings of the National Academy of Sciences, 106(30), 12273–12278. https://doi.org/10.1073/pnas.0900992106
- Mohanty, B., Kitazumi, A., Cheung, C. M., Lakshmanan, M., Benildo, G., Jang, I. C., & Lee, D. Y. (2016). Identification of candidate network hubs involved in metabolic adjustments of rice under drought stress by integrating transcriptome data and genome-scale metabolic network. Plant Science, 242, 224–239. https://doi.org/10.1016/j.plantsci.2015.09.018
- Mottaleb, K. A., Rejesus, R. M., Murty, M. V. R., Mohanty, S., & Li, T. (2017). Benefits of the development and dissemination of climate-smart rice: Ex ante impact assessment of drought-tolerant rice in South Asia. In Mitigation and adaptation strategies for global change, 22(6), 876–901.
- Muthukumar, C., Vivek, V. D., Poornima, R., Kavitha, S., Gayathri, V., & Babu, R. C. (2015). Fine mapping of consistent quantitative trait loci for yield under drought stress using rice (Oryza sativa) recombinant inbred lines adapted to rainfed environment. Current Science, 109(5), 910.https://doi.org/10.18520/cs/v109/i5/910-917
- Pandey, S., Bhandari, H., Ding, S., Prapertchob, P., Sharan, R., Naik, D., … Sastri, A. (2007). Coping with drought in rice farming in Asia: Insights from a cross‐country comparative study. Agricultural Economics, 37(s1), 213–224. https://doi.org/10.1111/j.1574-0862.2007.00246.x
- Pootakham, W., Ruang-Areerate, P., Jomchai, N., Sonthirod, C., Sangsrakru, D., Yoocha, T., … Tangphatsornruang, S. (2015). Construction of a high-density integrated genetic linkage map of rubber tree (Hevea brasiliensis) using genotyping-by-sequencing (GBS). Frontiers in Plant Science, 6, 367. https://doi.org/10.3389/fpls.2015.00367
- Prince, S. J., Beena, R., Gomez, S. M., Senthivel, S., & Babu, R. C. (2015). Mapping consistent rice (Oryza sativa L.) yield QTLs under drought stress in target rainfed environments. Rice, 8(1), 25. https://doi.org/10.1186/s12284-015-0053-6
- Qi, Z., Pan, J., Han, X., Qi, H., Xin, D., Li, W., … Hu, Z. (2016). Identification of major QTLs and epistatic interactions for seed protein concentration in soybean under multiple environments based on a high-density map. Molecular Breeding, 36(5), 55. https://doi.org/10.1007/s11032-016-0475-x
- Rajurkar, A. B., Muthukumar, C., Bharathi, A., Thomas, H. B., & Babu, R. C. (2019). Saturation mapping of consistent QTLs for yield and days to flowering under drought using locally adapted landrace in rice (Oryza sativa L.). NJAS-Wageningen Journal of Life Sciences, 88, 66–75. https://doi.org/10.1016/j.njas.2018.10.002
- Robin, S., Pathan, M. S., Courtois, B., Lafitte, R., Carandang, S., Lanceras, S., … Li, Z. (2003). Mapping osmotic adjustment in an advanced back-cross inbred population of rice. Theoretical and Applied Genetics, 107(7), 1288–1296. https://doi.org/10.1007/s00122-003-1360-7
- Rosegrant, M., Cai, X., Cline, S., & Nakagawa, N. (2002). The role of rainfed agriculture in the future of global food production. Environment and production technology division discussion paper. 90, Int. Food Policy Res. Inst., Washington, D. C.
- Sambrook, J., & Russell, D. W. (2006). Alkaline agarose gel electrophoresis. J Sambrook, DW Russell (Eds.), Molecular cloning: a laboratory manual (3rd ed), Cold Spring Harbor, New York (2001), pp. 5.36–5.39.
- Sandhu, N., & Kumar, A. (2017). Bridging the rice yield gaps under drought: QTLs, genes, and their use in breeding programs. Agronomy, 7(2), 27. https://doi.org/10.3390/agronomy7020027
- Sandhu, N., Singh, A., Dixit, S., Cruz, M. T. S., Maturan, P. C., Jain, R. K., & Kumar, A. (2014). Identification and mapping of stable QTL with main and epistasis effect on rice grain yield under upland drought stress. BMC Genetics, 15(1), 63. https://doi.org/10.1186/1471-2156-15-63
- SAS Institute Inc. (1990). SAS user’s guide 1990. Version 6.
- Shamsudin, N. A., Swamy, B. P., Ratnam, W., Sta Cruz, M. T., Sandhu, N., Raman, A. K., & Kumar, A. (2016). Pyramiding of drought yield QTLs into a high quality Malaysian rice cultivar MRQ74 improves yield under reproductive stage drought. Rice (N Y), 9(1), 21. https://doi.org/10.1186/s12284-016-0093-6
- Siopongco, J. D., Sekiya, K., Yamauchi, A., Egdane, J., Ismail, A. M., & Wade, L. J. (2009). Stomatal responses in rainfed lowland rice to partial soil drying; comparison of two lines. Plant Production Science, 12(1), 17–28. https://doi.org/10.1626/pps.12.17
- Smith, G. R. (1994). Hotspots of homologous recombination. Experientia, 50(3), 234–241. https://doi.org/10.1007/BF01924006
- Suji, K. K., Biji, K. R., Poornima, R., Prince, K. S. J., Amudha, K., Kavitha, S., … Babu, R. C. (2012). Mapping QTLs for plant phenology and production traits using indica rice (Oryza sativa L.) lines adapted to rainfed environment. Molecular Biotechnology, 52(2), 151–160. https://doi.org/10.1007/s12033-011-9482-7
- Swamy, B. M., Vikram, P., Dixit, S., Ahmed, H. U., & Kumar, A. (2011). Meta-analysis of grain yield QTL identified during agricultural drought in grasses showed consensus. BMC Genomics, 12(1), 319. https://doi.org/10.1186/1471-2164-12-319
- Swamy, B. P. M., Ahmed, H. U., Henry, A., Mauleon, R., Dixit, S., Vikram, P., ... & Kumar, A. (2013). Genetic, physiological, and gene expression analyses reveal that multiple qtl enhance yield of rice mega-variety IR64 under drought. Plos One, 8(5), e62795. https://doi.org/10.1371/journal.pone.0062795
- Tuong, T. P., & Bouman, B. A. M. (2003). Rice production in water scarce environments. In J. W. Kijne, R. Barker, & D. Molden (Eds.), Water productivity in agriculture: Limits and opportunities for improvements (pp. 53–67). CABI Publishing.
- Venuprasad, R., Bool, M. E., Quiatchon, L., Cruz, M. S., Amante, M., & Atlin, G. N. (2012). A large-effect QTL for rice grain yield under upland drought stress on chromosome 1. Molecular Breeding, 30(1), 535–547. https://doi.org/10.1007/s11032-011-9642-2
- Venuprasad, R., Dalid, C. O., Del Valle, M., Zhao, D., Espiritu, M., Cruz, M. T., ... & Atlin, G. N. (2009). Identification and characterization of large-effect quantitative trait loci for grain yield under lowland drought stress in rice using bulk-segregant analysis. Theoretical and Applied Genetics, 120(1), 177–190. https://doi.org/10.1007/s00122-009-1168-1
- Venuprasad, R., Lafitte, H. R., & Atlin, G. N. (2007). Response to direct selection for grain yield under drought stress in rice. Crop Science, 47(1), 285–293. https://doi.org/10.2135/cropsci2006.03.0181
- Vikram, P., Kadam, S., Singh, B. P., Pal, J. K., Singh, S., Singh, O. N., … Singh, N. K. (2016). Genetic diversity analysis reveals importance of green revolution gene (Sd1 Locus) for drought tolerance in rice. Agricultural Research, 5(1), 1–12. https://doi.org/10.1007/s40003-015-0199-x
- Vikram, P., Swamy, B. M., Dixit, S., Ahmed, H. U., Cruz, M. T. S., Singh, A. K., & Kumar, A. (2011). qDTY 1.1, a major QTL for rice grain yield under reproductive-stage drought stress with a consistent effect in multiple elite genetic backgrounds. BMC Genetics, 12(1), 89. https://doi.org/10.1186/1471-2156-12-89
- Wang, S., Basten, C. J., & Zeng, Z. B. (2005). Windows QTL cartographer version 2.5. Statistical genetics. North Carolina State University.
- Wassmann, R., Jagadish, S. V. K., Heuer, S., Ismail, A., Redona, E., Serraj, R., … Sumfleth, K. (2009). Climate change affecting rice production: The physiological and agronomic basis for possible adaptation strategies. Advances in Agronomy, 101, 59–122. https://doi.org/10.1016/S0065-2113(08)00802-X
- Yang, J., Hu, C., Hu, H., Yu, R., Xia, Z., Ye, X., & Zhu, J. (2008). QTLNetwork: Mapping and visualizing genetic architecture of complex traits in experimental populations. Bioinformatics, 24(5), 721–723. https://doi.org/10.1093/bioinformatics/btm494
- Yang, J., Zhu, J., & Williams, R. W. (2007). Mapping the genetic architecture of complex traits in experimental populations. Bioinformatics, 23(12), 1527–1536. https://doi.org/10.1093/bioinformatics/btm143
- Yang, L. M., Zhao, H. W., Wang, J. G., Liu, H. L., Sun, J., Guo, L. Y., & Zou, D. T. (2017). Genomic dissection of rice yield traits under low temperature across multi-environments. Euphytica, 213(7), 134. https://doi.org/10.1007/s10681-017-1918-0
- Yue, B., Xiong, L., Xue, W., Xing, Y., Luo, L., & Xu, C. (2005). Genetic analysis for drought resistance of rice at reproductive stage in field with different types of soil. Theoretical and Applied Genetics, 111(6), 1127–1136. https://doi.org/10.1007/s00122-005-0040-1
- Zhao, X. Q., Xu, J. L., Zhao, M., Lafitte, R., Zhu, L. H., Fu, B. Y., … Li, Z. K. (2008). QTLs affecting morph-physiological traits related to drought tolerance detected in overlapping introgression lines of rice (Oryza sativa L.). Plant Science, 174(6), 618–625. https://doi.org/10.1016/j.plantsci.2008.03.009