 ?Mathematical formulae have been encoded as MathML and are displayed in this HTML version using MathJax in order to improve their display. Uncheck the box to turn MathJax off. This feature requires Javascript. Click on a formula to zoom.
ABSTRACT
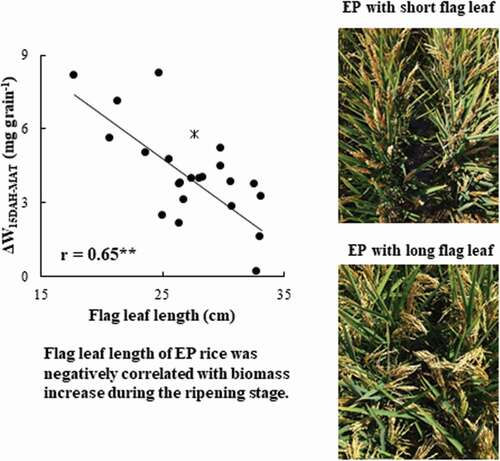
Increasing the yield potential of rice (Oryza sativa) is the main objective of breeders and cultivators engaged in rice improvement programs. Erect panicle (EP) rice is generally high-yielding with panicles that remain non-curved until maturation. The aim of our study was to evaluate the association of agronomic traits with rice productivity in EP rice. Here, we used the recombinant inbred lines (RILs), crosses between Liaojing5 (erect panicle japonica type) and Wanlun422 (high-yielding indica type). The yield varied among the RILs, and the flag leaf length of EP RILs was negatively correlated with the yield; however, the correlation was not significant in the non-EP RILs. The flag leaf length of the EP RILs was also negatively correlated with biomass increase during the late ripening stage. This may reflect the canopy structure of the EP RILs with short flag leaves which had a larger leaf area index in the lower strata. Additionally, the chlorophyll content in the lower leaf significantly differed among the EP RILs with flag leaves of different lengths, resulting in a higher photosynthetic ability of the lower leaf of EP RILs with short flag leaves. In the present study, an EP line, which has the shortest flag leaf, showed a higher yield than Wanlun422 in both years. EP RILs with short flag leaves might show a higher canopy photosynthetic rate in the later ripening stage; therefore, this trait could be a potential phenotypic marker for achieving high yield of EP rice.
Graphical Abstract
1. Introduction
Agricultural concerns, especially involving food availability, are always a high priority in developing countries. Rice (Oryza sativa L.) is one of the most important cereal crops and is widely cultivated, especially in Asia. The demand for rice is likely to increase because of population explosion and economic growth (Maclean et al., Citation2013). However, in recent years it has become difficult to expand the rice cultivation area because most of the arable land used for rice production has been converted to urban areas (Horie et al., Citation2005).
The ‘Green Revolution’, which occurred due to the introduction of the semi-dwarf gene into modern cultivars, has enabled to increase the yield potential of most crops (Sasaki et al., Citation2002; Spielmeyer et al., Citation2002). Increasing the yield potential of rice has been the major objective of breeders and cultivators engaged in international rice improvement programs (Li et al., Citation2009; Peng et al., Citation2008). Among various breeding strategies, an ideal plant architecture is essential to increase rice production. Since the 1980s, numerous high-yielding japonica rice varieties, characterized by erect panicles, have been released in northern China (Khush, Citation1995). Panicle angle is considered one of the most important agronomic traits in designing high-yielding erect panicle (EP) rice varieties (Kong et al., Citation2007).
A recent survey reported that EP rice is cultivated across 1.3 million ha throughout China (Song et al., Citation2013). Field experiments in China have showed that the yield of EP cultivars is considerably higher than that of non-erect panicle (nEP) rice (e.g. Jin et al., Citation2013). Several studies have examined the mechanisms underlying the high grain yield of EP rice in China (e.g. Tang et al., Citation2017). EP rice has panicles that remain non-curved until maturation (H. Xu et al., Citation2016). Urairi et al. (Citation2016) demonstrated that the nitrogen content and photosynthetic capacity of an EP rice cultivar were higher than those of other nEP rice cultivars. EP rice enhances dry matter productivity by intercepting more solar radiation via early transplanting and a higher plant density (Hirooka et al., Citation2018b). In addition, EP rice tends to have greater lodging resistance under high fertilizer input (Qiao et al., Citation2011), because of its unique leaf canopy and relatively uniform leaf area index distribution (Hirooka et al., Citation2018a). Thus, rice panicle architecture contributes to not only grain yield but also the ecological conditions of cultivated populations and physicochemical properties. However, the agronomic traits of EP rice that are advantageous for productivity and those related to canopy structure have not yet been determined.
Generally, large, wide, and long flag leaves are generally considered ideal for high yield due to the interception of more radiation (Saitoh et al., Citation2002). In particular, the importance of thicker leaves in relation to photosynthesis has been demonstrated (Takai et al., Citation2013). High-yielding rice cultivars generally show a higher leaf photosynthetic rate and rubisco content in the leaf (Adachi et al., Citation2011). In recent years, some indica hybrid cultivars with these leaf characteristics have been recognized as ‘super’ rice (Wani et al., Citation2011). Therefore, it is important to introduce the leaf characteristics of high-yielding indica rice into EP rice to further improve the grain yield of EP rice.
The objective of the present study was to evaluate the association of the agronomic traits with rice productivity in EP rice. We used the EP and nEP types of recombinant inbred lines (RILs), which were crosses between Liaojing5 (erect panicle japonica type) and Wanlun422 (which has a typical canopy structure of the high-yielding indica type). Their yield, yield components, canopy structure, and physiological characteristics were measured to elucidate productivity-related mechanisms of the EP RILs and to highlight the utilization of EP genes.
2. Materials and methods
2.1. Plant materials and growth conditions
The experiments were conducted in experimental fields belonging to the Graduate School of Agriculture, Kyoto University (35º 2ʹ N, 135º 477ʹ E; altitude: 65 m above sea level) in 2015 and 2016. We used Liaojing5, Wanlun422, and the EP and nEP RILs that were crosses between Liaojing5 and Wanlun422. Liaojing5 was the first high-yielding EP japonica rice developed in northern China in the 1980s. The EP and nEP RILs were determined using simple sequence repeat molecular marker-assisted detection of DEP1 (EP/qPE9-1), resulting in the truncation of phosphatidylethanolamine-binding protein-like domain protein and significant enhancement of meristematic activity (Huang et al., Citation2009; Sun et al., Citation2014). In 2015, we selected 23 EP and 35 nEP RILs with similar heading dates and plant heights based on the results of a preliminary field experiment that involved 241 RILs in 2013 (Tang et al., Citation2017). Based on the results of the 2015 study, as the flag leaf length was considered an important agronomic trait, the three EP and nEP RILs with shorter flag leaves (EPshort and nEPshort, resepectively) and the three EP and nEP RILs with longer flag leaves (EPlong and nEPlong, respectively) were selected, to evaluate the effect of flag leaf length on canopy structure in detail.
The seeds were sown on 23 April 2015 and 22 April 2016. The seedlings were transplanted on 21 May 2015 and 19 May 2016 to a paddy field with alluvial loam soil, classified as Haplaquept. Ecolong (JCAM AGRI, Tokyo, Japan), a slow release fertilizer containing coated urea (release rate: 100 days), was applied as a basal fertilizer at rates of 10.00, 7.86, and 9.29 g m−2 for N, P2O5, and K2O, respectively. Additionally, a chemical fertilizer was applied in the form of N-P2O5-K2O = 5-5-5 g m−2. Ecolong was also applied twice a year at rates of 5.00, 3.93, and 4.64 g m−2 for N, P2O5, and K2O, respectively, on June 15 and 27 July 2015 and on June 13 and 25 July 2016. Each plot covered an area of 1.50 m2 (1.5 × 1.0 m, 50 plants) in 2015 and 5.13 m2 (1.9 × 2.7 m, 171 plants) in 2016, and planting density was maintained at 33.3 plants per m2 with one plant per hill.
In both years, the experiments were conducted with a randomized block design with three replications. Watering, weeds, insects, and diseases were controlled as required to avoid yield loss.
2.2. Measurements
In both experimental years, the aboveground parts of 10 plant samples were harvested from each plot in the maturation stage. Grain yield, total dry weight (TDW), and harvest index (HI) of these samples were calculated. Moisture content in the grain was adjusted to 14% before measuring grain yield. The TDW was measured after oven drying the samples for 72 h at 80°C. The yield components [panicle number (PN), grain number per panicle (GN), seed setting rate (SSR), and 1000-grain weight (TGW)] were also measured for each sample. At 2 weeks after the heading date, three plant samples were harvested to calculate their aboveground dry weight, plant height (PH), leaf area index (LAI), flag leaf length (FLL), panicle length (PL) and panicle angle (PA, i.e. the angle between the stem and the extension line of the auricles and the top of the panicle). PA was measured only in 2016. The samples were chosen based on plant height and tiller number. The aboveground dry weight was measured after oven drying for 72 h at 80°C. Green leaf blades were separated from the plant samples and their area was measured using an area meter (LI3080; LI-COR Inc., Lincoln, Nebraska) to calculate the LAI.
In 2015, three plant samples were further harvested in the heading stage to calculate their aboveground dry weight and non-structural carbohydrates (NSC). The NSC concentration in the stem was estimated according to the method of Ohnishi and Horie (Citation1999).
In 2016, the LAI was measured on the heading date, and at 15 days (15DAH) and 30 days (30DAH) after the heading date. The LAI was measured using an LAI-2200 plant canopy analyzer (LI-COR Inc., Lincoln, Nebraska), at every 10–20 cm intervals along the vertical height in the canopy in each plot (Hirooka et al., Citation2018a). The measurements were conducted in a single-sensor mode in a sequence of the two above-mentioned measurements, followed by four measurements in the canopy of each plot under scattered light conditions, such as after sunrise, before sunset, or during overcast days. To reduce the influence of the adjacent plots and of the operator, a 90° view-cap was applied to the optical sensor. Chlorophyll content (SPAD) in the first (flag leaf), second (one below the flag leaf), and third (two below the flag leaf) leaves at 7, 14, and 28 days after heading (DAH) were measured using a SPAD meter (SPAD-502; Minolta Camera Co., Ltd, Osaka, Japan).
Meteorological data (daily solar radiation and air temperature) were measured using QMS101 and QMH101 temperature and relative humidity sensors (VAISALA, Tokyo, Japan).
2.3. Data analysis
HI was calculated using grain yield and TDW (yield/TDW). Sink capacity was calculated using grain number per m2 and a grain weight (grain number per m2 × weight of one grain) in 2015. Source amount was calculated from the NSC in the stem in the heading stage and the increase in biomass after heading. The SPAD decline rate was calculated using the SPAD values at 7DAH and 28DAH.
LAI vertical distribution was analyzed by calculating the mean and variance, which were obtained using the following statistical moment equations:
where a1 represents the mean of LAI vertical distribution, a2 represents the variance of LAI vertical distribution, k represents the number of strata, i represents each stratum, hi represents the relative height (0: the bottom; 1: the top of canopy) of the center at the i-th stratum, and LAIi represents relative LAI (1: total LAI) of the i-th stratum. a1 and a2 represent the center and uniformity of the LAI distribution, respectively (Hirooka et al., Citation2018b).
An ANOVA was used to analyze the effects of panicle type and flag leaf length, with EP and nEP RILs with short and long flag leaves, in three growth stages (heading stage, 15 and 30 DAH for LAI vertical distribution; 7, 14, and 28 DAH for the SPAD). The EP and nEP RILs were compared considering nested effect. All statistical analyses were carried out using R version 3.4.0 (R Core Team (2017)).
3. Results
The climatic data collected throughout the study period are summarized in . The daily average air temperature during the growth period was higher in 2016 than in 2015. In addition, the daily solar radiation in the ripening stage (from middle August to early September) was 2.93 MJ m−2 d−1 higher in 2016 than in 2015.
Table 1. Daily average temperature and solar radiation during the rice growth periods in 2015 and 2016
shows the comparison of yield, yield components and agronomic traits between the EP and nEP RILs in 2015. The yield of the EP RILs was not significantly different from that of the nEP RILs. The TDW, PN, and TGW of the nEP RILs were significantly higher than those of the EP RILs. In contrast, the GN of the EP RILs was significantly higher than that of the nEP RILs. Agronomic traits, LAI, FLL, and PL of the nEP RILs were significantly higher than those of the EP RILs.
Table 2. Yield, yield components, and agronomic traits of two rice progenitors and the erect panicle (EP) and non-erect panicle (nEP) type of RILs in 2015
shows the correlation coefficients for yield, yield components, and agronomic traits. The yield of the EP RILs was not significantly related to the TDW, but it was related to the HI. The higher-yielding EP RILs showed higher PNs, shorter flag leaves, and lower LAIs. In contrast, the yield of the nEP RILs was significantly correlated with both TDW and HI, but not significantly correlated with the FLL and LAI. Although the FLL of the nEP RILs was not closely related to the yield and yield components, it was significantly correlated with all yield components (PN, GN, SSR, and TGW) among the EP RILs (). This indicated that flag leaf length can be a potential phenotypic marker for advantageous agronomic traits in determining the yield of EP rice. Although the flag leaf length of the EP RILs was not significantly correlated with the sink capacity, it was significantly correlated with the source amount (r = 0.57**; ). In addition, the flag leaf length of the EP RILs was significantly correlated with the biomass increase per grain from 15DAH to maturity (r = 0.65**). However, it was not significantly correlated with the biomass increase per grain from heading to 15DAH or with the NSC amount in the stem at heading (). These results suggested that shorter flag leaves of the EP RILs led to a higher source amount in the later ripening stage.
Table 3. Pearson partial correlation coefficients for yield, yield components, and agronomic traits of 23 EP RILs and 35 nEP RILs in 2015
Figure 1. Relationship between the flag leaf length (cm) and (a) sink capacity (g m−2) and (b) source amount (mg grain−1) in EP RILs in 2015. * represents Liaojin5, an EP progenitor.
Figure 2. Relationship between the flag leaf length and the (a) non-structural carbohydrates in stems per grain at heading (NSC, mg grain−1), (b) biomass increase per grain from heading to 15 days after heading (∆WHD-15DAH, mg grain−1), and (c) biomass increase per grain from 15 days after heading to maturity (∆W15DAH-MAT, mg grain−1) in EP RILs in 2015. * represents Liaojin5, an EP progenitor.
In 2016, the yield and HI showed significant interaction effects between the RILs group and flag leaf length at 5% and 1%, respectively (). While nEPlong showed a higher yield than nEPshort, EPshort showed a higher yield than the EPlong (), due to the higher HI of EPshort. EPshort also showed relatively higher PN, SSR, TGW, and LAI values (), indicating that EPshort may have had a higher tillering ability and higher source amount at the later ripening stage. In contrast, EPshort showed lower GN, PH, and PL, and the PA in the later ripening stage, and the PA of EPshort was considerably lower than that of EPlong. There were significant interaction effects of GN, SSR, and TGW between groups and length. Thus, the responsiveness of flag leaf length to some yield components was different between the EP and nEP groups.
Table 4. Yield, yield components, and agronomic traits of two rice progenitors and the erect panicle (EP) type of RILs in 2016
presents the difference in the mean and variance of LAI distribution after heading. The mean (a1) showed a significant interaction between RILs group and flag leaf length at heading, 15DAH, and 30DAH. At heading and 15DAH, the EP RILs showed lower a1 than the nEP RILs. After 15DAH, EPshort showed a lower position of the center of the LAI distribution than EPlong. In contrast, the variance (a2) did not show significant length effect and interaction effect. The EP RILs showed a more uniform LAI distribution than the nEP RILs after heading.
Table 5. Averages and the results of ANOVA for the leaf area index (LAI) distribution parameters: mean LAI distribution (a1) and the variance of LAI distribution (a2) in the heading stage, and at 15 and 30 days after heading (15 DAH and 30 DAH, respectively)
The SPAD of the first, second and third upper leaves in nEPshort were consistently higher than that in nEPlong (). Contrarily, in the EP RILs the SPAD of the third leaf in EPshort was higher than EPlong after 14DAH, although the first leaf in EPshort was lower than that in EPlong (). The SPAD decline rate of the second leaf in EPshort was significantly lower and that of the third leaf in EPshort was tends to be lower than that in EPlong (). These results indicated that the lower leaves of EPshort senesced slowly and that they were able to maintain the photosynthetic rate. Therefore, the EPshort may have a higher canopy photosynthetic ability during the later ripening stage.
Table 6. Averages and the results of ANOVA for SPAD values of first, second, and third upper leaves at 7, 14, 28 days after heading (7 DAH, 14 DAH, and 28 DAH, respectively) and SPAD decline rate (7DAH to 28DAH)
4. Discussion
In the present study, the average grain yield of the EP RILs was approximately 7.24 t ha−1 in 2015 and 8.31 t ha−1 in 2016. The yield observed in this study was lower than that reported by song et al. (Citation2013) in field experiments in Northeast China under similar soil and treatment conditions (approximately 9.0 t ha−1). In this study, the EP RILs showed lower PN and TGW, but higher GN. Some studies have suggested that the higher solar radiation levels and lower nighttime temperatures are important for increasing rice yield (Peng et al., Citation2004; Seshu & Cady, Citation1984). In particular, Hirooka et al. (Citation2018b) suggested that the meteorological conditions of western Japan, with lower solar radiation levels and higher night temperatures, were not suitable for achieving the maximum yield, especially for EP rice. Longer insolation duration, lower daily average relative humidity, and higher diurnal temperatures in the grain filling stage are the main ecological factors that contribute to the high yield of rice in Northeast China (Jin et al., Citation2013). In the present study, the yield in 2016 was higher than that in 2015 probably because of the higher diurnal temperatures and solar radiation levels in the later ripening stage.
The EP RILs have been demonstrated to show higher GN and lower PN and TGW values (Tang et al., Citation2017). In addition, the EP RILs have lower SSRs owing to a lower source amount, whereas they show a higher number of grains (number per m2) (Q. Xu et al., Citation2015). In this study, short flag leaves of the EP RILs led to a higher biomass productivity in the later ripening stage, and this resulted in a higher source amount. In contrast, the flag leaf length of the nEP RILs rice was not significantly correlated with either sink capacity or source amount. In addition, the length of the nEP showed a significantly positive correlation with TDW and SSR. Indeed, TDW and SSR were closely related with the yield of the nEP RILs. The results suggested that the responsiveness of flag leaf length was considerably different between the EP and nEP RILs and that the flag leaf length can be used as a potential phenotypic marker for advantageous agronomic traits of EP rice to achieve a high yield.
Erect panicle architecture contributes to enhancing rice productivity by improving the canopy structure (Fei et al., Citation2019). Hirooka et al. (Citation2018a) proposed a novel method to characterize canopy structure using non-destructive measurements and statistical moment equations to analyze the differences in LAI vertical distribution. The moment equations represent the mean densities and spatial covariance (Bolker & Pacala, Citation1999). They also represent LAI vertical distribution of the EP RILs using stratified LAI measurements. Quantification of these characteristics might help understand the factors that govern the high yield potential of EP rice. Indeed, this method revealed that mean LAI distribution of EPshort was significantly lower than that of EPlong in the later ripening stage. In addition, the variance of LAI distribution of the EP RILs was significantly higher than that of the nEP RILs after the heading stage. In the later ripening stage, the lower position of the center of LAI distribution of EPshort than that of nEP and EPlong may have led to a higher light transmission within the plant canopy, and as a result, higher biomass productivity from 15DAH until maturation.
The SPAD value of the third upper leaf of EPshort was higher than that of EPlong in the later ripening stage, although, the first upper leaf of EPlong showed a higher SPAD value. In addition, the SPAD value of the first, second, and third upper leaves of nEPlong were consistently lower than those of EP and nEPshort after the heading stage. A previous study suggested that there was no significant correlation between the photosynthetic rate and flag leaf length of EP rice around the heading stage (Oishi et al., Citation2015). EPshort might maintain a higher canopy photosynthetic rate in the later ripening stage because of light transmission within the plant canopy and higher photosynthetic ability of the lower leaf.
The short flag leaf characteristic of EP RILs was considered to be an advantageous agronomic trait in this study, although the flag leaf length generally affects the yield performance of high-yielding indica rice (Bing et al., Citation2006; Jiang et al., Citation2004). In the present study, an EP line, which has the shortest flag leaf, showed a higher yield than Wanlun422 in both years. In contrast, nEPlong showed higher yield than nEPshort. The different responses of flag leaf length can be attributed to the unique canopy structure of EP rice. The EP rice showed a higher level of intercepted light by the lower part of the canopy than in non-EP rice (Fukushima et al., Citation2011). In this study, EPshort showed a lower position of the center of the LAI distribution and significantly higher SPAD values of lower leaves due to higher light transmission, which might lead to the higher photosynthetic ability of these leaves in the later ripening stage. In addition, panicle photosynthesis is not a negligible factor (Kato et al., Citation2004). Non-foliar photosynthetic organs play a key role in determining the yield during the ripening stage (Sanchez-Bragado et al., Citation2020). The contribution of panicle photosynthesis to grain yield might be important for EP rice because the short flag leaf reduces shading on the rice panicle. As a result, EPshort may have a higher canopy photosynthetic rate; EP rice with short flag leaves may be useful for high yield performance.
An increase in nitrogen use efficiency by improved crop management practices is mainly a result of coordinated nitrogen distribution within the canopy (Gu et al., Citation2017). In addition, the sink-source relationship is a critical factor influencing plant architecture and yield potential in crops (Cui et al., Citation2003). Tang et al. (Citation2017) reported that PN is a key component in enhancing the yield of EP rice, which is consistent with the results of this study. EPshort showed higher PN and biomass increments per grain from 15DAH until maturity. In this study, EPshort showed lower biomass production before heading, and the further breeding of types with higher productivity before heading is needed for cultivation in western Japan because the heading period is later than that in China. Further studies on optimum nitrogen distribution and canopy structure would help enhance the productivity of EP rice.
5. Conclusions
We found that the yield of the EP RILs varied and that the flag leaf length was significantly and negatively correlated with the yield, although a significant correlation was not observed for the nEP RILs. An EP line, which has the shortest flag leaf, showed a higher yield than Wanlun422 in both years. The flag leaf length of the EP RILs was negatively correlated with the source amount, especially with the biomass increase during the later ripening stage. This result can be attributed to the canopy structure of EPshort, larger LAI in the lower strata, and higher light transmission within the plant canopy. The senescence of the lower leaf of EPshort was delayed compared with that of EPlong. Furthermore, the photosynthetic rate of the lower leaf of EPshort may have been higher than that of EPlong. Short flag leaf length is a potential phenotypic marker for advantageous agronomical traits in determining the yield of EP rice, and the optimum canopy structure is essential for promoting high yields of EP cultivars.
Abbreviations
DAH, days after heading; EP, erect panicle; FLL, flag leaf length; GN, grain number per panicle; HI, harvest index; LAI, leaf area index; nEP, non-erect panicle; NSC, non-structural carbohydrates; PA, panicle angle; PH, plant height; PL, panicle length; PN, panicle number; RILs, recombinant inbred lines; SSR, seed setting rate; TDW, total dry weight; TGW, 1000-grain weight.
Acknowledgments
This study was supported by JSPS KAKENHI Grant Number JP26292013, and partially by JSPS Young Scientists Supports.
Disclosure statement
No potential conflict of interest was reported by the authors.
References
- Adachi, S., Nito, N., Kondo, M., Yamamoto, T., Arai-Sanoh, Y., Ando, T., Ookawa, T., Yano, M., & Hirasawa, T. (2011). Identification of chromosomal regions controlling the leaf photosynthetic rate in rice by using a progeny from japonica and high-yielding indica varieties. Plant Production Science, 14(2), 118–127. https://doi.org/https://doi.org/10.1626/pps.14.118
- Bing, Y., Wei-Ya, X. U. E., Li-Jun, L. U. O., & Yong-Zhong, X. I. N. G. (2006). QTL analysis for flag leaf characteristics and their relationships with yield and yield traits in rice. Acta Genetica Sinica, 33(9), 824–832. https://doi.org/https://doi.org/10.1016/S0379-4172(06)60116-9
- Bolker, B. M., & Pacala, S. W. (1999). Spatial moment equations for plant competition: Understanding spatial strategies and the advantages of short dispersal. The American Naturalist, 153(6), 575–602. https://doi.org/https://doi.org/10.1086/303199
- Cui, K., Peng, S., Xing, Y., Yu, S., Xu, C., & Zhang, Q. (2003). Molecular dissection of the genetic relationships of source, sink and transport tissue with yield traits in rice. Theoretical and Applied Genetics, 106(4), 649–658. https://doi.org/https://doi.org/10.1007/s00122-002-1113-z
- Fei, C., Yu, J., Xu, Z., & Xu, Q. (2019). Erect panicle architecture contributes to increased rice production through the improvement of canopy structure. Molecular Breeding, 39(9), 128. https://doi.org/https://doi.org/10.1007/s11032-019-1037-9
- Fukushima, A., Ohta, H., Kaji, R., Nakagomi, K., Yamaguchi, M., & Xu, Z. (2011). Yielding ability and morphological traits of erect panicle rice. Tohoku Journal of Crop Science, 54, 19–20. https://doi.org/https://doi.org/10.20725/tjcs.54.0_19
- Gu, J., Chen, Y., Zhang, H., Li, Z., Zhou, Q., Kong, Y. C., Liu, X., Wang, L., & Yang, J. (2017). Canopy light and nitrogen distributions are related to grain yield and nitrogen use efficiency in rice. Field Crops Research, 206, 74–85. https://doi.org/https://doi.org/10.1016/j.fcr.2017.02.021
- Hirooka, Y., Homma, K., & Shiraiwa, T. (2018a). Parameterization of the vertical distribution of leaf area index (LAI) in rice (Oryza sativa L.) using a plant canopy analyzer. Scientific Reports, 8(1), 6387. https://doi.org/https://doi.org/10.1038/s41598-018-24369-0
- Hirooka, Y., Homma, K., Shiraiwa, T., Makino, Y., Liu, T. S., Xu, Z., & Tang, L. (2018b). Yield and growth characteristics of erect panicle type rice (Oryza sativa L.) cultivar, Shennong265 under various crop management practices in Western Japan. Plant Production Science, 21(1), 1–7. https://doi.org/https://doi.org/10.1080/1343943X.2018.1426993
- Horie, T., Shiraiwa, T., Homma, K., Katsura, K., Maeda, S., & Yoshida, H. (2005). Can yields of lowland rice resume the increases that they showed in the 1980s? Plant Production Science, 8(3), 259–274. https://doi.org/https://doi.org/10.1626/pps.8.259
- Huang, X., Qian, Q., Liu, Z., Sun, H., He, S., Luo, D., Xia, G., Chu, C., Li, J., & Fu, X. (2009). Natural variation at the DEP1 locus enhances grain yield in rice. Nature Genetics, 41(4), 494. https://doi.org/https://doi.org/10.1038/ng.352
- Jiang, L., Dai, T., Jiang, D., Cao, W., Gan, X., & Wei, S. (2004). Characterizing physiological N-use efficiency as influenced by nitrogen management in three rice cultivars. Field Crops Research, 88(2–3), 239–250. https://doi.org/https://doi.org/10.1016/j.fcr.2004.01.023
- Jin, F., Wang, H., Xu, H., Liu, T., Tang, L., Wang, X., Jiang, Y., Yang, L., Li, M., Sui, M., Lang, X., Xu, Z., & Chen, W. (2013). Comparisons of plant-type characteristics and yield components in filial generations of Indica× Japonica crosses grown in different regions in China. Field Crops Research, 154, 110–118. https://doi.org/https://doi.org/10.1016/j.fcr.2013.07.023
- Kato, M., Kobayashi, K., Ogiso, E., & Yokoo, M. (2004). Photosynthesis and dry-mater production during ripening stage in a female-sterile line of rice. Plant Production Science, 7(2), 184–188. https://doi.org/https://doi.org/10.1626/pps.7.184
- Khush, G. S. (1995). Breaking the yield frontier of rice. GeoJournal, 35(3), 329–332. https://doi.org/https://doi.org/10.1007/BF00989140
- Kong, F. N., Wang, J. Y., Zou, J. C., Shi, L. X., De Jin, M., Xu, Z. J., & Wang, B. (2007). Molecular tagging and mapping of the erect panicle gene in rice. Molecular Breeding, 19(4), 297–304. https://doi.org/https://doi.org/10.1007/s11032-006-9062-x
- Li, J., Xin, Y., & Yuan, L. (2009). Hybrid rice technology development: Ensuring China’s food security. In D. J. Spielman & R. Pandya-Lorch (Eds.), Proven successes in agricultural development: A technical compendium to millions fed. International Food Policy Research Institute.
- Maclean, J., Hardy, B., & Hettel, G. (2013). Rice Almanac: Source Book for One of the Most Important Economic Activities on Earth (4th ed.). IRRI, Los Baños.
- Ohnishi, M., & Horie, T. (1999). A proxy analysis of nonstructural carbohydrate in rice plant by using the gravimetric method. Japanese Journal of Crop Science, 68(1), 126–136. https://doi.org/https://doi.org/10.1626/jcs.68.126
- Oishi, A., Tanaka, Y., Xu, Z., & Shiraiwa, T. (2015). Investigation of lines with high photosynthetic capacity among a population derived from a cross between an erect panicle rice and non erect panicle rice. Abstracts of the 239th Meeting of the CSSJ. p. 87. https://doi.org/https://doi.org/10.14829/jcsproc.239.0_87
- Peng, S., Huang, J., Sheehy, J. E., Laza, R. C., Visperas, R. M., Zhong, X., Centro, G. S., Khush, G. S., & Cassman, K. G. (2004). Rice yields decline with higher night temperature from global warming. Proceedings of the National Academy of Sciences, 101(27), 9971–9975. https://doi.org/https://doi.org/10.1073/pnas.0403720101
- Peng, S., Khush, G. S., Virk, P., Tang, Q., & Zou, Y. (2008). Progress in ideotype breeding to increase rice yield potential. Field Crops Research, 10, 8(1), 32–38. https://doi.org/https://doi.org/10.1016/j.fcr.2008.04.001
- Qiao, Y., Piao, R., Shi, J., Lee, S. I., Jiang, W., Kim, B. K., Lee, J., Han, L., Ma, W., & Koh, H. J. (2011). Fine mapping and candidate gene analysis of dense and erect panicle 3, DEP3, which confers high grain yield in rice (Oryza sativa L.). Theoretical and Applied Genetics, 122(7), 1439–1449. https://doi.org/https://doi.org/10.1007/s00122-011-1543-6
- Saitoh, K., Yonetani, K., Murota, T., & Kuroda, T. (2002). Effects of flag leaves and panicles on light interception and canopy photosynthesis in high-yielding rice cultivars. Plant Production Science, 5(4), 275–280. https://doi.org/https://doi.org/10.1626/pps.5.275
- Sanchez-Bragado, R., Vicente, R., Molero, G., Serret, M. D., Maydup, M. L., & Araus, J. L. (2020). New avenues for increasing yield and stability in C3 cereals: Exploring ear photosynthesis. Current Opinion in Plant Biology, 56, 223–234. https://doi.org/https://doi.org/10.1016/j.pbi.2020.01.001
- Sasaki, A., Ashikari, M., Ueguchi-Tanaka, M., Itoh, H., Nishimura, A., Swapan, D., Ishiyama, K., Saito, T., Kobayashi, M., Khush, G. S., Kitano, H., & Matsuoka, M. (2002). A mutant gibberellin-synthesis gene in rice. Nature, 416(6882), 701–702. https://doi.org/https://doi.org/10.1038/416701a
- Seshu, D. V., & Cady, F. B. (1984). Response of rice to solar radiation and temperature estimated from international yield trials. Crop Science, 24(4), 649–654. https://doi.org/https://doi.org/10.2135/cropsci1984.0011183X002400040006x
- Song, G., Xu, Z., & Yang, H. (2013). Effects of N rates on N uptake and yield in erect panicle rice. Agricultural Sciences, 4(9), 499. https://doi.org/https://doi.org/10.4236/as.2013.49067
- Spielmeyer, W., Ellis, M. H., & Chandler, P. M. (2002). Semidwarf (sd-1), “green revolution” rice, contains a defective gibberellin 20-oxidase gene. Proceedings of the National Academy of Sciences, 99(13), 9043–9048. https://doi.org/https://doi.org/10.1073/pnas.132266399
- Sun, H., Qian, Q., Wu, K., Luo, J., Wang, S., Zhang, C., Ma, Y., Liu, Q., Huang, X., Yuan, Q., Han, R., Zhao, M., Dong, G., Guo, L., Zhu, X., Gou, Z., Wang, W., Wu, Y., Lin, H., & Fu, X. (2014). Heterotrimeric G proteins regulate nitrogen-use efficiency in rice. Nature Genetics, 46(6), 652–656. https://doi.org/https://doi.org/10.1038/ng.2958
- Takai, T., Adachi, S., Taguchi-Shiobara, F., Sanoh-Arai, Y., Iwasawa, N., Yoshinaga, S., Hirose, S., Taniguchi, Y., Yamanouchi, U., Wu, J., Matsumoto, T., Sugimoto, K., Kondo, K., Ikka, T., Ando, T., Kono, I., Ito, S., Shomura, A., Ookawa, T., Yano, M., … Yamamoto, T. (2013). A natural variant of NAL1, selected in high-yield rice breeding programs, pleiotropically increases photosynthesis rate. Scientific Reports, 3(1), 2149. https://doi.org/https://doi.org/10.1038/srep02149
- Tang, L., Gao, H., Hirooka, Y., Homma, K., Nakazaki, T., Liu, T., Shiraiwa, T., & Xu, Z. (2017). Erect panicle super rice varieties enhance yield by harvest index advantages in high nitrogen and density conditions. Journal of Integrative Agriculture, 16(7), 1467–1473. https://doi.org/https://doi.org/10.1016/S2095-3119(17)61667-8
- Urairi, C., Tanaka, Y., Hirooka, Y., Homma, K., Xu, Z., & Shiraiwa, T. (2016). Response of the leaf photosynthetic rate to available nitrogen in erect panicle-type rice (Oryza sativa L.) cultivar, Shennong265. Plant Production Science, 19(3), 420–426. https://doi.org/https://doi.org/10.1080/1343943X.2016.1149037
- Wani, S. H., Sanghera, G. S., & Gosal, S. S. (2011). An efficient and reproducible method for regeneration of whole plants from mature seeds of a high yielding Indica rice (Oryza sativa L.) variety PAU 201. New Biotechnology, 28(4), 418–422. https://doi.org/https://doi.org/10.1016/j.nbt.2011.02.006
- Xu, H., Zhao, M., Zhang, Q., Xu, Z., & Xu, Q. (2016). The DENSE AND ERECT PANICLE 1 (DEP1) gene offering the potential in the breeding of high-yielding rice. Breeding Science, 66(5), 659–667. https://doi.org/https://doi.org/10.1270/jsbbs.16120
- Xu, Q., Liu, T., Bi, W., Wang, Y., Xu, H., Tang, L., Sun, J., & Xu, Z. (2015). Different effects of DEP1 on vascular bundle-and panicle-related traits under indica and japonica genetic backgrounds. Molecular Breeding, 35(8), 173. https://doi.org/https://doi.org/10.1007/s11032-015-0364-8