
 ?Mathematical formulae have been encoded as MathML and are displayed in this HTML version using MathJax in order to improve their display. Uncheck the box to turn MathJax off. This feature requires Javascript. Click on a formula to zoom.
ABSTRACT
Manual solar shades rely on occupants’ control and thus its energy performance is highly related to occupants’ behavior. This paper conducted a co-simulation study on the impact of shade behavior on building energy performance and its uncertainty at different window-to-war ratios (WWRs). A previously developed stochastic behavior model for manual solar shades is used in this paper. Results show that energy uncertainty increases from 1.8% to 3.5% as WWR increases from 25% to 90% and a linear regression was given for predicting energy uncertainty with a determination coefficient of 0.9595. Whether energy uncertainty due to stochastic shade behavior has a significant impact on total energy performance depends on WWR design. To have a high and robust building performance, a small WWR that meets minimum daylighting performance is suggested for office buildings in this climate region. For a more accurate simulation of manual shades, a better consideration of manual shades than existing simplified assumptions by building energy regulations/standards is required.
1. Introduction
Windows, as a building element, is mainly used to provide daylight, natural ventilation, view and connection to outdoors and solar gain in the winter (Koo, Yeo, and Kim Citation2010). Daylight through windows is beneficial to health of indoor occupants at both physiological and psychological aspects (Clevenger and Rogers, Citation2017; Gugliermetti and Bisegna Citation2006). Therefore, the design of windows or glazing is vital to achieve the above requirements. Research efforts have been conducted on window size to obtain a best building performance. For example, Carlos et al. (Ochoa et al. Citation2012) conducted a simulation study on design optimization for windows that provide low energy consumption and high visual comfort. They reported an optimum window-to-wall ratio (WWR) for each orientation: North 70%, South 60%, and for East and West 60%. A study by Alghoul, Rijabo, and Mashena (Citation2017) simulated the effect of WWR and window orientations on cooling and heating annual energy consumption in the city of Tripoli, Libya. They found that the effect of adding windows to the facade resulted in increasing annual total energy consumption by 6-181%. Persson, Roos, and Wall (Citation2006) simulated the influence of window size on the energy balance of low energy houses. Their research shows that the size of energy efficient windows does not have a major influence on the heating demand in the winter, but is relevant for the cooling need in the summer. To decrease the risk of excessive energy needed for cooling, there is an optimal window size for south facade.
Large windows are usually designed in contemporary office buildings in China for the purpose of achieving the above benefits. The negative impact of such design is overheating risk in the summer due to excessive solar heat gain and thus solar shading devices are commonly used in large glazing buildings (Yao Citation2014). Fixed shading devices, due to its ineffectiveness in balancing solar gain during different seasons compared to movable shades, are rarely used in office buildings in hot summer and cold winter zone of China. Top-down roller shades, can be adjusted to changing outdoor conditions, are widely used due to its low cost and maintenance. Although large windows provide greater potential for daylighting compared to small windows, the use of manual shades may, however, offset these advantages. A research by Reinhart et al. (Reinhart, Mardaljevic, and Rogers Citation2006) reported that large windows can actually reduce the contribution of daylighting because they can lead to greater glare, requiring blinds to be closed for longer.
Manual solar shades rely on occupants’ control and thus its performance should be evaluated based on the real adjustment by indoor occupants rather than simple deterministic schedules/thresholds (Da Silva, Leal, and Andersen Citation2015; Gunay, O’Brien, and Beausoleil-Morrison Citation2016; Yan et al. Citation2015). For example, some design standards assume that movable shadings are never active during the heating season, and that 70% of the glazing area is shaded during the cooling season while some recommend a more dynamic method, based on the assumption that the shading devices are used whenever the intensity of the solar irradiation on the window exceeds 300W/m2 (Da Silva, Leal, and Andersen Citation2015). According to a questionnaire survey conducted by O’Brien et al. (Citation2017), simulation assumptions about shades/blinds are generally open and only are closed during periods of visual or thermal discomfort. These assumptions greatly underestimate observed shade/blind occlusion levels and the corresponding solar heat gains, and overestimate daylighting potential and corresponding energy savings.
There is a need to accurately simulate the influence of manual solar shades on energy performance based on real occupants’ behavior. Although a few research reported the influence of occupant behavior (including manual shades) on energy performance (Da Silva, Leal, and Andersen Citation2015; Chapman, Siebers, and Robinson Citation2018; Gilani, O’Brien, and Gunay Citation2018; Parys, Saelens, and Hens Citation2011), the blind/shade models adopted in these research works were not applicable to manual solar shades in other buildings due to either limited shade positions or unusual blind systems. For example, Parys, Saelens, and Hens (Citation2011) simulated building energy performance based on the shade/blind model developed by Haldi and Robinson (Citation2010). However, this model can only predict three shade positions (fully down, fully retracted or half-way). Moreover, the research findings cannot be directly applied in buildings in hot summer and cold winter zone of China due to the differences of shade types and behavior characteristics (Yao Citation2014; Da Silva, Leal, and Andersen Citation2015).
To the best of author’s knowledge, the building energy performance and its uncertainty based on the combination of manual solar shades and WWR has not been investigated. Previous research has evidenced that occupant behavior on passive measures (such as solar shades, window opening for natural ventilation) has a significant impact on building energy performance and its uncertainty (Gunay, O’Brien, and Beausoleil-Morrison Citation2016). An accurate prediction of the energy performance of manual shades and its uncertainty is critical for guiding building energy design for obtaining a robust performance. To analyze the impact of occupant uncertainty of shade control behavior on building energy performance at different WWRs, a general shade behavior model developed for hot summer and cold winter zone of China in a previous study (Yao Citation2014) was used in this paper. This shade behavior model predicts more shade positions (5 shade positions) than aforementioned simulation studies and was constructed based on a manual top-down roller shading system that is widely used in this climate region. Therefore, it is more suitable to use this shade behavior model for building performance prediction. This research is a continuation of previous studies (Yao, Chow, and Chi Citation2016; Yao et al. Citation2016; Jian Citation2018; Yao Citation2017) and the focus of the current research is energy performance of manual shades for different WWRs, in order to quantify energy uncertainty due to occupant behavior and to provide suggestions on building energy design on windows and future building energy regulation/standard compilation.
2. Methodology
2.1. Stochastic model of manual solar shades
A typical office room model (length×width×height = 4 m×4 m×3 m) was considered in this paper for the following analysis. Three window-to-wall ratios (WWR = 25%, 50% and 90%) on the south facade as shown in was considered. The characteristics of the office room with the setting of manually controlled external shading devices are shown in .
Figure 1. South view of the room model with different WWRs.
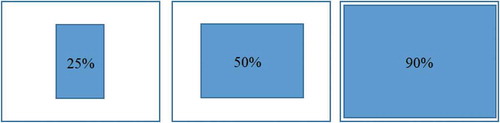
Table 1. Characteristics of the office room.
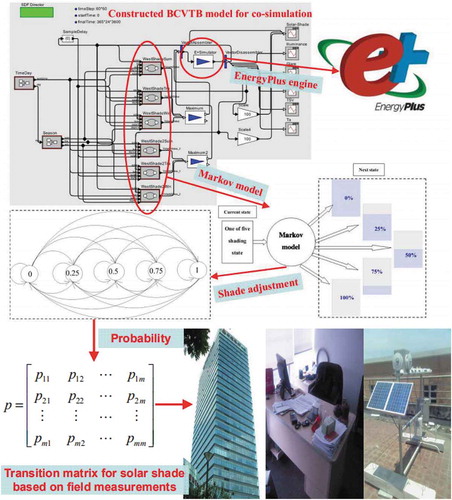
To investigate the uncertainty of energy performance of manual solar shades, a previously developed stochastic model by the author was used in this paper. This model was constructed using a first-order and discrete-time Markov Chain method based on monitored manual shade control behavior and has been validated against on field measurements. Five discrete solar shading positions for top-down roller shades (fully shaded, 75% shaded, 50% shaded, 25% shaded and fully open) were considered to represent possible occupant control actions and these positions correspond to 5 external shading coefficient (SC) values of 0, 0.25, 0.5, 0.75 and 1, respectively. The adopted Markov process predicts the shade position of the next time step based only on the shade position of the current time step using a Markov chain transition matrix (the probability of solar shade changes from the current state to the next one). This developed stochastic model was constructed in Building Controls Virtual Test Bed (BCVTB) for coupling with EnergyPlus. A brief description of this stochastic model and its co-simulation can be seen in . More detailed information on this model can be found in the previous paper (Yao Citation2014).
Figure 2. A graphic illustration of the applied method for co-simulation of daylighting performance of manual solar shades.
2.2. Uncertainty of shade behavior
Due to stochastic of occupant behavior on solar shades, the shade positions adjusted by occupant are not a fixed value even at the same environmental conditions, which means the predicted shade position or SC by the shade behavior model is a probability function and thus any two simulation runs will give two different hourly SC values for annual simulation. An index used to assesses how well the relationship between two variables (here hourly SC values between different simulations) is correlation coefficient. In this paper, Spearman rank correlation, a non-parametric test, is used. The Spearman rank correlation test does not carry any assumptions about the distribution of the data and thus is appropriate for correlation analysis for discrete SC values.
2.3. Number of repeated simulation runs
Due to uncertainty of shade behavior, simulated energy performance is stochastic values and thus repeated simulation runs are required to understand the possible distribution of the output parameters. According to literature (Chapman, Siebers, and Robinson Citation2018), additional simulation time needed for repeated runs can be considered as a weakness. Thus, this paper adopted the graphical method recommended in (Robinson Citation2014) to calculate the required minimum number of simulation runs that enable to achieve a converged solution. This method plots the cumulative mean of the simulation output data and thus after sufficient replications the graph will become a flat line with no upward or downward trend. The number of repeated simulation runs required is defined by the point at which the line becomes flat.
2.4. Energy performance
Due to uncertainty of occupant behavior on manual shades, cooling, heating and lighting energy and influenced by shade behavior while energy demands for equipment are not related to shade behavior and thus cooling, heating, lighting and total (the summation of cooling, heating and lighting) energy are considered in this research. By determining the minimum required simulation runs, the possible distribution of energy performance will be statistically tested and the probability density function (PDF) is used to fit to the data. In this research normal distribution was adopted (since the following analysis confirmed the normal distribution of the data) which uses a two-parameter family of curves. The first parameter, , is the mean. The second,
, is the standard deviation. And the normal PDF of the energy data (
) can be expressed as:
Using the above fitting analysis, the distribution of energy performance can be determined as well as its 95% confidence interval. This interval gives a 95% probability of the distribution of energy performance and then the lower and upper bounds of this interval can be used to represent the uncertainty of predicted energy performance. To have a percentage value of total energy uncertainty rather than an absolute one, these lower and upper bounds were further divided by the mean value.
The robustness of building energy performance is an important factor influencing building design (Brien and Gunay Citation2015). A robust design tries to achieve design parameters that are more resilient to uncertain operating conditions and are less sensitive to occupant behavior. Existing building performance gaps between predicted and actual energy consumption is mainly due to occupant uncertainty on passive design measures (such as manual solar shades) (Guerra-Santin et al. Citation2016). To evaluate the robustness of different WWR designs, the above introduced total energy uncertainty was used. A higher energy uncertainty indicates a lower performance robustness. Furthermore, energy savings from an enhanced wall insulation were simulated at different WWRs and were compared to the energy uncertainty due to occupant behavior to further determine which design has a higher and more robust building performance.
3. Results and discussion
3.1. Repeated simulation runs
shows hourly SC values between two repeated simulation runs. It can be seen that shade is not adjusted at the same position for two simulations even all other environmental conditions are kept unchanged. This uncertainty of shade change reflects the uncertainty of occupant behavior. To evaluate the magnitude of this uncertainty effect, gives distribution of Spearman correlation coefficient of hourly SC sequence between 50 repeated simulation runs. A value of +1 indicates a perfect positive correlation between the two variables, −1 represents totally negative correlation and 0 corresponds to an absence of linear correlation. It can be seen that most values are between −0.2 and 0.2, indicating a very weak correlation. Therefore, the uncertainty of occupant behavior on solar shades can be sufficiently generated by the shade behavior model used in this paper and thus the corresponding energy uncertainty can also be simulated by this model.
Figure 3. Hourly SC values for two repeated simulation runs (o represents simulation1 and x represents simulation2).
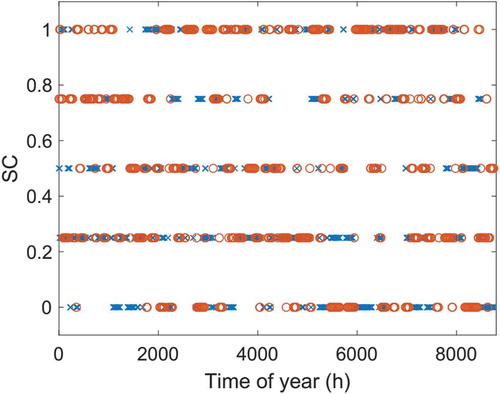
Figure 4. Distribution of Spearman correlation coefficient of hourly SC sequence between 50 repeated simulation runs.
shows energy demands of repeated simulation runs for different WWRs. It can be seen that different simulation runs lead to different energy performance values due to stochastic behavior characteristics. However, it was also observed that the energy demand seems to fluctuate along its average value with a relatively small deviation. gives the convergence of energy demands for WWR90%. It can be seen that after 10 simulation runs the graph becomes a flat line with no upward or downward trend for cooling, heating and lighting demands. By combining the energy uncertainty from these three categories, the energy uncertainty for total energy demand is a little higher with the number of repeated simulation runs being about 20. For WWR25% and WWR50%, a similar number is determined to obtain a converged solution. Therefore, 50 repeated simulation runs (larger than required minimum values) were used to conduct further energy uncertainty analysis. Further, normal tests of these energy data points using Shapiro–Wilk test (Prada et al. Citation2018) show that both cooling, heating, lighting and total energy demands follow normal distribution with statistical P value higher than 0.05 (a threshold value), indicating the null hypothesis cannot be rejected and the data are normally distributed.
Figure 5. Energy demands of repeated simulation runs for different WWRs.
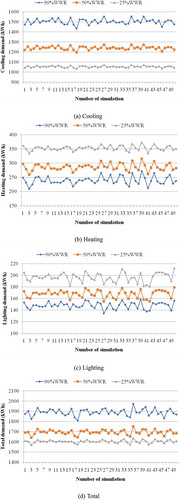
Figure 6. Convergence of energy demands for WWR90%.

3.2. Energy breakdown
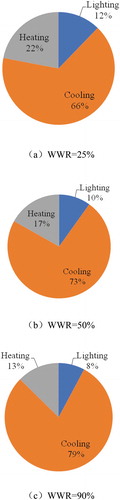
shows energy breakdown at different WWRs. It can be seen that for all three WWRs cooling demand is higher than 65%, which is more than 3 times higher than heating demand and more than 6 times higher than lighting demand. Thus, the use of solar shading devices in the summer has a significantly positive impact on cooling and total energy performance, especially for large WWRs (cooling demand is 6 times higher than heating demand). For heating and lighting demands, a higher WWR leads to a lower energy demand. This is because a larger window penetrates more daylight and solar heat. Due to the large share of energy demand, cooling plays a significant role in total energy demand, which was further discussed in the following section.
Figure 7. Energy breakdown for different WWRs.
3.3. Energy demand vs. WWR
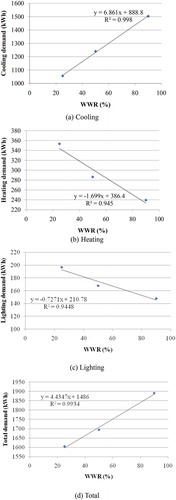
shows cooling, heating, lighting and total energy demands at different WWRs. It can be seen that cooling demand increases as WWR increases, while the opposite trend is observed for heating and cooling demands. Due to larger demand for cooling compared to heating and lighting (as can be seen in the above section), the total energy demand has a similar trend as cooling, indicating a lower WWR has a better total energy performance. Linear fitting to these data points was also conducted and the resulting regression equation as well as R square was given in . R square, which is also called coefficient of determination values, was used to determine the accuracy of the regression. R square values range from 0 to 1 and a higher R square value indicates a good fit. For heating and lighting demands, R square is higher than 0.94, while for cooling and total demands its value is higher than 0.99, indicating linear regression equation can adequately represent these data points. Thus, energy performance with other WWR values which are not simulated in this research can be predicted using these linear equations without needing to perform time and effort consuming modeling and co-simulation for shade behavior.
Figure 8. Energy demand vs. WWR (for the regression equation, y represents energy demand and x represents WWR).
3.4. Energy uncertainty vs. WWR
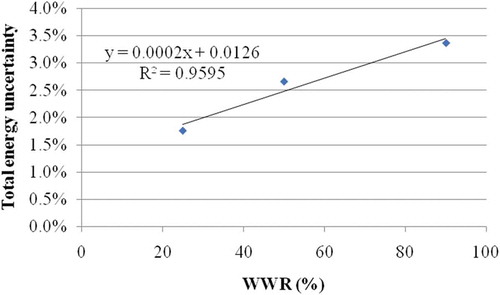
The energy uncertainties for different WWRs due to shade behavior are shown in . It can be seen that energy uncertainty increases as WWR increases with uncertainty value ranges from about 1.8% to 3.5%. The reason for this increasing trend is that a larger WWR leads to a higher uncertainty of transmitted daylight and solar heat and thus a more significant fluctuation on energy performance as can be seen from . Meanwhile, there is also a strong linear correlation between these two factors with a high R square coefficient (0.9595). Therefore, the linear regression equation illustrated in can be used to predict energy uncertainty of other WWRs.
Figure 9. Total energy uncertainty vs. WWR (for the regression equation, y represents energy uncertainty and x represents WWR).
3.5. Discussion
Although a total energy uncertainty of 1.8%-3.5% at annual scale seems to be small, for a single type of occupant behavior (only shade control, other types of control such as thermostat adjustment, window opening, HVAC operating are not considered in this paper) it is actually a relatively large energy uncertainty and it has a large impact on the selection of appropriate energy-saving measures. To justify this conclusion, the energy savings potential of regular energy efficiency measures (such as wall insulation) was simulated and compared with the savings uncertainty due to shade behavior. The U value of external wall was reduced from 1 W/(m2K) to 0.4 W/(m2K) (a 60% reduction), the simulated total energy saving was only 0.42% for the WWR90%, which is much smaller than energy uncertainty due to shade behavior (about 3.5%). The energy saving due to wall insulation increases as WWR decreases (2.06% for WWR50% and 4.32% for WWR25%). It can be seen that for WWR50%, energy uncertainty due to occupant behavior is still a little higher than the energy saving. Only for WWR25%, the energy saving (4.32%) is higher than the energy uncertainty (1.8%). Therefore, the impact of occupant behavior (shade control in this research) on energy performance is highly related to building design (such as WWR in this research) and careful selection of appropriate design solutions is critical for a performance robust building design. According to the research finding in this paper, a smaller WWR is suggested for office buildings in this climate region since it has a lower total energy demand and a lower energy uncertainty.
For building energy regulations/standards in this climate region, manual shades are simply considered to be adjusted at fixed positions and thus the uncertainty of shade positions and consequently its energy uncertainty due to shade behavior has not been mentioned in regulations/standards. Therefore, a higher energy uncertainty at larger WWRs will not be predicted using current regulation/standard assumptions, and the robustness of building performance at different WWRs will be predicted to be equal for manual shades since no stochastic shade behavior is considered. These conclusions are not in line with the reality due to the lack of consideration of occupant uncertainty on manual shades, which needs to be addressed in future building energy regulation/standards compilation and possible simplified simulation strategies for manual shades need further research efforts.
4. Conclusion
This paper conducted a co-simulation analysis of the impact of shade behavior on building energy performance at different WWRs. A previously developed stochastic shade behavior model is used in this paper and three WWR scenarios were simulated. Results show that energy uncertainty increases from 1.8% to 3.5% as WWR increases from 25% to 90% and a linear regression was given for predicting energy uncertainty at other WWRs with a determination coefficient of 0.9595. Whether energy uncertainty due to stochastic shade behavior has a significant impact on total energy performance depends on WWR. To have a relatively high and robust building performance, a small WWR is suggested for office buildings in this climate region. However, it should be noted that the minimum daylighting performance (such as daylight factor or useful daylight illuminance) required by design standard should be met when lowering WWR, which will be further investigated in future research works. For a more accurate simulation of manual shades, a better consideration of manual shades than existing simplified assumptions by building energy regulations/standards is required.
Acknowledgments
The author also would like to thank the K.C. Wong Magna Fund in Ningbo University.
Disclosure statement
No potential conflict of interest was reported by the author.
Additional information
Funding
Notes on contributors
Jian Yao
Jian Yao is an associate professor at the department of architecture of Ningbo University. Dr. Yao has many years of experience in studying solar shading performance, daylighting and occupant behavior.
References
- Alghoul, S. K., H. G. Rijabo, and M. E. Mashena. 2017. “Energy Consumption in Buildings: A Correlation for the Influence of Window to Wall Ratio and window Orientation in Tripoli, Libya.” Journal of Building Engineering 11: 82–86. doi:10.1016/j.jobe.2017.04.003.
- Brien, W. O., and H. B. Gunay. 2015. “Mitigating Office Performance Uncertainty of Occupant Use of Window Blinds and Lighting Using Robust Design.” Building Simulation 8 (6): 621–636. doi:10.1007/s12273-015-0239-2.
- Chapman, J., P. Siebers, and D. Robinson. 2018. “On the Multi-agent Stochastic Simulation of Occupants in Buildings.” Journal of Building Performance Simulation 11 (5): 604–621. doi:10.1080/19401493.2017.1417483.
- Clevenger, C. M., and Z. Rogers. 2017. “Managing Daylight in Airports.” Journal of Architectural Engineering 23 (3): 04017006. doi:10.1061/(ASCE)AE.1943-5568.0000245.
- Da Silva, P. C., V. Leal, and M. Andersen. 2015. “Occupants’ Behaviour in Energy Simulation Tools: Lessons from a Field Monitoring Campaign regarding Lighting and Shading Control.” Journal of Building Performance Simulation 8 (5): 338–358. doi:10.1080/19401493.2014.953583.
- Gilani, S., W. O’Brien, and H. B. Gunay. 2018. “Simulating Occupants’ Impact on Building Energy Performance at Different Spatial Scales.” Building and Environment 132: 327–337. doi:10.1016/j.buildenv.2018.01.040.
- Guerra-Santin, O., N. Romero Herrera, E. Cuerda, D. Keyson, et al. 2016. “Mixed Methods Approach to Determine Occupants’ Behaviour – Analysis of Two Case Studies.” Energy and Buildings 130: 546–566. doi:10.1016/j.enbuild.2016.08.084.
- Gugliermetti, F., and F. Bisegna. 2006. “Daylighting with External Shading Devices: Design and Simulation Algorithms.” Building and Environment 41 (2): 136–149. doi:10.1016/j.buildenv.2004.12.011.
- Gunay, H. B., W. O’Brien, and I. Beausoleil-Morrison. 2016. “Implementation and Comparison of Existing Occupant Behaviour Models in EnergyPlus.” Journal of Building Performance Simulation 9 (6): 567–588. doi:10.1080/19401493.2015.1102969.
- Haldi, F., and D. Robinson. 2010. “Adaptive Actions on Shading Devices in Response to Local Visual Stimuli.” Journal of Building Performance Simulation 3 (2): 135–153. doi:10.1080/19401490903580759.
- Jian, Y. 2018. “Daylighting Performance of Manual Solar Shades.” Light & Engineering 26 (1): 99–104.
- Koo, S. Y., M. S. Yeo, and K. W. Kim. 2010. “Automated Blind Control to Maximize the Benefits of Daylight in Buildings.” Building and Environment 45 (6): 1508–1520. doi:10.1016/j.buildenv.2009.12.014.
- O’Brien, W., I. Gaetani, S. Gilani, S. Carlucci, P.-J. Hoes, J. Hensen et al. 2017. “International Survey on Current Occupant Modelling Approaches in Building Performance Simulation.” Journal of Building Performance Simulation 10 (5–6): 653–671. doi:10.1080/19401493.2016.1243731.
- Ochoa, C. E., M. B. C. Aries, E. J. van Loenen, J. L. M. Hensen, et al. 2012. “Considerations on Design Optimization Criteria for Windows Providing Low Energy Consumption and High Visual Comfort.” Applied Energy 95: 238–245. doi:10.1016/j.apenergy.2012.02.042.
- Parys, W., D. Saelens, and H. Hens. 2011. “Coupling of Dynamic Building Simulation with Stochastic Modelling of Occupant Behaviour in Offices – A Review-based Integrated Methodology.” Journal of Building Performance Simulation 4 (4): 339–358. doi:10.1080/19401493.2010.524711.
- Persson, M., A. Roos, and M. Wall. 2006. “Influence of Window Size on the Energy Balance of Low energy Houses.” Energy and Buildings 38 (3): 181–188. doi:10.1016/j.enbuild.2005.05.006.
- Prada, A., G. Pernigotto, P. Baggio, A. Gasparella et al. 2018. “Uncertainty Propagation of Material Properties in Energy Simulation of Existing Residential Buildings: The Role of buildings Features.” Building Simulation 11 (3): 449–464. doi:10.1007/s12273-017-0418-4.
- Reinhart, C. F., J. Mardaljevic, and Z. Rogers. 2006. “Dynamic Daylight Performance Metrics for Sustainable Building Design.” LEUKOS 3 (1): 7–31. doi:10.1582/LEUKOS.2006.03.01.001.
- Robinson, S. 2014. Simulation: The Practice of Model Development and Use. UK: Palgrave Macmillan UK.
- Yan, D., W. O’Brien, T. Hong, X. Feng, H. Burak Gunay, F. Tahmasebi, A. Mahdavi, et al. 2015. “Occupant Behavior Modeling for Building Performance Simulation: Current State and Future Challenges.” Energy and Buildings 107: 264–278. doi:10.1016/j.enbuild.2015.08.032.
- Yao, J. 2014. “Determining the Energy Performance of Manually Controlled Solar Shades: A Stochastic Model Based Co-simulation Analysis.” Applied Energy 127 (8): 64–80. doi:10.1016/j.apenergy.2014.04.046.
- Yao, J. 2017. “Stochastic Characteristics of Manual Solar Shades and Their Influence on Building Energy Performance.” Sustainability 9 (12): 1070.
- Yao, J., D. Chow, and Y. Chi. 2016. “Impact of Manually Controlled Solar Shades on Indoor Visual Comfort.” Sustainability 8 (8): 727. doi:10.3390/su8080727.
- Yao, J., D. H. C. Chow, R.-Y. Zheng, C.-W. Yan et al. 2016. “Occupants’ Impact on Indoor Thermal Comfort: A Co-simulation Study on Stochastic Control of Solar Shades.” Journal of Building Performance Simulation 9 (3): 272–287. doi:10.1080/19401493.2015.1046492.