
 ?Mathematical formulae have been encoded as MathML and are displayed in this HTML version using MathJax in order to improve their display. Uncheck the box to turn MathJax off. This feature requires Javascript. Click on a formula to zoom.
ABSTRACT
The nature of the mixed-use building’s characteristics should be considered to calculate a proper construction duration for mixed-use buildings in the project planning phase. However, the existing construction duration prediction models are incapable to reflect nature as they were developed mainly for single-use buildings. Therefore, the purpose of this study was to suggest a multiple linear regression model for mixed-use buildings that can help the owner and contractor predict a proper construction duration in the project planning phase. To do so, 1,969 mixed-use building project data were collected. The final prediction model for mixed-use buildings with five independent variables was suggested in this study. Its R2 was 0.637 and Ra2 was 0.635. In addition, the results of the validation showed that the prediction model’s average prediction accuracy, MAPE, and RMSE were 88.51%, 75.94, and 11.49% respectively. Given that the prediction model is applied in the project planning phase when there is insufficient information on the project, the results are believed to be at a considerably reliable level. This prediction model will allow the end-user to make simple and quick predictions of a construction duration of a mixed-use building based only on the basic information in the project planning phase.
1. Introduction
1.1. Background and purpose
An estimation of the appropriate duration of construction at the beginning of a project is critical in ensuring its success eventually (Bayram Citation2017). The construction time is usually estimated in the planning phase when an analysis of the feasibility of the project is made (Sonmez Citation2004; Park Citation2011). It is used as a standard to assess the validity of a given business contract and execution of the project and serves as a basis to make necessary business decisions. However, the estimation of the construction time in the planning phase is more challenging than when it is done in the design phase, due to the limited amount of information available to project planners and frequent changes that occur during the consultation between the client and designer (Sonmez Citation2004). Recognizing its importance, many researchers have conducted research on developing time prediction models based on performance data.
A mixed-use building is a structure that is designed to serve multiple purposes, such as residential, business, and commercial use, that are physically and functionally integrated, and this varied usage allows diversification of investment risk and intensive use of land. Mixed-use development projects vary in their form and arrangement according to the size and location of the land (Rabianski et al. Citation2009), and take into consideration the structure that fits each purpose of use, floor planning, and integration of the multiple functions (Herndon Citation2011). Therefore, they are more complex than single-use building projects in terms of design and construction, and generally, more time is required for their completion (Bergeron Citation2007). Thus, the development of a construction time prediction model based on performance data that reflects the distinctive characteristics of mixed-use building projects is necessary.
However, the models that were developed in previous studies targeted only single-use buildings, such as apartment buildings and business facilities, making them unsuitable for mixed-used building construction projects. Nevertheless, little research has been conducted to develop such a model for mixed-use buildings.
In this paper we present a multiple regression model that enables project planners, including clients and contractors, to accurately estimate the construction time in the project planning phase. We expect that the proposed model will make it easier to predict the construction time based on a client’s requirements and design changes and ensure timeliness and reliability in the decision making of project planners as well as clients.
1.2. Research scope and methodology
The scope of this study is limited to mixed-use buildings whose primary use is “multi-family housing” or “business facility” with their ancillary use being “class 1 neighborhood living facility,” “class 2 neighborhood living facility,” “business facility (when primary use is multi-family housing),” or “multi-family housing (when primary use is business facility).” The terms of use types in mixed-use buildings are defined in of Article 3.5 (Types of Buildings by Use) of the Enforcement Decree of the Building Act in South Korea. Additionally, the performance data used in the study were collected from Korean construction companies working on domestic projects. The data set includes primary use type, construction region, gross floor area, number of stories, building area, and structure type.
Table 1. Summary of previous studies on multiple regression models to estimate construction time.
Table 2. Selection of independent variables.
Table 3. Descriptive statistics of total performance data set (N = 1969).
Table 4. Descriptive statistics of performance data set for model-building (N = 1182).
Table 5. R2 of Prediction Model I by stepwise selection.
Table 6. Analysis of variance of Prediction Model I.
Table 7. Comparison of R2 of Prediction Model I before and after the removal of outliers.
Table 8. Summary of Prediction Model I with outliers removed.
Table 9. Correlation coefficients of the independent variables with respect to construction time.
Table 10. R2 of Prediction Model II by stepwise selection.
Table 11. Summary of Prediction Model Ⅱ by stepwise selection.
Table 12. Analysis of correlation between independent variables to address multicollinearity.
Table 13. Comparison of R2 of Prediction Model II before and after removal of variable.
Table 14. Comparison of R2 of Prediction Model II before and after removal of outliers.
Table 15. Summary of Prediction Model II with outliers removed.
Table 16. Comparison of Ra2 of Prediction Models I and II.
Table 17. Descriptive statistics of prediction accuracy of Prediction Models I and II.
Table 18. Results of t-test of mean prediction accuracy.
Table 19. Descriptive statistics of validation data set (N = 787).
Table 20. Comparison of RMSE and MAPE of Prediction Models I and II.
Table 21. Comparison of prediction accuracy of Prediction Models I and II.
The key procedures and methodology of the present research are as follows:
1) Analysis of previous studies on construction duration prediction models in the planning phase.
We theoretically examine previous studies and prediction methodologies on construction duration prediction models in the planning phase and present an approach to developing a prediction model for mixed-use building projects.
2) Collection and analysis of performance data.
Through an examination of relevant literature, we establish independent variables that are frequently applied and easy to obtain and use in the project planning phase. Based on these independent variables, we collect the performance data on mixed-use building projects and identify their characteristics through descriptive statistical analysis.
3) Development of a construction duration prediction model for mixed-use buildings.
We develop prediction models (i) without variable transformation and (ii) with transformation, of the independent variables and compare the values of R2, Ra2, and prediction accuracy of both the models. Finally, through a t-test of the mean values of prediction accuracy, we select the final model that is suitable for mixed-use buildings.
4) Validation of the selected construction duration prediction model for mixed-use buildings with real cases.
We affirm the accuracy and validity of the final selected model by using a holdout sample of the validation data set. In addition, by comparing the values of the root mean square error (RMSE) and mean absolute percentage error (MAPE) of the selected and eliminated models, we verify the goodness of fit of the final model.
2. Theoretical considerations
2.1. Previous studies on the construction duration prediction model in planning phase
Realizing the necessity of estimating the appropriate duration of construction of projects in the planning phase, many researchers have conducted studies based on basic information such as the gross floor area of a building that is available in the planning stage. In this study, our analysis is centered around the Bromilow’s time-cost (BTC) model, the most notable of construction duration estimation models, as well as other studies on multiple regression models proposed by a number of researchers that address the limitations of the BTC model.
2.1.1. Previous study on Bromilow’s Time-Cost (BTC) model
The BTC model by Bromilow (Citation1969) is the first model that enabled the estimation of the construction period in the project planning phase (Dursun Citation2013). On learning that out of the 307 construction projects completed between July 1964 and July 1967 in Australia, 270 of them (80%) had crossed the stipulated contract period, Bromilow carried out a study to develop a model that would estimate the construction time of a project in the planning phase. He found that there was a strong correlation between the estimated final cost and duration of construction of the project, and accordingly proposed the BTC model expressed by Equation (1):
where T: Duration of construction period, K: A constant describing the general level of time performance, C: Construction cost, and B: Sensitivity of construction cost to duration of construction period
2.1.2. Limitations of the BTC model and previous studies on multiple regression models
The BTC model is the most notable prediction model that has been cited frequently in the last few decades with regard to predicting the construction time at the initial stage of a project. Several studies, however, pointed out its shortcomings which are summarized below:
(1) The BTC model is a simple regression model with only one independent variable, namely, construction cost, and does not consider other factors such as gross floor area, number of stories above the ground or below the ground, when establishing the construction time (Walker Citation1995). (2) The model is limited to being used in the planning phase of the project when the information available is very basic, such as the use of the building. Therefore, it is not possible to accurately predict the construction cost (Love, Tse, and Edwards Citation2005), and the resulting error adversely affects the predictive ability of the BTC model.
To address these limitations, multiple regression models were developed using several independent variables that could be obtained in the planning phase, as illustrated in .
2.2. Multiple regression analysis
Based on previous studies, we adopted the method of multiple regression analysis to statistically predict the construction duration of construction projects in the planning phase. As one of the statistical tools that are most widely used, multiple regression analysis allows the prediction of construction time based on variables that can be identified in the project planning phase and has the advantage of providing users with information on the magnitude of the individual effects of dependent and independent variables (regression parameters). Consequently, this method is expected to serve the purpose of this study adequately as it facilitates the prediction of construction duration according to a client’s requirements including possible changes in design conditions in the planning phase.
The multiple linear regression equation consists of independent variables (explanatory variables) and a dependent variable (response variable). The relationship between the dependent and independent variables is expressed by Equation (2) as follows (Kim Citation2007):
In the above equation, Y represents the dependent variable, X1, X2, …, Xp represents the set of independent variables, p is the number of independent variables, and ɛ refers to the probable error, which shows the deviation of the data from the approximation. The probable error denotes the degree to which a model does not fit the given data. The function f(X1, X2, …, Xp) describes the relationship between Y and X1, X2, …, Xp. The multiple regression equation consists of a single dependent variable and two or more independent variables. The relationship between the dependent variable (Y) and independent variables (X1, X2, …, Xp) is expressed by Equation (3) as follows:
In the above equation, β0, β1, …, βp are called regression parameters or coefficients, representing the known constants that can be estimated from the given data set.
2.3. Process of developing the construction duration prediction model for mixed-use buildings
In the previous studies regarding single-use building projects, some researchers performed a multiple regression analysis without variable transformation (Jarkas Citation2015) while others conducted a regression analysis through log transformation of dependent and independent variables (Love, Tse, and Edwards Citation2005). In both the methods, the partial derivative with respect to each of the independent variables was a constant based on the assumption of linearity.
However, investigation must be conducted as to whether such linearity can be a form that represents the relationship between the dependent and independent variables in mixed-use building projects. A mixed-use building is a structure that serves more than two purposes where functions such as residential and commercial uses are integrated into one building. Mixed-use buildings can take on different forms and arrangements according to their uses and such building projects must consider the structure that fits each purpose of use and how the multiple uses can be comprehensively integrated throughout the entire project. Even within the same mixed-use building project, characteristics such as structure, floor planning, construction method, applicable laws and regulations, construction technique, and level of difficulty in construction, can vary depending on the intended use. The relationship between the dependent (construction time) and individual independent variables (eg, gross floor area, the number of stories above ground) must be further explored to reflect the characteristics of mixed-use buildings.
In view of the above, it is appropriate to break down the performance data by form and arrangement based on the uses of the building and run a regression analysis through variable transformation. However, due to the limitation of data collection, the scope of this study is restricted to estimating the relationships that represent mixed-use building projects through the transformation of independent variables, without considering their different forms and arrangements.
3. Collection and analysis of performance data
3.1. Selection of independent variables
From the effective factors of previously discussed multiple regression models, we selected those that were easy to obtain and use as independent variables in the planning phase given in .
3.2. Collection and classification of performance data
The performance data(Building Life Cycle Management System, Citation2017) of 1969 mixed-use building projects were collected through the Building Life Cycle Management System of the Ministry of Land, Infrastructure, and Transport.
Prior to conducting the statistical analysis, the obtained performance data were randomly split into a data set of 1182 cases to be used for building a construction duration prediction model and a validation data set of 787 cases to validate the final selected prediction model. and show the descriptive statistics of the total performance data set and the data set used for developing the prediction model. It can be seen from that most of the construction regions are concentrated around the Seoul metropolitan area and Gyeongsang region and the construction structure is predominantly RC; the percentages of data collection are particularly low in the Jeolla region, Jeju-do, Gangwon region and the SRC and RC categories. This is due to the limitations in collection of the performance data in this study and must be improved upon in subsequent work.
4. Development of construction duration prediction model for mixed-use buildings
4.1. Process of development of the prediction models
illustrates the process of developing a construction duration prediction model for mixed-use buildings.
Figure 1. Process of developing a construction duration prediction model for mixed-use buildings.
As compared to the construction duration prediction model without transformation of variables (Prediction Model I), the model to be developed through transformation of independent variables (Prediction Model II) is expected to show a strong correlation between the dependent and independent variables, with a high Ra2 value and prediction accuracy. However, if the differences in the values of Ra2 and prediction accuracy between the two models are not large enough, there is no reason to opt for Prediction Model II, where the relationships between the variables are expressed in a complex manner, instead of choosing the simple and easy-to-understand Prediction Model I. We used a t-test to examine the difference in the predictive ability of the two models. If the test revealed a significant difference, the Prediction Model II was to be chosen as the final construction duration prediction model for mixed-use buildings, otherwise, the Prediction Model I would be the final choice.
4.2. Development of Prediction Model I
Through a stepwise selection method, six multiple regression models for Prediction Model I are presented as shown in . We chose the regression model at Step 6 with the maximum number of independent variables and highest value of Ra2 .
shows the results of the variance analysis for Prediction Model I. The chosen model has a significant probability of 0.000, which means that it is fit to explain the dependent variable.
To increase the value of R2, we identified six outliers (0.51% of the total data), which were observed to be more than 1.5 times the interquartile range (IQR) away from the 75th percentile and correspondingly removed these. As shown in , when the outliers were removed, the value of R2 increased to 0.605 with the Durbin–Watson value of 1.931, which suggests that there is no autocorrelation between the residuals.
presents the results of statistical analysis of the regression coefficients, t-test values for the coefficients, probabilities, and collinearity after the outliers were removed. The probabilities for the t-test values of all the regression coefficients are less than 0.05 indicating that each independent variable has a correlation with the dependent variable. As the values of VIF are less than 10, there is no multicollinearity.
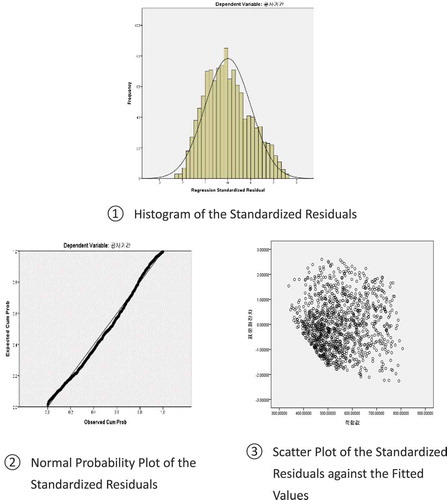
The assumptions of multiple regression analysis of the residuals were reviewed using graphs. illustrates a histogram, normal probability plot, and scatter plot of the standardized residuals against the fitted values. As the standardized residual histogram appears close to a normal distribution and the normal probability plot is a straight line, the assumption of residual normality holds good. In addition, the scatter plot of the standardized residuals against the fitted values shows randomly scattered dots, indicating that there is no correlation between the standardized residuals and fitted values.
Figure 2. Results of residual analysis of Prediction Model I.
4.3. Development of Prediction Model Ⅱ
The Prediction Model II is a multiple regression model that is developed after transforming each of the independent variables to have the highest value of r for the dependent variable (construction time) so as to reflect the characteristics of mixed-use buildings. Based on the results of variable transformation as shown in , we performed a multiple regression analysis after the independent variables were converted into ln (building area), ln (gross floor and area), and (number of stories above ground)2.
shows the results of stepwise selection for Prediction Model II. As in the Prediction Model I, six multiple regression models are presented, the only difference being that for the Prediction Model I, the multi-family housing variable is entered at Step 5 and the Chungcheong region variable at Step 6, whereas for the Prediction Model II, the Chungcheong region is entered at Step 5 followed by the multi-family housing at Step 6.
As in the case of Prediction Model I, the regression model at Step 6 with the maximum number of independent variables and highest value of Ra2 appears to be most suitable. However, the multicollinearity statistics given in show that the tolerance limit for the variable ln (gross floor area) is 0.099 and its VIF value is 10.067, suggesting a possibility of the presence of multicollinearity.
Multicollinearity is a state of very high intercorrelation among the independent variables, which is a violation of one of the assumptions of multiple regression analysis, according to which “the independent variables are not highly correlated with each other.” As shown in , when the variable ln (building area) was entered, its VIF increased to 9.470 and the variable ln (building area) also showed a high VIF of 7.152, indicating a strong correlation between the two variables.
shows the results of analysis of the correlation between the independent variables of Prediction Model II. The variables ln (gross floor area) and ln (building area) exhibit a very strong correlation of 0.819; therefore, we eliminated ln (building area) which has a lower correlation with the dependent variable, and reran the multiple regression analysis to resolve the issue of multicollinearity.
shows the results of multiple regression analysis of Prediction Model II carried out after the variable ln (building area) was removed. A slight decline in the value of R2 to 0.617 is observed, however, its significance probability is 0.000, suggesting that it is fit to explain the dependent variable. As the Durbin-Watson value is 1.906, there is no autocorrelation of residuals.
As for Prediction Model I, we examined the outliers of Prediction Model II, and first removed 20 (1.69% of the total) and then three (0.26% of the total) observed values to increase the value of R2.
As shown in , a significant probability of 0.000 and an R2 of 0.637, ie,, an increase of 0.02 in the value before removal of the outliers, was observed. The Durbin-Watson value was 1.904, indicating that there is no autocorrelation of residuals.
As shown in , the significance probabilities of the t-test values of all the regression coefficients are lower than 0.05; therefore, each of the independent variables is considered to be correlated with the dependent variable. The values of VIF of all the independent variables are less than 10, indicating that there is no multicollinearity.
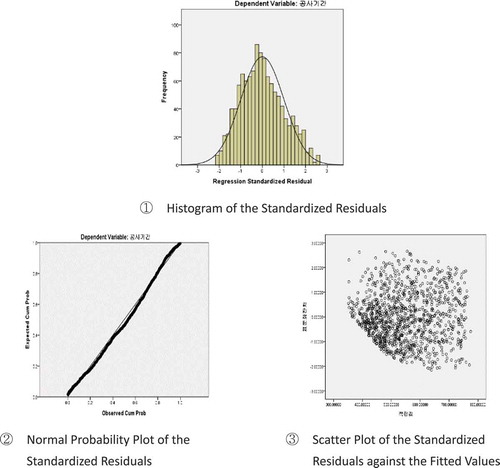
illustrates a histogram, normal probability plot, and scatter plot of the standardized residuals against the fitted values. The normal probability plot is a straight line with an intercept of zero and slope of one, and there seems to be no correlation between the standardized residuals and fitted values. This indicates an agreement with the assumptions of multiple linear regression analysis.
Figure 3. Results of residual analysis of Prediction Model II.
4.4. Selection of the final prediction model
The final construction duration prediction model for mixed-use buildings was selected by comparing the prediction accuracies and values of Ra2 of Prediction Models I and II, and conducting a t-test to determine the difference, if any, between the mean prediction accuracy of the two models.
As both the models have different numbers of independent variables, a comparison of the fits was done based on Ra2 rather than R2, as it is less affected by the number of independent variables. It can be seen from that the Prediction Model II has a higher value of Ra2 despite having a smaller number of independent variables. This suggests that this model is appropriate to explain the effect of independent variables on the dependent variable.
shows the descriptive statistics of the prediction accuracy of Prediction Models I and II. The prediction accuracy at this stage was calculated on the basis of the data set used for developing the models. The results show that the mean prediction accuracies of the Prediction Models I and II are 87.935% and 88.654%, respectively. A t-test was conducted to determine any significant difference between the mean prediction accuracies of the two models and the results are presented in .
According to the Levene’s test for equality of variances, the significance probability is 0.017; hence, the null hypothesis that “H0: the variances are equal” is rejected at α = 0.05 and the t-test results when homoscedasticity is not assumed should be evident. When homoscedasticity is not assumed, the two-tail test results show a t-value of −2.094 and significance probability of 0.036, rejecting the null hypothesis that “H0: there is no difference in the mean prediction accuracies of Prediction Models I and II” at α = 0.05, ie, there is a significant difference in the mean prediction accuracies of the two models.
Therefore, in this study, we selected Prediction Model II as the final construction duration prediction model for mixed-use buildings as its values of R2, Ra2, and prediction accuracy were higher than those of Prediction Model I. There was also a significant difference in the mean prediction accuracies of both the models. The equation for the selected construction duration prediction model is as follows:
In the above equation, the unit for gross floor area is m2, the categorical variables of Chungcheong Region and Multi-Family Housing are 1 (if applicable) or 0 (if not applicable) and inserted accordingly to calculate the duration of construction in days.
5. Validation of the construction duration prediction model for mixed-used buildings
5.1. Overview of the validation data set
The descriptive statistics of the performance data used for validating the final prediction model, ie,, the validation data set are shown in . This data set (N = 787) was randomly selected from the initial performance data (N = 1969).
5.2. Determination of the validity of the prediction model for mixed-use buildings
In this study, we developed Prediction Model I without variable transformation and Prediction Model II with transformation of the independent variables to obtain the highest values of r for the dependent variable, and chose the Prediction Model II as the final construction duration prediction model for mixed-use buildings.
In this section, we review the validity of the Prediction Model I and the finally chosen Prediction Model II based on the validation data set. The standards against which the validity is measured are RMSE and MAPE. These are metrics that are commonly used to measure the differences between estimated or predicted values and actually observed values, and computed by Equations (5) and (6):
where n: No. of observations, Pactual: Actual construction duration, and Ppredicted: Predicted construction duration.
shows the values of RMSE and MAPE of Prediction Models I and II. It can be seen that the values for Prediction Model II are lower by 2.88% and 0.39%, respectively.
Moreover, the prediction accuracy of Prediction Model II is superior to that of Prediction Model I by 0.39% in the mean value and 22.36% in the maximum value, as shown in .
The results of the analysis based on the validation data set show that the average prediction accuracy of the final prediction model is 88.51% with its values of RMSE and MAPE lower than those of Prediction Model I. Considering that this model will be applied in the project planning phase when the available data are extremely limited, the conclusions drawn here support its reliability and validity.
6. Conclusions
In response to the need for a construction duration prediction model for mixed-use buildings to be applied in the project planning phase, this study aimed to develop such a prediction model based on the performance data set of 1182 construction projects. We first selected the independent variables for the model by reviewing relevant literature and developed Prediction Model I without variable transformation and Prediction Model II with the transformation of the independent variables. We compared the respective values of R2, Ra2, and prediction accuracies and on the basis of a t-test of the mean prediction accuracies selected the final construction duration prediction model and validated it. The conclusions are as follows:
1) Through a review of the relevant literature, we selected the independent variables that are frequently applied and easy to obtain and use in the planning phase of construction projects. These were then divided into categorical variables (type of primary use, construction region, and structure type) and quantitative variables (gross floor area, building area, number of stories above ground, and number of stories below ground) and collected a data set of 1969 project cases.
2) Through a stepwise selection method, the gross floor area, number of stories below ground, number of stories above ground, building area, multi-family housing, and the Chungcheong region were selected as the independent variables for Prediction Model I. When six identified outliers (0.51% of the total data) were deleted, the model showed an R2 of 0.605, Ra2 of 0.603 with the Durbin-Watson value being 1.931, and it was observed that there was no autocorrelation of the residuals. The significance probabilities, t-test values of the regression coefficients, VIF values, and normality of the standardized residuals satisfied the required standards, suggesting that there was no violation of the assumptions of multiple linear regression analysis.
3) We transformed the quantitative independent variables to obtain the highest values of r with regard to the dependent variable and found that ln (building area), ln (gross floor area), (number of stories above ground)2, and number of stories below ground had the strongest relationship with the construction duration. Through a stepwise selection method, we chose the ln (gross floor area), number of stories below ground, (number of stories above ground)2, ln (building area), the Chungcheon region, and multi-family housing as the independent variables for the Prediction Model II. Between the two variables that caused multicollinearity, the ln (building area) was omitted as it had a lower correlation with the dependent variable. When 23 identified outliers were removed (20 first and then three), the Prediction Model II showed an R2 of 0.637, Ra2 of 0.635, and no evidence of any violation of the assumptions of multiple linear regression analysis. In this study, we selected the Prediction Model II as our final choice as it had higher values of R2 and Ra2. The prediction accuracy and following t-test showed that there was a significant difference in the mean prediction accuracies of the models.
4) Using a holdout sample of 787 project cases, we examined the accuracy and validity of the final prediction model. The results showed that the final model had lower values of RMSE and MAPE than those of Prediction Model I with its average prediction accuracy being 88.51%. Considering that the model would be applied in the project planning phase when the available data are extremely limited, the results supported the reliability and validity of the final prediction model.
The prediction model presented in this paper allows project stakeholders, including clients who need an estimate of construction time, to easily predict the duration of construction merely by entering the available data in the project planning phase. We expect that the model will facilitate the prediction of construction time based on a client’s requirements and design changes and ensure timeliness and reliability in the decision-making of project planners as well as clients in the project planning phase.
The collection of the performance data, however, had some limitations, as most of the construction regions were concentrated around the Seoul metropolitan area and Gyeongsang region, and the type of structure was predominantly RC. In particular, the percentages of data collection were extremely low in the Jeolla region, Jeju-do, and Gangwon region, and in the SRC and RC categories, which must be improved upon in subsequent work. Moreover, additional research into the types of primary and ancillary use of mixed-use buildings, variable transformation methods, and construction regions that were outside the scope of this study must be carried out to develop more specific and tailored construction duration prediction models for mixed-use buildings. It is anticipated that if our prediction model is improved upon as suggested, its applicability and usage will be further enhanced.
Disclosure statement
No potential conflict of interest was reported by the authors.
Additional information
Funding
Notes on contributors
Yoo-Jun Kim
Yoo-Jun Kim earned his master in Construction Management in the Department of Architectural Engineering in 2018 from Inha University. He currently works at Korea Engineering & Consulting Association.
Dong-Jun Yeom
Dong-Jun Yeom, who earned his Ph.D. in Construction Management in the Department of Architectural Engineering in 2018 from Inha University. He has given a series of lectures on computer-aided design, computer programming for engineering applications, construction information technologies, etc. at Inha University since 2015. He currently serves as a postdoctoral research engineer in Industrial Science and Technology Research Institute at Inha University.
Young Suk Kim
Dr. Young Suk Kim earned his Ph.D. in Construction Engineering and Project Management in 1997 from the University of Texas at Austin. He has given a series of lectures on the execution of building work, construction management, time management, cost management, contract management, construction information technology, and automation in construction, etc. at Inha University since 1999. He currently serves as a professor in the Department of Architectural Engineering at Inha University and a chairman of the University Development Commission at Korea Institute of Construction Engineering and Management. His research interests are in the areas of sustainable construction, cost and time management, engineering education, and automation in construction. He has conducted various research projects in terms of automation in construction: an Automated Pavement Crack Sealing Machine, Tele-operated Concrete Pipe Laying Manipulator in the Trenches, Automated Controller for Checking Verticality and Automated, Intelligent Excavating System, etc.
References
- Bayram, S. 2017. “Duration Prediction Models for Construction Projects: In Terms of Cost or Physical Characteristics?” KSCE Journal of Civil Engineering 21 (6): 2049–2060. doi:10.1007/s12205-016-0691-2.
- Bergeron, A. 2007. “Mixed-Use Developments: New Construction Trend Invades South Central Region.” South Central Construction.
- Bromilow, F. J. 1969. “Contract Time Performance Expectations and the Reality.” Building Forum 1 (3): 70‐80.
- Building Life Cycle Management System. 2017. “Mixed-Use Buildings in Korea between Year 2001 and 2016.” Ministry of Land, Infrastructure and Transport. https://blcm.go.kr/stat/customizedStatic/CustomizedStaticSupplyDetail.do
- Dursun, O. 2013. “Early Estimation of Project Determinants: Predictions through Establishing the Basis of New Building Projects in Germany.” PhD diss., University of Stuttgart.
- Dursun, O., and C. Stoy. 2012. “Determinants of Construction Duration for Building Projects in Germany.” Engineering, Construction and Architectural Management 19 (4): 444–446. doi:10.1108/09699981211237139.
- Herndon, J. D. 2011. “Mixed-use Development in Theory and Practice: Learning from Atlanta’s mixed Experiences.” http://hdl.handle.net/1853/40790
- Hwang, H. S., K. R. Kim, S. W. Suh, C. D. Kim, and D. W. Shin. 2002. “Analysis of Actual Duration by Effecting Elements to Duration Estimate - Focused on Standard Duration of the Office Building Construction.” Korean Journal of Construction Engineering and Management, KICEM 3 (3): 84–93. http://www.ndsl.kr/ndsl/search/detail/article/articleSearchResultDetail.do?cn=JAKO200220828325625&SITE=CLICK
- Jarkas, A. 2015. “Predicting Contract Duration for Building Construction: Is Bromilow’s Time-cost Model a Panacea?” Journal of Management in Engineering 32 (1): 1–8. doi:10.1061/(ASCE)ME.1943-5479.0000394.
- Kaka, A., and A. D. F. Price. 1991. “Relationship between Value and Duration of Construction Projects.” Construction Management & Economics 9 (4): 383–400. doi:10.1080/01446199100000030.
- Kim, S. W. 2007. Fundamentals of Statistics. 1st ed. Seoul: Hakjisa.
- Koo, C. W. 2007. “A CBR-Based Hybrid Model for Predicting Construction Duration and Cost based on Project Characteristics in Multi-Family Housing Projects.” MS thesis, University of Seoul, Seoul, Korea.
- Love, P. E. D., R. Y. C. Tse, and D. J. Edwards. 2005. “Time-cost Relationships in Australian Building Construction Projects.” Journal of Construction Engineering & Management 131 (2): 187–194. doi:10.1061/(ASCE)0733-9364(2005)131:2(187).
- Park, S. H. 2011. “Judgement Model for Construction Cost Appropriateness of Multi-Family Housing Projects in Planning Phase.” Master diss., University of Seoul.
- Rabianski, J., K. Gibler, O. Tidwell, and J. Sherwood Clements III. 2009. “Mixed-Use Development: A Call for Research.” Journal of Real Estate Literature 17 (2): 204–230. https://www.jstor.org/stable/44105055?seq=1#page_scan_tab_contents
- Seo, H. M. 2015. “Development of an Approximate Construction Period Prediction Model for Office Building in Project Planning Phase.” MS thesis, Inha University, Incheon, Korea.
- Sonmez, R. 2004. “Conceptual Cost Estimation of Building Projects with Regression Analysis and Neural Networks.” Canadian Journal of Civil Engineering 31 (4): 677–683. doi:10.1139/L07-127.
- Walker, D. H. T. 1995. “An Investigation into Construction Time Performance.” Construction Management and Economics 13 (3): 263‐274. doi:10.1080/01446199500000030.